Diagnostics
Path: Control Center -> Observability -> Diagnostics
Note
This page belongs to the Observability section in Control Center and is
intended to be reached from that sidebar path.
What Diagnostics Is
Diagnostics is the dependency-health view for Control Center services and nodes. Use it to confirm whether management servers, agent nodes, and their dependencies are healthy, degraded, or down during incident triage.
Purpose
The Diagnostics page provides real-time monitoring of platform health, node status, service dependencies, and system performance.
Step: Start Diagnostics Workflow
When to Use:
Use this when an issue is active and dependency health must be validated.
Purpose:
Capture complete triage evidence before remediation or escalation.
Steps:
Open
Control Center -> Observability -> Diagnostics.Review
Management ServersandAgent Nodesfor warning or offline rows.Open the affected row and capture current error state, timestamp, and node identifier.
Correlate with Observability.
Apply safe first-response checks, then escalate with collected evidence if unresolved.
Expected Outcome:
You can produce complete triage evidence in one pass and avoid random retry actions.
If this fails:
Recheck selected time range and dependency rows.
Continue with detailed diagnostics steps below.
What This Section Covers
This section covers:
where to open diagnostics views in the UI
how to read status/signals as a new user
what to collect (timestamp, object ID, errors, logs) before taking action
when to continue self-recovery vs escalate
Diagnostics Dashboard Guide
Purpose
The Diagnostics page provides real-time monitoring of platform health, node status, service dependencies, and system performance. Use this page to identify warning/offline nodes, open node-level diagnostics, analyze latency trends, and troubleshoot failing dependencies.
When to Use
Open this page when:
services are slow or unstable
operations fail repeatedly
dependency health must be validated quickly
you need evidence before escalation
Expected Outcome
After this guide, a new user can:
read the health posture from summary cards
identify management server and agent node health
interpret latency and error trends from node detail pages
identify affected dependencies and prioritize response
Step: Open Diagnostics
When to Use:
Use this first when validating current platform health during triage.
Purpose:
Confirm all Diagnostics components are visible before analysis.
Steps:
Open
Control Center -> Observability -> Diagnostics.Confirm the summary cards are visible at the top.
Confirm the
Management ServersandAgent Nodestables are visible.Review rows with
WarningorOfflinestatus first.
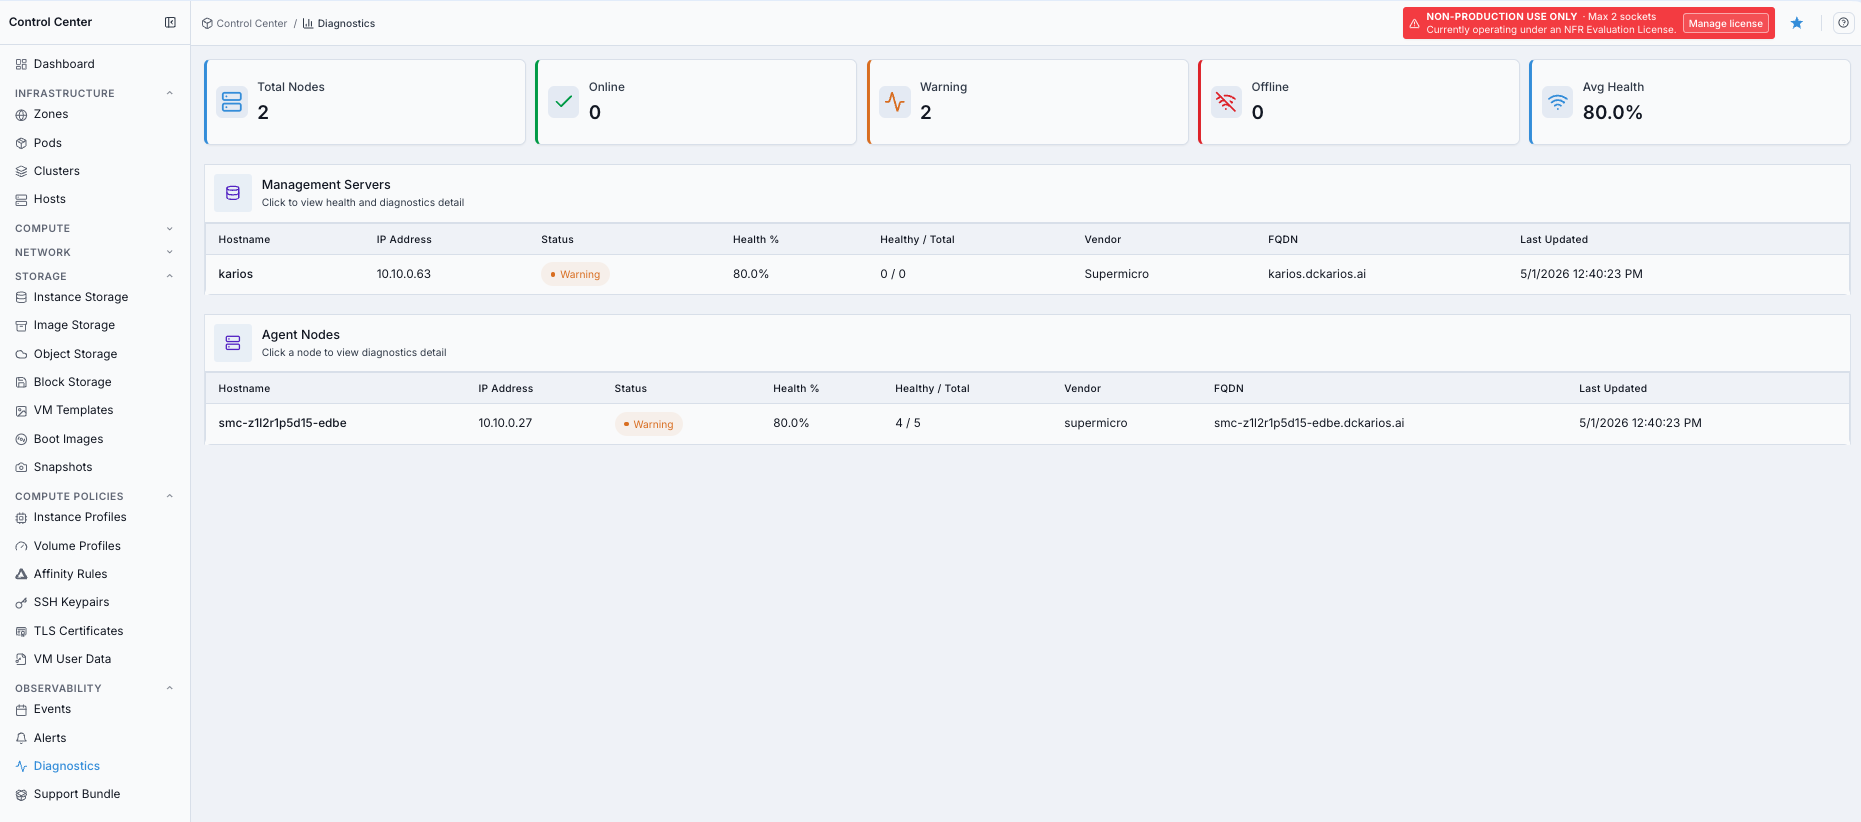
Diagnostics dashboard overview.
Expected Outcome:
Diagnostics dashboard is fully loaded with summary cards and node health rows.
If this fails:
Refresh page.
Re-open
Diagnosticsfrom the sidebar.
Step: Open Diagnostics Help
When to Use:
Use this when metric interpretation is unclear before taking action.
Purpose:
Confirm definitions for summary metrics, node health, chart signals, and dependency states.
Steps:
Click the help icon on the Diagnostics page.
Review metric definitions and status interpretation guidance.
Return to the dashboard and continue triage from the affected node row.
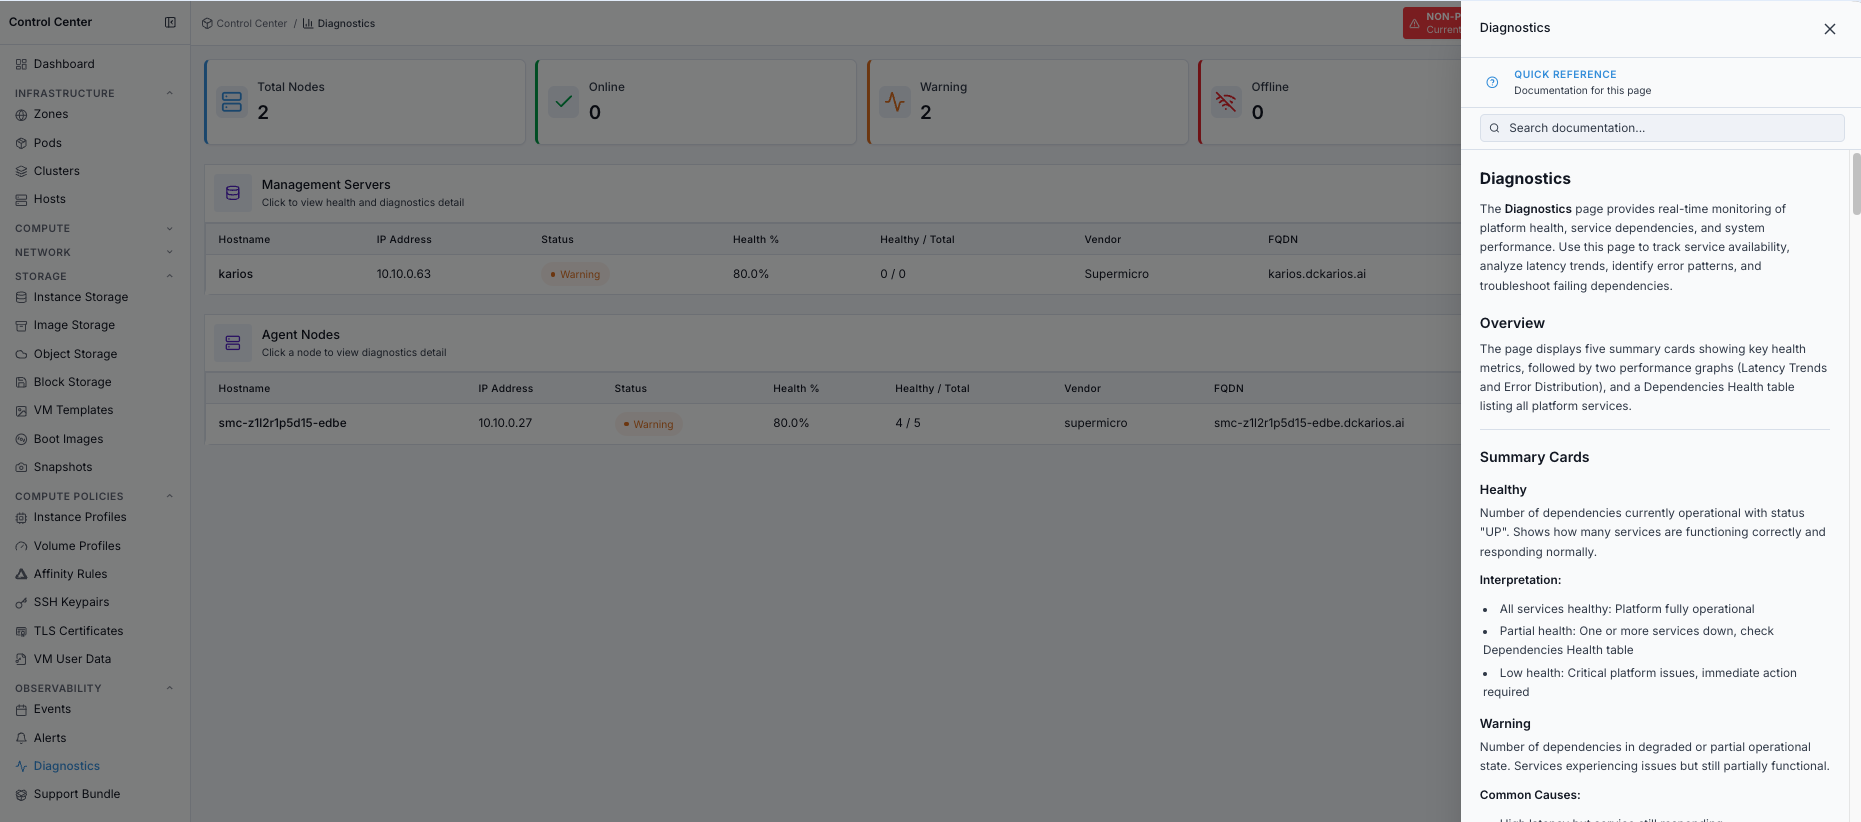
Diagnostics help panel.
Expected Outcome:
You can interpret Diagnostics fields consistently during triage.
If this fails:
Refresh page.
Continue with definitions in this guide if panel access is unavailable.
Overview: What This Screen Contains
The Diagnostics workflow is organized into three layers:
Dashboard summary:
Total Nodes,Online,Warning,Offline, andAvg HealthNode inventory:
Management ServersandAgent NodestablesNode details: health summary cards,
Latency Trends,Error Distribution, andDependencies Health
Dashboard Summary Cards
Total Nodes
Total number of management server and agent node rows currently visible to the Diagnostics page.
Interpretation:
Expected count: the page is receiving node inventory data
Unexpectedly low count: verify scope, registration state, and recent node changes
Online
Number of nodes reporting healthy status.
Interpretation:
All nodes online: platform health is normal from this view
Partial online count: review
WarningandOfflinecards and rows
Warning
Number of nodes in degraded or partial operational state.
Common causes:
elevated latency with continued response
intermittent connectivity issues
CPU/memory/disk pressure
Offline
Number of nodes currently unavailable.
Impact examples:
management server offline: platform management workflows may be affected
agent node offline: workloads or host-level operations may be affected
Action:
If
Offline > 0, open the affected row and review node details immediately.
Avg Health
Average health percentage across displayed nodes.
Interpretation:
90-100%: healthy70-89%: degraded, investigate warning rowsbelow
70%: serious platform health concern
Step: Open Management Server Details
When to Use:
Use this when the Management Servers table shows warning or offline health.
Purpose:
Review control-plane dependency health, latency trends, and error distribution.
Steps:
In
Management Servers, click the affected management server row.Review the detail page summary cards.
Check
Latency TrendsandError Distributionfor the selected time range.Review
Dependencies Healthfor the affected service.
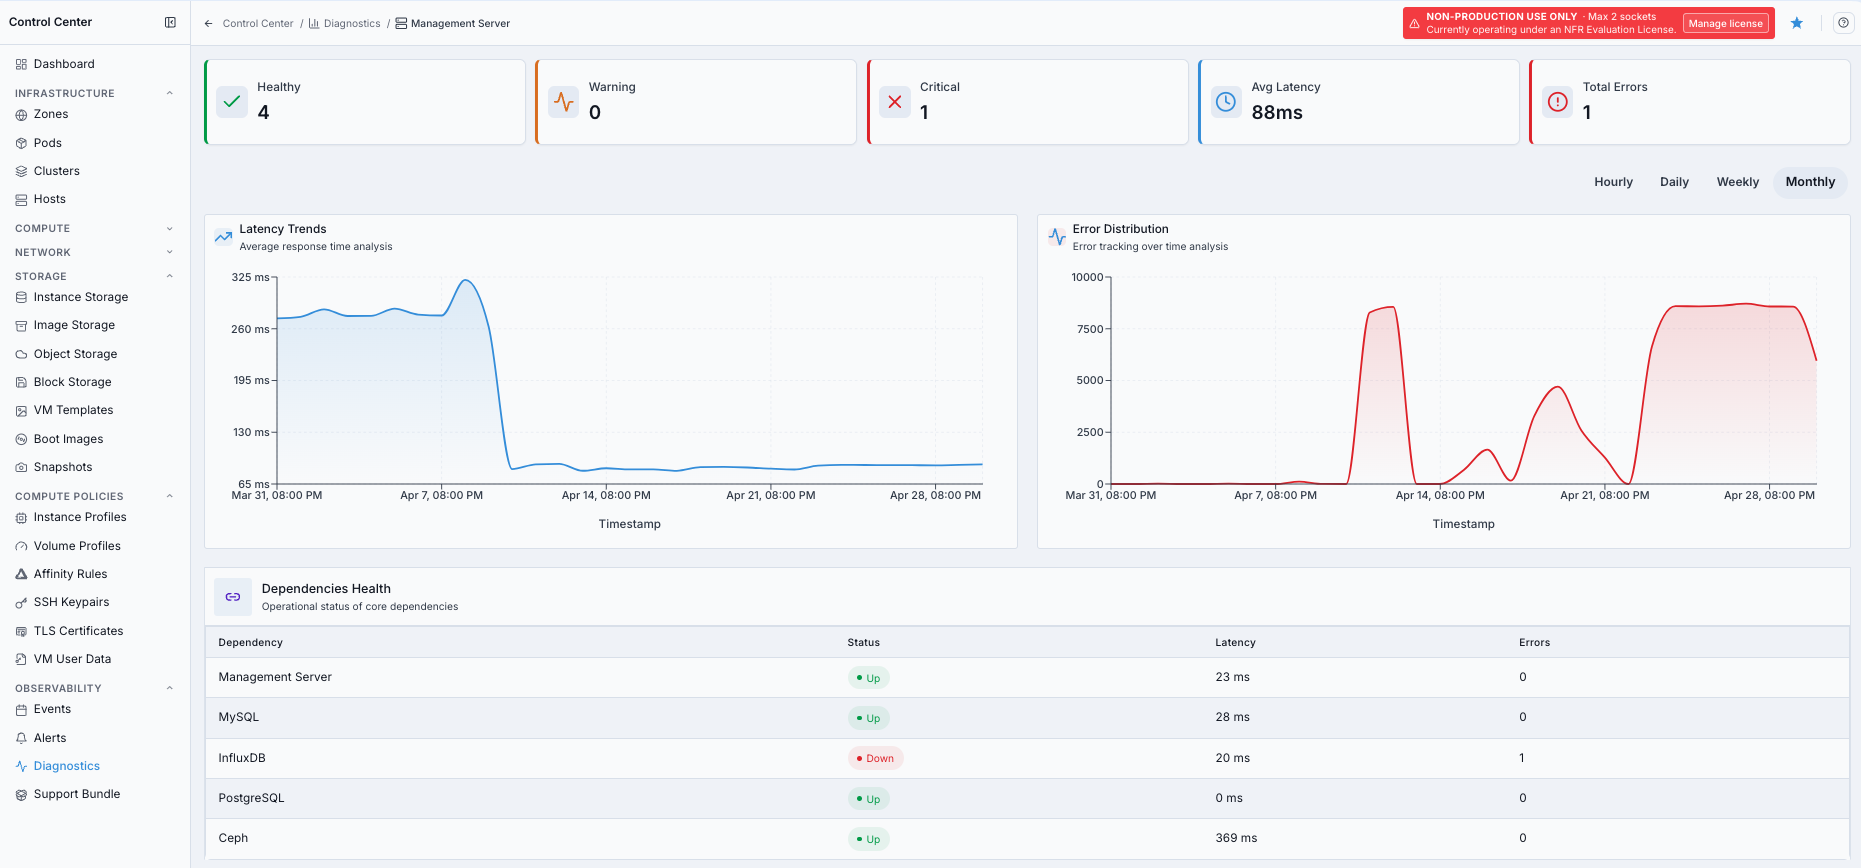
Management server diagnostics detail view.
Expected Outcome:
You can identify whether a management server dependency is healthy, degraded, or down.
Step: Open Agent Node Details
When to Use:
Use this when the Agent Nodes table shows warning or offline health.
Purpose:
Review host-level dependency health, latency trends, and error distribution.
Steps:
In
Agent Nodes, click the affected agent node row.Review the detail page summary cards.
Check
Latency TrendsandError Distributionfor the selected time range.Review
Dependencies Healthfor host services such asHost API,KVM Module,Libvirt Socket,Network Bridge, andNTP Sync.
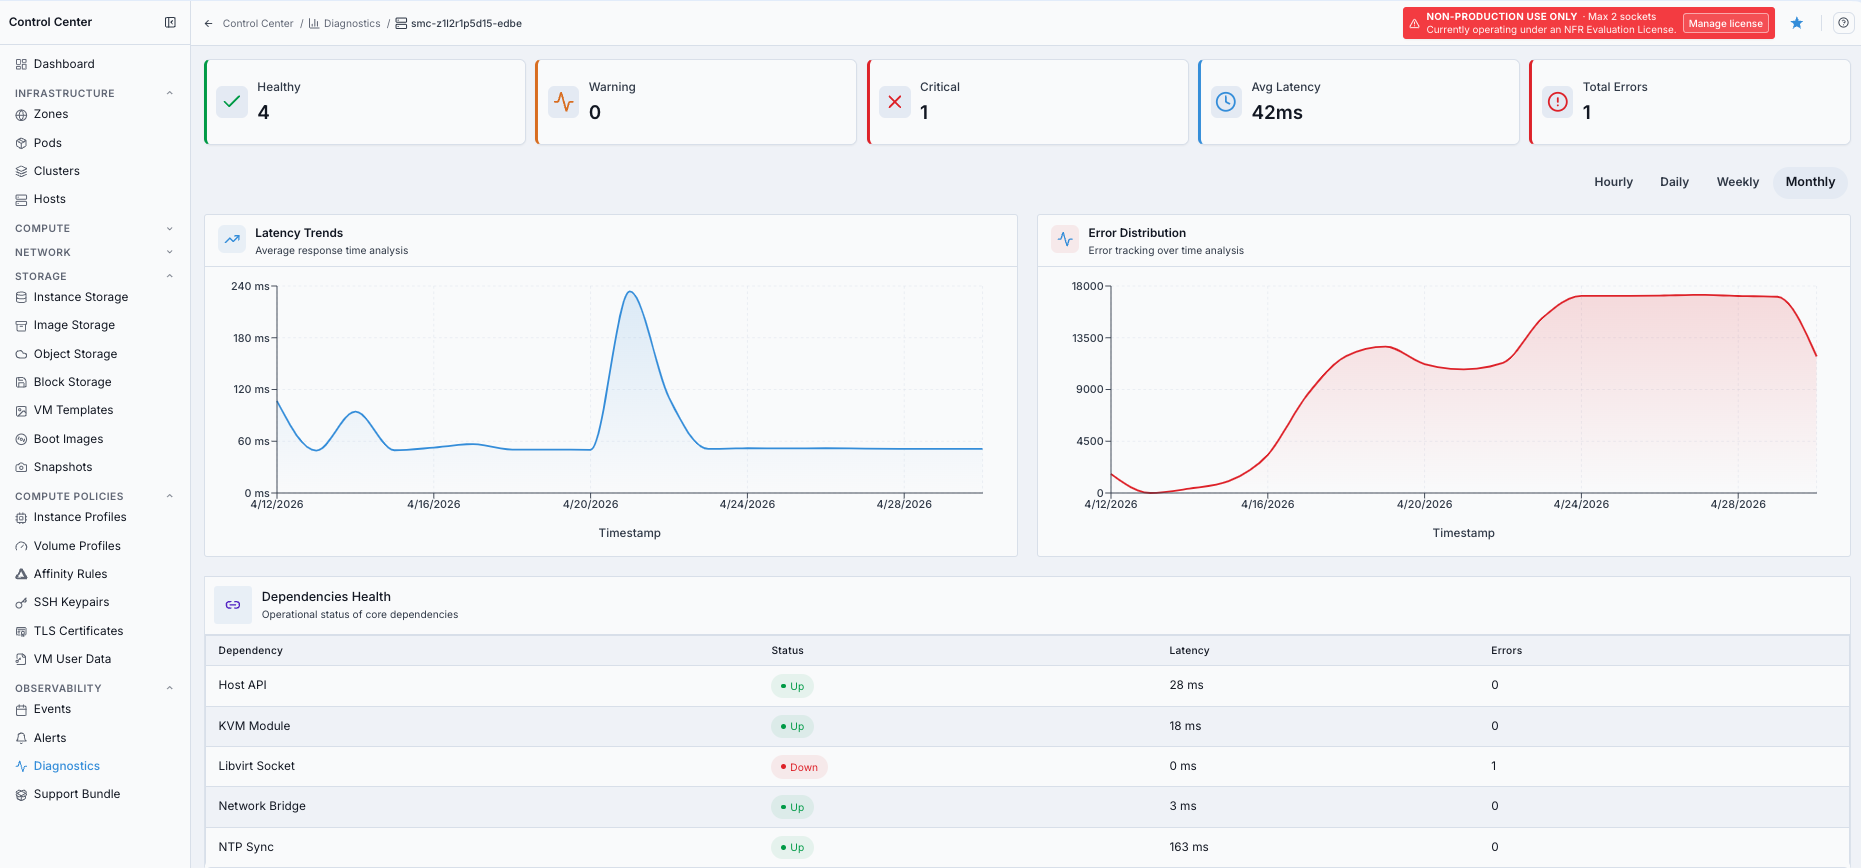
Agent node diagnostics detail view.
Expected Outcome:
You can identify whether an agent node dependency is healthy, degraded, or down.
Detail Summary Cards
Healthy
Number of dependencies currently operational with status UP.
Interpretation:
All services healthy: selected node is operational
Partial health: one or more services are degraded or down
Low health: immediate node-level investigation needed
Warning
Number of dependencies in degraded or partial operational state.
Critical
Number of dependencies fully unavailable (DOWN).
Action:
If
Critical > 0, checkDependencies Healthimmediately.
Avg Latency
Average response time across healthy dependencies, in milliseconds.
Threshold guidance:
0-50 ms: Excellent51-100 ms: Acceptable101-200 ms: Degraded200+ ms: Critical
Total Errors
Cumulative failed checks or errors across dependencies on the selected detail page.
Interpretation:
0: stable1-5: minor/transient6-20: moderate, investigate20+: serious, immediate investigation
Time Range Selector
The selector on a node detail page controls both charts.
Options:
Hourly: last 60 minutes, fine-grained troubleshootingDaily: last 24 hours, recent reviewWeekly: last 7 days, trend analysisMonthly: last 30 days, long-term view
Step: Analyze Latency Trends
When to Use:
Use this when services feel slow or response time degradation is suspected.
Purpose:
Understand how dependency latency changes over the selected period.
Steps:
Open the affected management server or agent node detail page.
Select a time range from the selector above the graphs.
Review
Latency Trendsfor flat, spiking, or sustained-high patterns.Correlate identified pattern with dependency status and errors.
Chart details:
area chart
Y-axis: latency (ms)
X-axis: time
Patterns and actions:
Pattern |
Meaning |
Action |
|---|---|---|
Flat line |
Stable latency |
Continue monitoring |
Gradual increase |
Progressive degradation |
Check resources and capacity |
Sharp spike |
Temporary incident |
Correlate with error graph and logs |
Periodic spikes |
Recurring workload/schedule impact |
Check scheduled jobs and timing |
Sustained high |
Ongoing degradation |
Immediate service investigation |
If this fails:
Note exact spike time.
Compare the same time in
Error Distribution.Check affected dependency rows and logs.
Expected Outcome:
Latency behavior is categorized and mapped to a clear follow-up action.
Step: Analyze Error Distribution
When to Use:
Use this when failures are intermittent, recurring, or increasing.
Purpose:
Track error growth patterns and correlate them with service incidents.
Steps:
Open the same node detail page used for latency review.
Select the same time range used for latency review.
Review
Error Distributionfor spikes, sustained growth, or periodic recurrence.Correlate identified pattern with dependency rows and recent operational changes.
Chart details:
area chart
Y-axis: error count
X-axis: time
Patterns and actions:
Pattern |
Meaning |
Action |
|---|---|---|
Zero errors |
No failures |
Continue monitoring |
Low background |
Minor transient issues |
Observe for recurrence |
Error spike |
Incident or outage window |
Check dependency table and logs |
Sustained high |
Ongoing service failure |
Immediate remediation |
Periodic spikes |
Recurring pattern |
Map to scheduled operations |
Climbing rate |
Progressive degradation |
Check resources and restart plan |
If this fails:
Switch to
DailyorWeeklyview.Check recurring time patterns.
Correlate with scheduled jobs or maintenance windows.
Expected Outcome:
Error pattern is identified and tied to a specific troubleshooting path.
Correlating Latency and Errors
Use both charts together:
High errors + high latency: overloaded/failing service
High errors + low latency: fast failures (for example configuration/auth path)
Low errors + high latency: slow service without full failure
Matching spikes in both graphs: single incident window to investigate
Step: Review Dependencies Health Table
When to Use:
Use this after chart review to identify the exact affected dependency.
Purpose:
Validate current service state with per-dependency status, latency, and error counts.
Steps:
Open the affected management server or agent node detail page.
Review each dependency row.
Prioritize rows with
Status=DOWNor elevatedLatencyandErrors.Capture affected dependency names for remediation and escalation.
Expected Outcome:
Impacted dependencies are identified with concrete row-level evidence.
If this fails:
Refresh the table and recheck the selected time window.
Correlate with
EventsandAlertsfor missing context.
Table columns:
Column |
Description |
|---|---|
|
Service name (for example Management Server, MySQL, InfluxDB, PostgreSQL) |
|
|
|
Current response time in milliseconds |
|
Current error count for that dependency |
Dependency Reference
Management server detail pages can include dependencies such as:
Management Server: control plane managementMySQL: core infrastructure metadata storeInfluxDB: time-series metrics databasePostgreSQL: audit/compliance data storeCeph: distributed storage backend
Agent node detail pages can include dependencies such as:
Host API: node management endpointKVM Module: virtualization kernel supportLibvirt Socket: VM control interfaceNetwork Bridge: host networking pathNTP Sync: clock synchronization
Status Meanings
UP:
responding normally
acceptable latency
no significant errors
PARTIAL:
service still responding
elevated latency and/or intermittent errors
requires monitoring and investigation if persistent
DOWN:
not responding
failed health checks
immediate investigation required
Step: Troubleshoot by Scenario
When to Use:
Use this when one or more dependencies show degraded or failed behavior.
Purpose:
Apply a consistent troubleshooting sequence by symptom type.
Steps:
Scenario 1: High latency
Check when the increase starts in
Latency Trends.Identify slow dependency rows in
Dependencies Health.Review host/service resources and logs.
Investigate sustained latency, not only spikes.
Scenario 2: One service down
Identify dependency with
Status=DOWN.Verify service state and host connectivity.
Review service logs around the incident timestamp.
Recheck table status after corrective action.
Scenario 3: Intermittent errors
Use
DailyorWeeklyto expose pattern timing.Check if spikes align with scheduled jobs.
Identify dependency with repeated errors.
Adjust workload timing or service capacity.
Scenario 4: Performance degradation over days
Switch to
Weekly/Monthlyview.Compare baseline vs current latency.
Check whether one or multiple dependencies are affected.
Plan capacity or optimization actions.
Warning
If Critical > 0 or sustained errors persist, escalate with timestamps and affected dependency names.
Expected Outcome:
A scenario-aligned troubleshooting path is selected and evidence is ready for escalation if unresolved.
If this fails:
Reconfirm dependency status and chart correlation in the same time window.
Capture screenshots plus affected dependency rows.
Escalate with timestamps, dependency names, and observed pattern.
Quick Reference
Task |
Where to look |
|---|---|
Check overall health |
Summary cards |
Identify slow services |
|
Find failing services |
|
Analyze performance trend |
|
Analyze failure pattern |
|
Compare periods |
Time range selector |
If metrics appear inconsistent:
Reconfirm time window.
Compare with
EventsandAlertsin the same period.