Alerts
Purpose
Alerts provides system-generated risk signals for infrastructure health, capacity, and operational failures.
When to Use
Use this page when you need to identify current risk, prioritize response, and verify whether issues recur.
Step: Start Alerts Workflow
When to Use:
Use this at the start of active-risk triage.
Purpose:
Prioritize actionable alerts and drive a consistent response sequence.
Steps:
Open
Control Center -> Observability -> Alerts.Filter by type/search and prioritize repeated or service-impacting failures.
Map each active alert to a triage action and assign owner/timestamp.
Re-check alert state after remediation changes.
Expected Outcome:
You can prioritize active risks and execute a repeatable first-response workflow.
If this fails:
Clear filters and reload newest alerts.
Continue with detailed steps in the included guide.
When to Use Alerts
Use Alerts when you need system-generated notifications for infrastructure events, thresholds, and operational issues.
Step: Review Alerts
When to Use:
Use this first when triaging active platform risk conditions.
Purpose:
Identify the highest-impact alerts and establish a response order.
Steps:
Open
Control Center -> Observability -> Alerts.Sort by
Sentto start with most recent alerts.Prioritize critical alert categories first (for example
Host DownandVM Error).Use filters and search to isolate related alerts before deep triage.
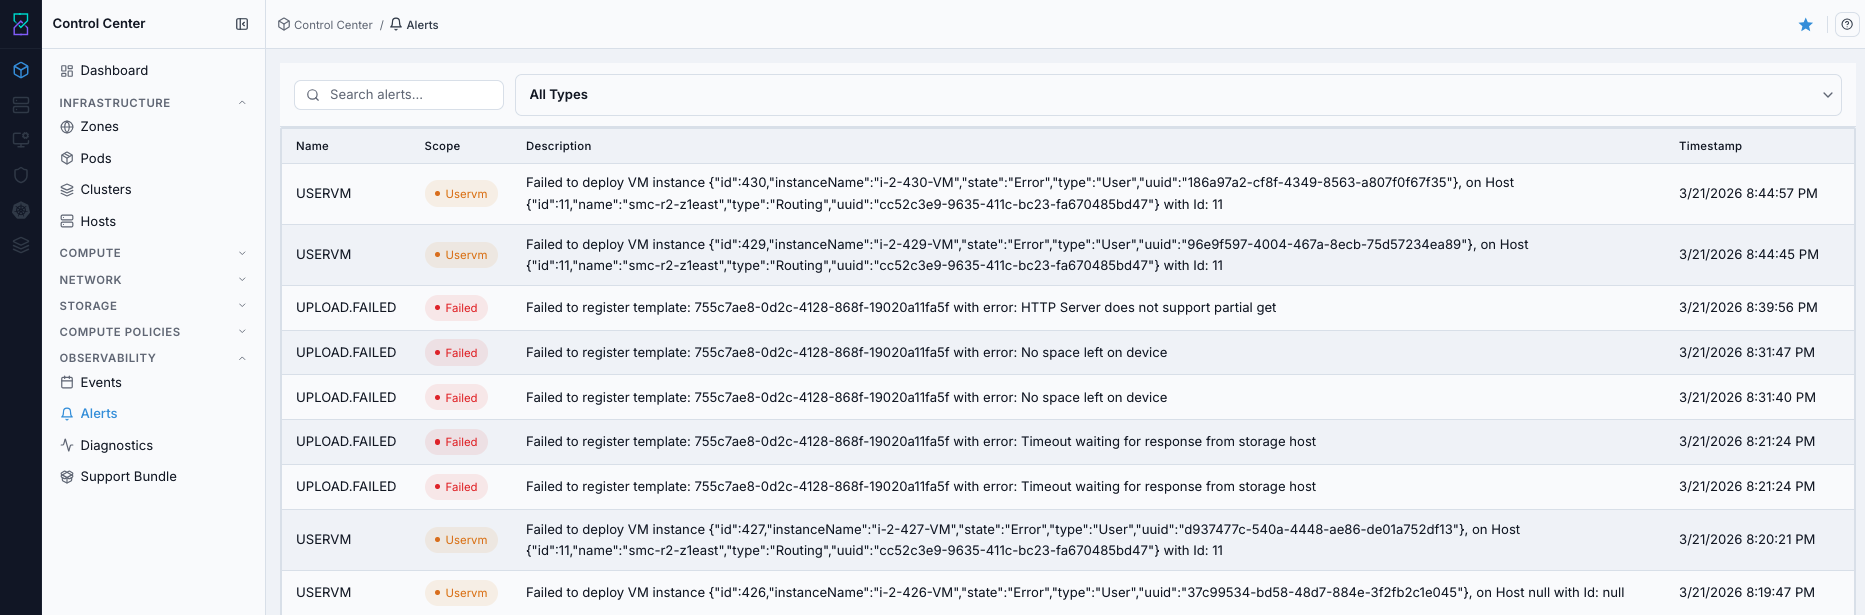
Alerts dashboard.
Tip
Sort by Sent first to assess current incident impact before reviewing older alerts.
Expected Outcome:
High-risk alerts are identified and ranked.
A clear action path exists for the highest-priority alert categories.
If this fails:
Clear filters and retry from newest rows.
Re-apply one filter at a time.
Step: Open Alerts Help
When to Use:
Use this when alert category meaning or operator action is unclear.
Purpose:
Confirm alert semantics and triage guidance before remediation decisions.
Steps:
On the Alerts page, click the help icon.
Review alert category guidance and triage context.
Return to the table and continue with type/search filters.
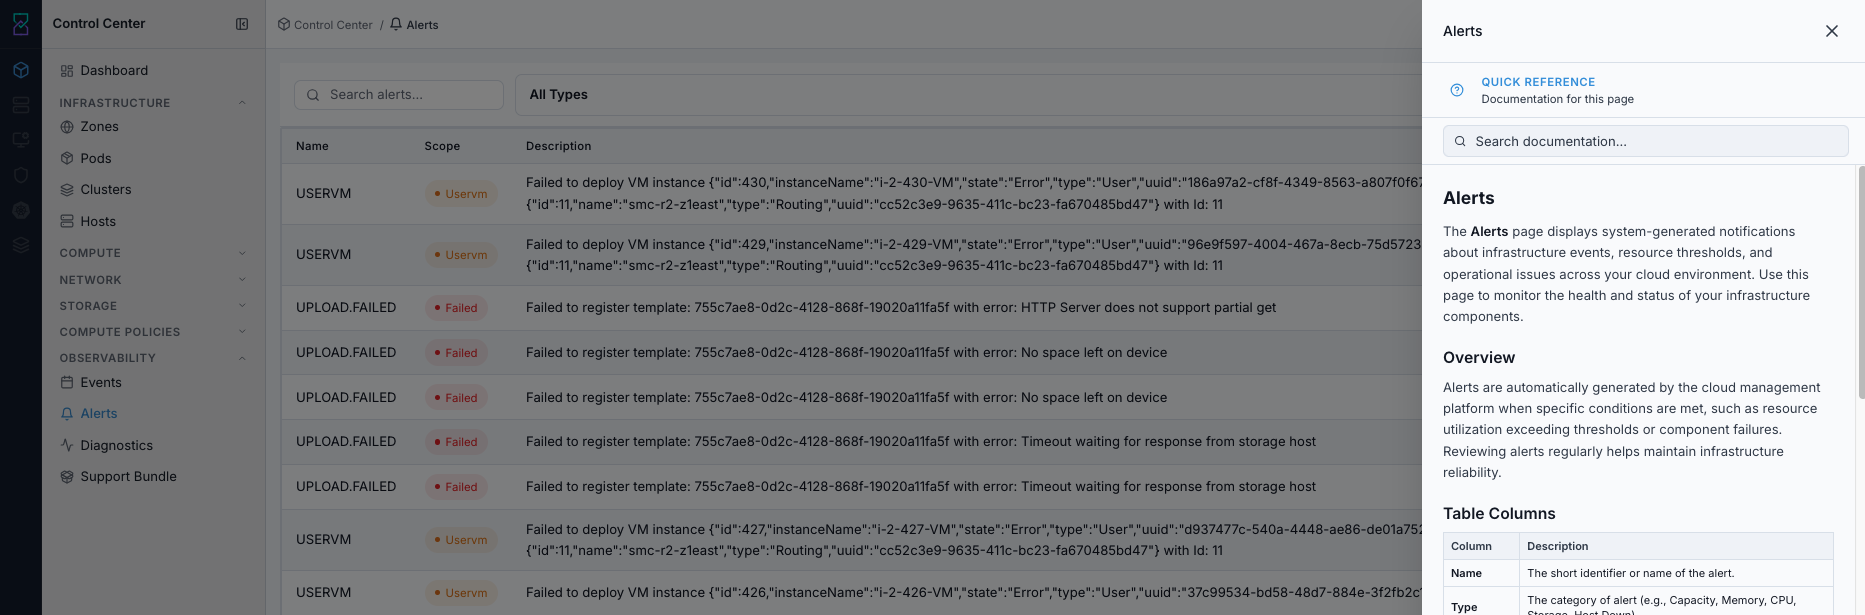
Alerts help panel.
Expected Outcome:
You can map alert categories to appropriate response actions.
If this fails:
Refresh and reopen help.
Continue with alert type definitions from this guide.
What the Alerts Table Shows
Column |
Description |
|---|---|
|
Short identifier/name of the alert. |
|
Alert category (for example Capacity, Memory, CPU, Storage, Host Down). |
|
Detailed trigger/context message for the alert. |
|
Alert message summary. |
|
Timestamp when the alert was generated/sent. |
Alert Type Reference
Type |
Description |
|---|---|
|
Overall resource capacity thresholds reached. |
|
Physical/virtual memory usage exceeded limits. |
|
Processor utilization is critically high. |
|
Storage pool usage exceeded thresholds. |
|
Allocated storage space is nearing limits. |
|
Public IP pool is nearing exhaustion. |
|
Private IP range is running low. |
|
Host node reported an issue. |
|
Virtual machine encountered an error. |
|
Domain virtual router has an issue. |
|
Console proxy service is not responding. |
|
Network routing issue detected. |
|
Miscellaneous storage subsystem issue. |
|
Usage data collection server issue. |
|
Management server reported a problem. |
|
Host node is unresponsive/offline. |
|
VM live migration encountered an error. |
|
Image Storage reported an issue. This alert type still uses the legacy backend name |
|
Usage server returned unexpected results. |
|
Storage deletion operation error. |
|
Resource count update failed. |
|
Usage sanity check found inconsistencies. |
|
Direct attached public IP issue detected. |
|
Local (non-shared) storage issue. |
|
Account/domain resource limits are being approached. |
|
Synchronization between components failed. |
|
Boot image/template upload operation failed. |
|
VM snapshot operation failed. |
Step: Filter and Search Alerts
When to Use:
Use this when alert volume is high and triage requires focused filtering.
Purpose:
Reduce alert noise to the affected service/resource and incident window.
Steps:
Use
All Typesto isolate a specific alert category.Use search to filter by alert name/content (host, VM, storage pool, or other keywords).
Use
Sentordering to focus on the newest alerts first.Narrow to a time window when investigating an incident.
Expected Outcome:
Filtered results contain only actionable alerts for the current incident path.
If this fails:
Keep only one
Typefilter active.Add one keyword for the affected resource.
Reduce to the exact incident window.
Step: Prioritize and Recheck Alerts
When to Use:
Use this after filtering alerts to decide response order and verify recurrence.
Purpose:
Apply a consistent triage sequence and confirm remediation effectiveness.
Steps:
Prioritize
Host DownandVM Errorfirst (highest service-impact risk).Prioritize
CapacityandStoragenext (resource planning and risk mitigation).Prioritize
MemoryandCPUfor workload balancing and scaling actions.Track
Resource Limitfor proactive quota expansion before operations are blocked.
Warning
Alerts do not resolve by themselves in workflow terms; address root cause and verify recurrence has stopped.
Expected Outcome:
Alert triage order is clear and active-risk items are worked first.
If this fails:
Confirm new
Senttimestamps are still appearing.Re-check dependencies and recent changes.
Escalate with alert IDs and timestamps.
Expected Outcome
You can identify which alert categories are highest risk.
You can filter quickly to the affected resources and time window.
You can apply a consistent triage process and verify recurrence is resolved.