Gateway
Path: Left sidebar > Object Storage > Gateway
Gateway Overview
The Gateway page shows running RADOS Gateway (RGW) instances, their zone/realm configuration, and per-daemon performance counters. RGW daemons are the S3/Swift API endpoints that receive client requests.
The Gateway page has three tabs:
Gateways
Overall Performance
Sync Performance
Actions in This Screen:
Control |
What Happens When You Click |
|---|---|
|
Opens daemon table view for per-instance status and expanded row inspection. |
|
Opens cluster-level gateway metric view. |
|
Opens multi-site replication metric view (or expected single-site empty state). |
Row chevron |
Expands one daemon row and shows |
Note
You cannot create or delete gateway daemons from this page. Gateway
deployment is managed via Infrastructure > Services.
Gateways Tab
Path: Object Storage > Gateway > Gateways
Lists all running RGW daemon instances across your cluster.
Purpose:
To confirm RGW daemons are available to serve S3/Swift traffic.
To verify zone/realm assignment before troubleshooting client or sync issues.
When to Use:
During initial Object Storage validation.
Before pointing clients to the gateway endpoint.
When users report request failures or high latency.
Gateway List - Column Reference
Column |
What It Shows |
|---|---|
ID |
Daemon instance name |
Hostname |
Host this daemon is running on |
Version |
Ceph version of this RGW daemon |
Port |
HTTP/HTTPS port this daemon is listening on |
Realm |
Realm this daemon belongs to (for multi-site) |
Zone / Zonegroup |
Zone and zonegroup assignment (for multi-site replication) |
Status |
Daemon state such as |
Note
Treat the status text (for example Running) as the source of truth.
Indicator colors can vary by UI theme.
What healthy looks like:
All listed daemons should show
Status = Running.
Warning
If one or more daemons show Stopped or non-running status, do not treat
Gateway as healthy. Resolve daemon health first before onboarding clients or
investigating higher-layer application errors.
Steps:
Open
Object Storage > Gateway.Confirm
Gatewaystab is selected.Review each row in the table (ID, Hostname, Version, Port, Realm, Zone/Zonegroup, Status).
If needed, click chevron
>on a row to expand daemon details.In expanded view, keep
Detailsselected to review daemon identity and placement values.Click
Performance Counterstab to inspect per-daemon counters.
Expected Outcome:
You confirm which daemons are running.
You identify which host/zone each daemon serves.
You get daemon-level counters for targeted troubleshooting.
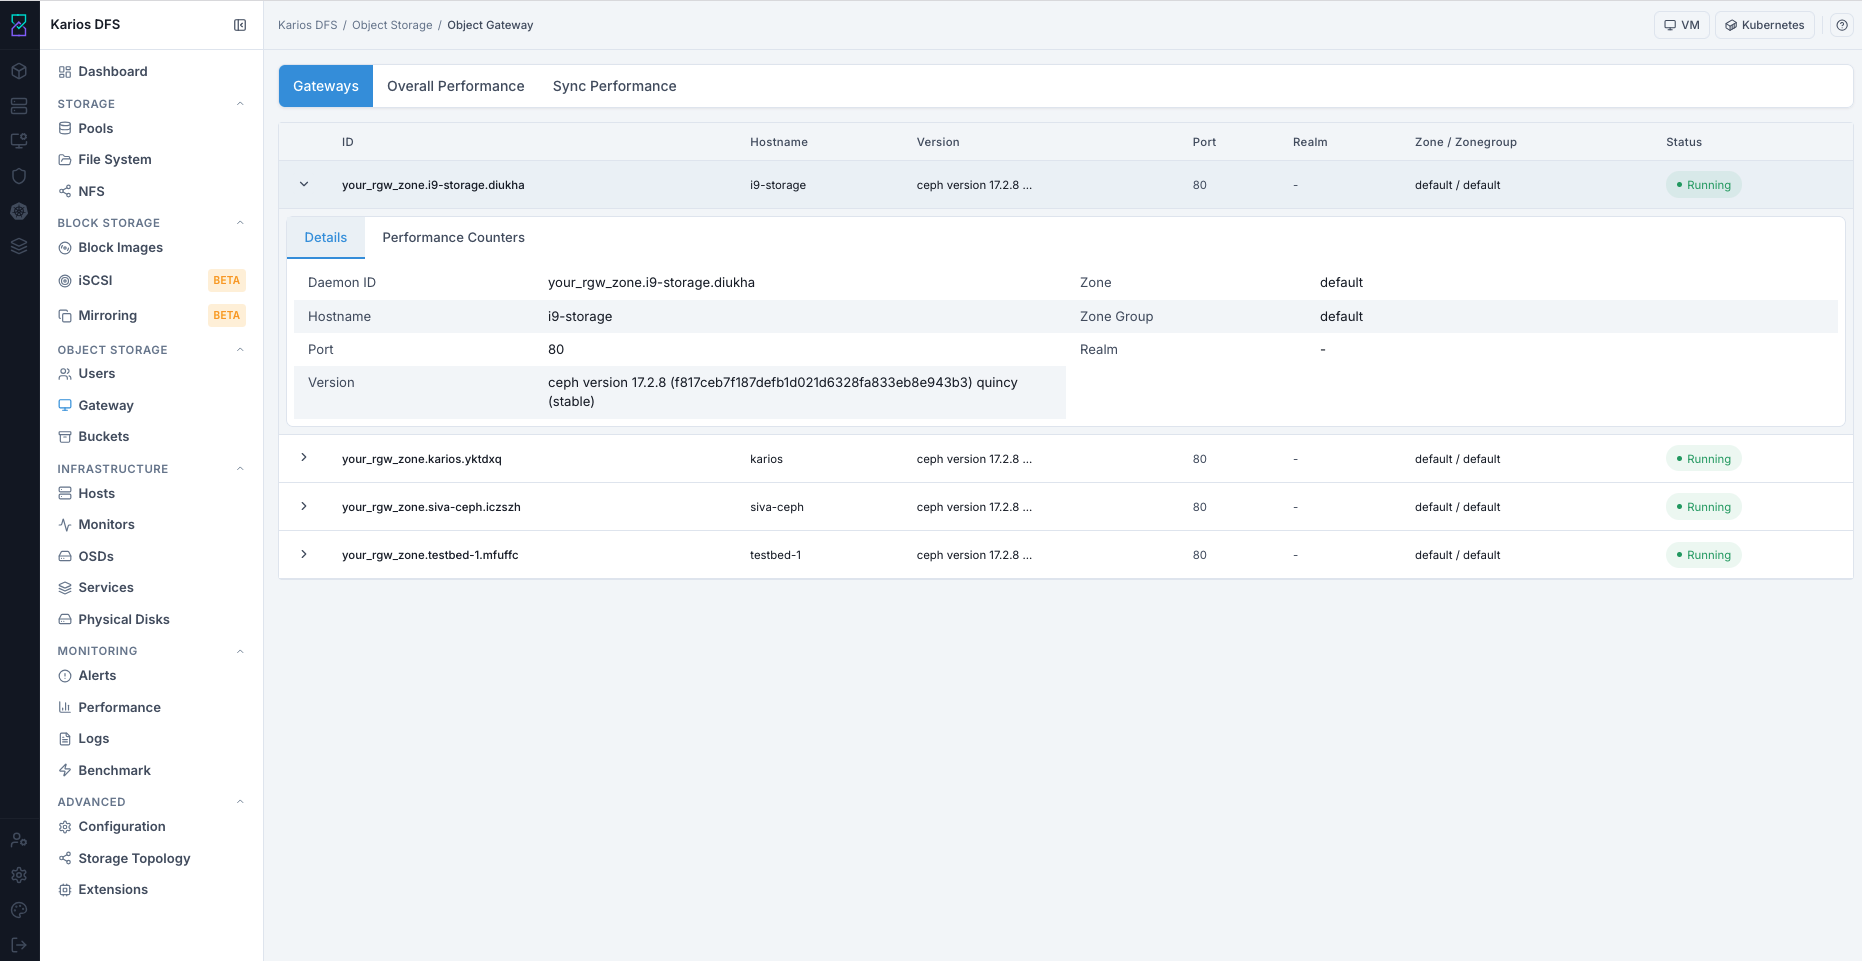
What This Screenshot Shows: Gateways Tab With Expanded Daemon Row (UI Reference; Values Depend On Your Environment).
Gateway Details - Expanded Row
Click chevron > on a gateway row to expand details.
Purpose:
To inspect one specific daemon in detail instead of only cluster-level status.
To verify daemon identity/config context before taking remediation steps.
To isolate which daemon is producing errors or latency.
When to Use:
When a daemon row is not
Running.When clients report intermittent failures and you need per-daemon evidence.
When comparing daemons across hosts/zones after an incident or maintenance.
Expanded tabs:
DetailsPerformance Counters
Details Tab
Shows full daemon configuration context for this instance.
In your current screenshot, this includes Daemon ID, Hostname, Port, Version, Zone, Zone Group, and Realm.
Some environments also expose additional daemon configuration fields.
Performance Counters Tab:
Shows a live table of Ceph performance counters reported by this daemon.
Each row shows counter name, current value, and description.
Use these counters to diagnose request latency and error rates at daemon level.
Warning
Do not conclude cluster-wide health from one daemon row only. Always compare counters across multiple daemon rows before deciding root cause.
Steps:
In
Gatewaystab, locate the daemon row you want to inspect.Click chevron
>to expand the row.In
Details, verify daemon identity and zone/realm placement values.Click
Performance Countersand review relevant counters for request/error behavior.Repeat on other daemon rows if you need cross-daemon comparison.
Expected Outcome:
You confirm daemon-level configuration context.
You collect per-daemon counter evidence for troubleshooting.
You can decide whether the issue is isolated to one daemon or cluster-wide.
Tip
Gateway row host/port shows daemon-level listeners. Client applications can use a different endpoint URL (for example LB/DNS and HTTPS) based on your deployment design.
Note
This page is observability-focused. Deployment lifecycle actions for gateway
daemons are handled from Infrastructure > Services.
Overall Performance Tab
Path: Object Storage > Gateway > Overall Performance
Shows cluster-wide RGW metrics including total request rate, GET/PUT throughput, and error rates across all gateways.
Purpose:
To check high-level RGW health across all daemons from one place.
To quickly detect cluster-wide request load or error trends.
When to Use:
After validating individual daemon status in
Gatewaystab.During incident triage when many users are affected.
After maintenance to confirm service stability.
Metric Card |
What It Shows |
|---|---|
Total Daemons |
Total number of RGW daemons running in the cluster |
Zones |
Number of RGW zones configured |
Zone Groups |
Number of RGW zone groups configured |
Note
Detailed metrics on this tab require Prometheus integration. If Prometheus is not connected, only available summary views are shown.
Steps:
Open
Object Storage > Gateway.Click
Overall Performancetab.Review summary cards shown in your environment.
If detailed charts are unavailable, use expanded daemon
Performance CountersfromGatewaystab for deeper analysis.
Expected Outcome:
You get cluster-level gateway health context.
You confirm total daemon and multi-site structure visibility.
You know whether to continue with daemon-level counters for root-cause analysis.
Warning
If cluster-wide error rates are elevated or request rate drops unexpectedly,
treat this as a service-impact signal and drill down immediately using
per-daemon Performance Counters.
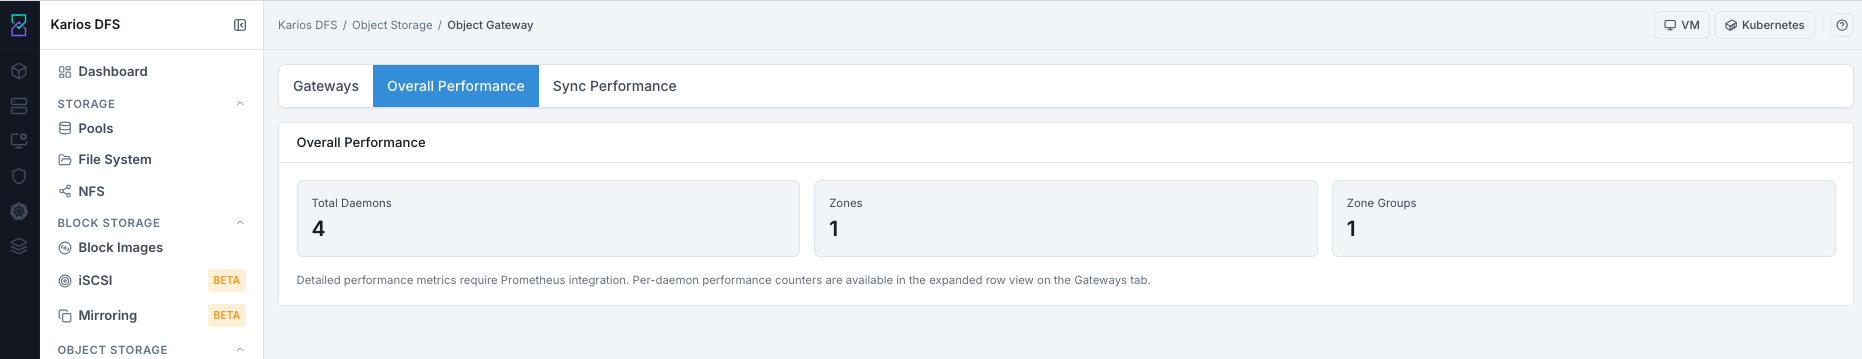
What This Screenshot Shows: Overall Performance Tab (UI Reference; Values Depend On Your Environment).
Sync Performance Tab
Path: Object Storage > Gateway > Sync Performance
For multi-site deployments, this tab shows replication lag, sync pipe throughput, and error counts between zones.
Purpose:
To validate multi-site replication health.
To detect lag or sync errors between zones.
When to Use:
In multi-site environments after deployment or topology changes.
When replication delay is reported by downstream teams.
Empty state (Multisite sync metrics will appear here...) is normal for
single-site deployments.
Steps:
Open
Object Storage > Gateway.Click
Sync Performancetab.Check whether replication metrics are populated.
If the empty-state message is shown, confirm whether your deployment is single-site.
Expected Outcome:
Multi-site: You can monitor sync lag/throughput/error behavior.
Single-site: You confirm empty state is expected and not a fault.
Warning
In multi-site deployments, sustained sync lag or repeated sync errors can cause stale object visibility across zones. Investigate before promoting cross-zone workloads that require up-to-date data.
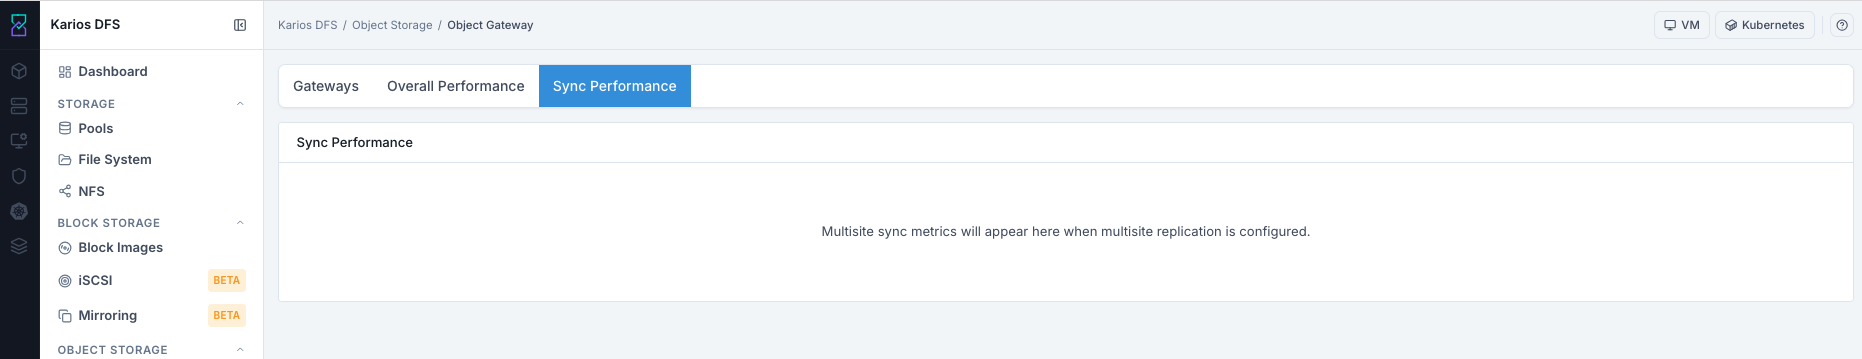
What This Screenshot Shows: Sync Performance Tab (UI Reference; Values Depend On Your Environment).
Troubleshooting - Gateway
Purpose:
To restore gateway availability when client requests fail.
To isolate whether the issue is daemon-level, cluster-wide, or multi-site sync.
When to Use:
Any daemon status is not
Running.Overall error rates increase or request throughput drops.
Sync lag or sync errors persist in multi-site deployments.
Steps:
Open
Gateway > Gatewaysand verify daemon status for all rows.Expand affected rows and review
Performance Countersfor error-heavy daemons.Open
Overall Performanceto confirm whether impact is cluster-wide.If multi-site is enabled, open
Sync Performanceand verify lag/error behavior.If daemon health is degraded, move to
Infrastructure > Servicesand recover RGW service.
Expected Outcome:
You identify the failure scope (single daemon, all daemons, or sync path).
You choose the correct remediation path faster.
You reduce guesswork before escalating to support.
Problem You See |
Most Likely Cause |
What To Do |
|---|---|---|
Daemon status not |
RGW daemon down on host |
Go to |
Total Daemons lower than expected |
One or more daemons not running |
Check each row status and fix affected hosts |
Sync Performance tab empty |
Multisite not configured |
Expected in single-site deployment; no action needed |
S3 clients cannot connect |
Wrong endpoint or daemon down |
Validate host:port reachability and confirm at least one running daemon |
High gateway error rate |
Request failures on one or more daemons |
Open |
High replication lag in Sync Performance |
Inter-zone sync delay or link issue |
Check zone connectivity, daemon health, and sync error counters |
Warning
Avoid restarting all gateway daemons at the same time unless explicitly required by your operational runbook. Staggered recovery helps preserve API availability.
Note
If issue persists, raise a support ticket via Monitoring > Alerts or
Karios Support.
Key Concepts
Realm / Zonegroup / Zone
This is the RGW multi-site hierarchy:
A realm spans multiple zonegroups.
Each zonegroup contains zones.
Each zone is served by one or more RGW daemons.
Data replicates between zones in a zonegroup.
Load Balancing
For high availability:
Deploy multiple RGW daemons.
Place a load balancer (for example HAProxy or nginx) in front of them.
RGW daemons are stateless, so requests can be distributed across instances.
Performance Counters
Per-daemon counters help identify which operation types create load or errors. Common counters include:
reqgetputdelcopylist
Quick Validation Checklist
Use this checklist to confirm Gateway is healthy for first-time onboarding:
Open
Gatewaystab and verify all daemon rows showStatus = Running.Expand at least one daemon row and review
Detailsvalues for expected host/zone context.Open
Performance Countersand confirm counters are visible for that daemon.Open
Overall Performanceand verify summary cards are present.Open
Sync Performance:Multi-site: verify metrics are populated.
Single-site: verify empty-state message is shown.
Expected Outcome:
You confirm daemon availability, per-daemon diagnostics, and cluster-level visibility.
You verify whether multi-site sync observability is active or correctly empty for single-site.