Network
Note
Use this section for network operations across Physical Network, Guest Network, SDN Fabric, Network Topology, IPAM, DNS Analytics, and VPCs.
See also
Prerequisites for network changes:
Infrastructure with at least one enabled zone/pod/cluster
Virtual Machines if validating network behavior with live workloads
Appendices for quick troubleshooting references
Table of Contents
Network Overview
Physical Networks
Guest Networks
SDN Fabric
Network Topology
IPAM
DNS Analytics
VPCs
Quick Tasks
Use Network Quick Tasks for fast, action-only workflows.
Common screen checks
Use these checks for read-only network dashboard and table views before retrying:
Confirm you are in the correct zone or environment scope for the target network object.
Verify your role can view or manage network resources in that scope.
If expected rows are missing, re-check upstream Infrastructure state before retrying.
1. Network Overview
1.1. Network Types
Physical Networks
Zone-level network configuration
Defines traffic types (Guest, Management, Storage, Public)
Sets isolation method (VLAN, VXLAN, or GRE)
Template for infrastructure networking
Guest Networks
VM-level network configuration
Two types: Isolated and Shared
VMs connect to guest networks
Provides network services to VMs
Isolation Method Selection (VLAN vs VXLAN vs GRE)
Use this quick guide when creating or updating physical networks:
Method |
Choose when |
Watch-outs |
|---|---|---|
|
You need simple L2 segmentation and your switch fabric is already VLAN-based. |
Limited ID space (1-4094), requires switch trunk/allowed-VLAN alignment. |
|
You need large-scale tenant segmentation or stretched overlay design across L3 underlay. |
Requires overlay-capable network design and MTU headroom for encapsulation overhead. |
|
You need routed tunnel-style isolation where GRE is a defined platform standard. |
Confirm hardware/network policy support first; avoid ad-hoc GRE use without architecture approval. |
1.1.1. Why Configure Traffic Types
Traffic types exist so each class of traffic can be controlled independently for reliability, security, and scale.
Traffic Type |
Why it exists |
When you need to add/change it |
|---|---|---|
Management |
Carries host and system-VM control-plane communication. |
Add or expand when onboarding more hosts/system VMs or when management IP capacity is low. |
Storage |
Carries host-to-storage I/O paths and helps isolate storage load from other traffic. |
Add or expand when storage traffic grows, latency is high, or storage IP capacity is low. |
Public |
Provides internet-facing IP space for NAT, port forwarding, VPN, and external exposure. |
Add when workloads need public ingress/egress; skip for internal-only deployments. |
Guest |
Defines the VM-attached networks where workload traffic actually flows. |
Change when you need new tenant/network segments, custom VLAN/VXLAN mapping, or shared-subnet design. |
1.1.2. Guest Network Type Descriptions (Plain Language)
Isolated: private VM network with built-in network services (DHCP/NAT/firewall).Shared: flat VM network on a shared subnet. Use when VMs must be directly reachable on an existing network design.
1.2. Network Hierarchy
Zone
└── Physical Network
├── Guest Traffic Type → Guest Networks (VMs)
├── Management Traffic Type (Hosts, System VMs)
├── Storage Traffic Type (Storage communication)
└── Public Traffic Type (External access)
1.3. Network Modules (UI)
The Network sidebar currently includes:
Physical Network:
Control Center -> Network -> Physical NetworkGuest Network:
Control Center -> Network -> Guest NetworkSDN Fabric:
Control Center -> Network -> SDN FabricNetwork Topology:
Control Center -> Network -> Network TopologyIPAM:
Control Center -> Network -> IPAMDNS Analytics:
Control Center -> Network -> DNS AnalyticsVPCs:
Control Center -> Network -> VPCs
Note
This guide includes full new-user paths for all network modules listed above, including
VPCs. The SDN Fabric section in particular covers the full
lifecycle — first-time setup (Add fabric switch, with the underlay preflight as a
hard gate), the health dashboard and BGP/OSPF/EVPN/RIB node tabs, and the troubleshooting
flow.
2. Physical Networks
2.1. What are Physical Networks?
Physical Networks are zone-level templates for host bridge configuration. They model how cloud traffic flows under the hood and define the parent isolation policy used by guest networks.
2.1.1. Key Concepts
Zone: every physical network belongs to exactly one zone.
Isolation Method: VLAN (Layer-2 tagging), VXLAN (overlay tunneling), or GRE (encapsulation tunnel) for tenant separation.
VLAN/VNI Range: pool consumed when new guest networks are created. VNI means
VXLAN Network Identifier.Traffic Types: Guest, Management, Public, and Storage traffic categories.
Broadcast Domain Range: scope of broadcast domains (
ZONEorPOD).Guest Network Inheritance: guest NIC networks inherit parent physical-network isolation settings.
2.1.2. Table Columns
Column |
Description |
|---|---|
Physical Network |
Network name. Click to open details. |
State |
|
Isolation Method |
Tenant isolation mode (VLAN, VXLAN, or GRE). |
VLAN / VNI |
Allocated ID range (for example |
Tags |
Labels used for organization and filtering. |
Actions |
Row action icons for Edit and Enable/Disable. |
2.2. Physical Network Dashboard
When to Use:
Use this before creating, editing, or troubleshooting physical-network configuration.
Purpose:
Validate existing physical networks, isolation methods, and action availability from a single dashboard.
Path:
Control Center -> Network -> Physical Network
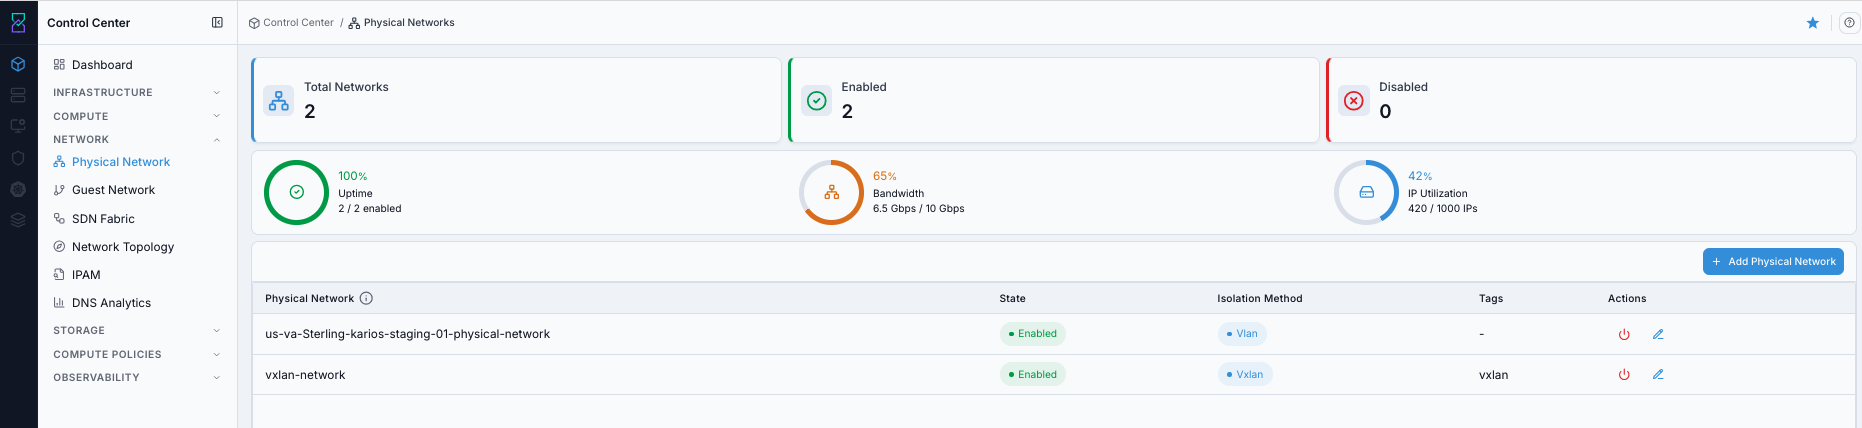
Dashboard usage:
Review each row for
StateandIsolation Methodbefore making changes.Click a
Physical Networkname to open details.Click
+ Add Physical Network(top-right) to open the create form.Use the
Actionscolumn icons to edit network settings or toggle enabled/disabled state.Use the info icon beside
Physical Networkin the table header for quick context.
Expected Outcome:
You can identify the correct network row for your next action.
You can confirm whether target networks are
Enabledbefore creating dependent resources.
If this fails:
See Common screen checks before retrying this screen.
2.2.1. Open Physical Network Help Panel
When to Use:
Use this when you need inline definitions and quick-reference guidance for the Physical Network page.
Purpose:
Open the page help panel after reviewing the dashboard so field meanings and actions are clear.
Steps:
Open
Control Center -> Network -> Physical Network.Click the top-right help icon.
Review the quick-reference panel and search inside it if needed.
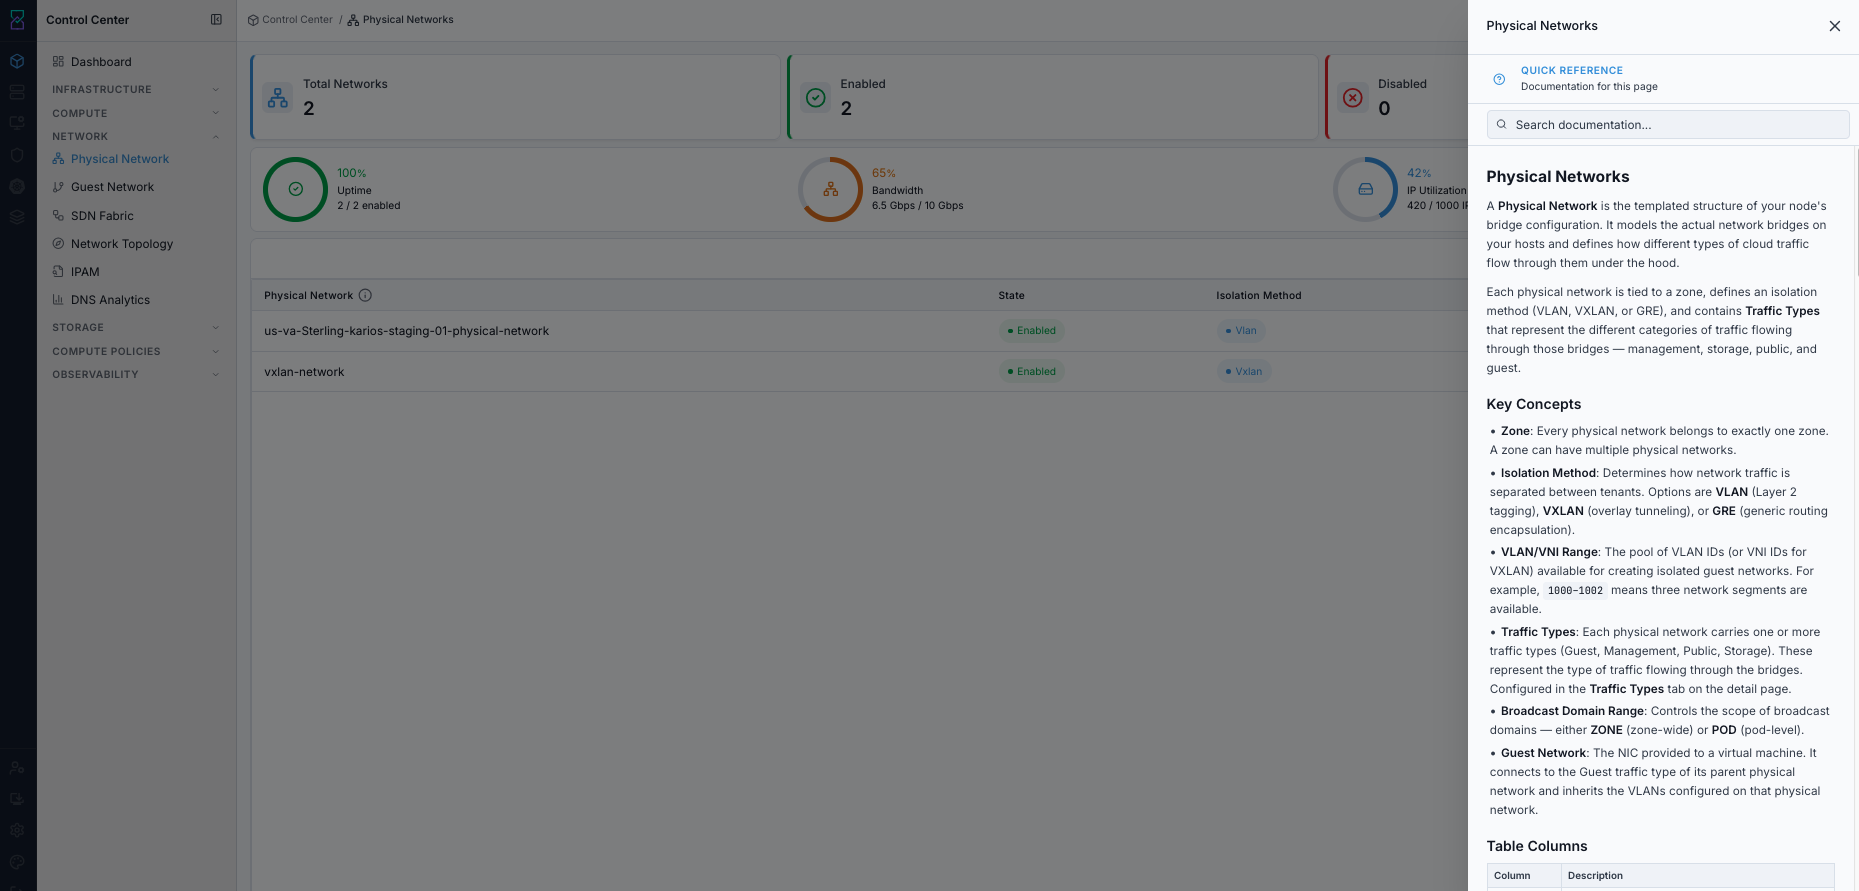
Expected Outcome:
Physical Network page guidance opens in the side help panel.
You can continue dashboard actions with field-level context.
If this fails:
Refresh the page and click the help icon again.
Confirm your account can access in-product help content.
Retry after reopening
Physical Network.
2.3. Create Physical Network
Create form screenshot:
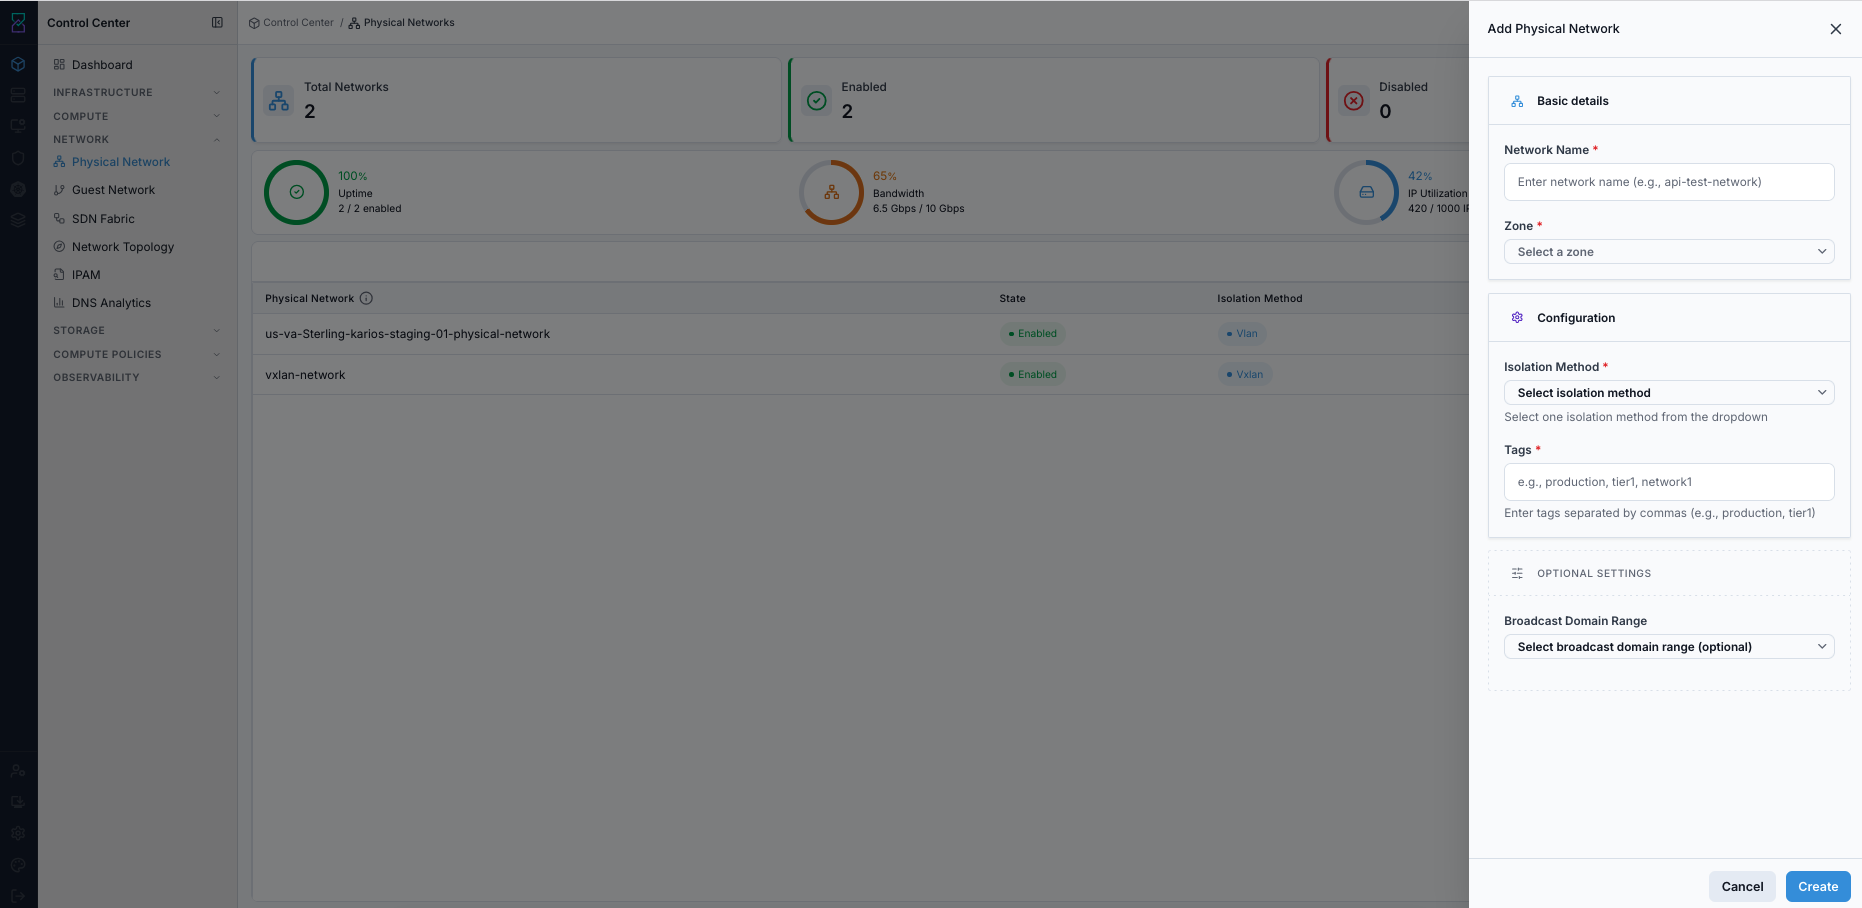
When to Use:
Use this to create a new physical-network container for tenant traffic and traffic-type configuration.
Purpose:
Create a zone-scoped physical network with valid isolation and VLAN/VNI ranges for downstream guest-network allocation.
Steps:
Open
Control Center -> Network -> Physical Network.Click
+ Add Physical Network.Fill required fields:
Network NameZoneVLAN/VNI Ranges(Start/End; use+ Add Rangefor multiple ranges)Isolation Method(VLAN/VXLAN/GRE)Tags
Optional fields:
Broadcast Domain RangeDomain IDNetwork Speed
Click
Create.
Required field notes:
Network Name: use a clear, unique naming pattern.Zone: network can be used only within the selected zone.VLAN/VNI Ranges: avoid overlaps with existing ranges in the same zone.Isolation Method: choose the method used in your network design.
Expected Outcome:
New physical-network row appears in the table with selected isolation/range settings.
If this fails:
Reopen
Add Physical Networkand re-validate required form inputs.Confirm required fields are populated and VLAN/VNI ranges do not overlap existing ranges.
Confirm your account can create physical networks in the selected zone.
Warning
Plan VLAN/VNI ranges before creation. Overlapping ranges in the same zone can cause conflicts.
Note
A new physical network is not useful until at least one traffic type is configured.
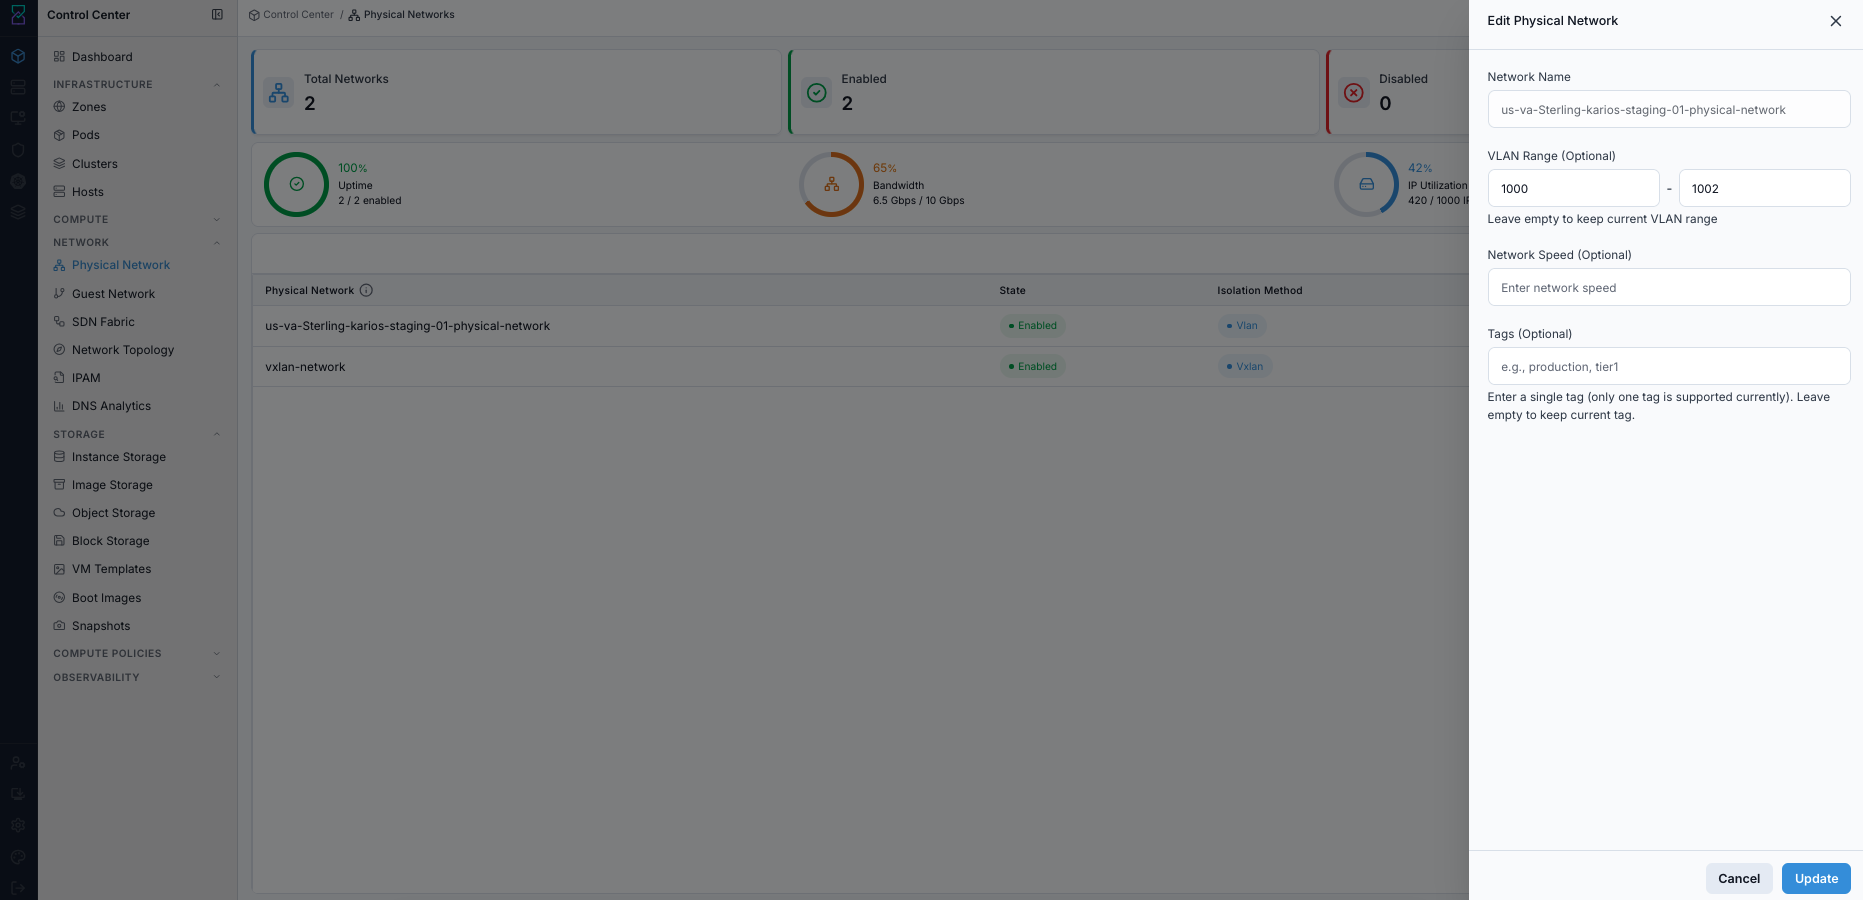
2.4. Edit and State Actions
When to Use:
Use this to adjust editable network attributes or control whether new allocations are allowed.
Purpose:
Apply safe operational changes without recreating the physical network.
Actions-column icon reference:
Steps:
Open
Control Center -> Network -> Physical Network.In the target row, use the icons in the
Actionscolumn.For
Edit, update allowed fields:VLAN/VNIrange valuesNetwork SpeedTags
Confirm non-editable fields remain unchanged:
Network NameZoneIsolation Method
For state control, use the power-state action icon:
Disableblocks new allocations (existing resources continue running)Enableallows new allocations again
Expected Outcome:
Requested edits are saved.
Network state updates as expected for new-allocation control.
If this fails:
Verify that only editable fields are being modified.
Confirm your role has permission for edit/state actions.
Retry after refreshing the table and re-opening row actions.
Warning
Updating VLAN/VNI ranges affects only new guest-network allocations.
2.5. Physical Network Details
When to Use:
Use this to inspect one physical network before traffic-type configuration or edits.
Purpose:
Validate core network properties on the details page and move to
Traffic Typesfor traffic actions.
Steps:
Open
Control Center -> Network -> Physical Network.Click the target physical network name in the table.
On the details page, review
Detailstab fields and openTraffic Typestab for traffic operations.
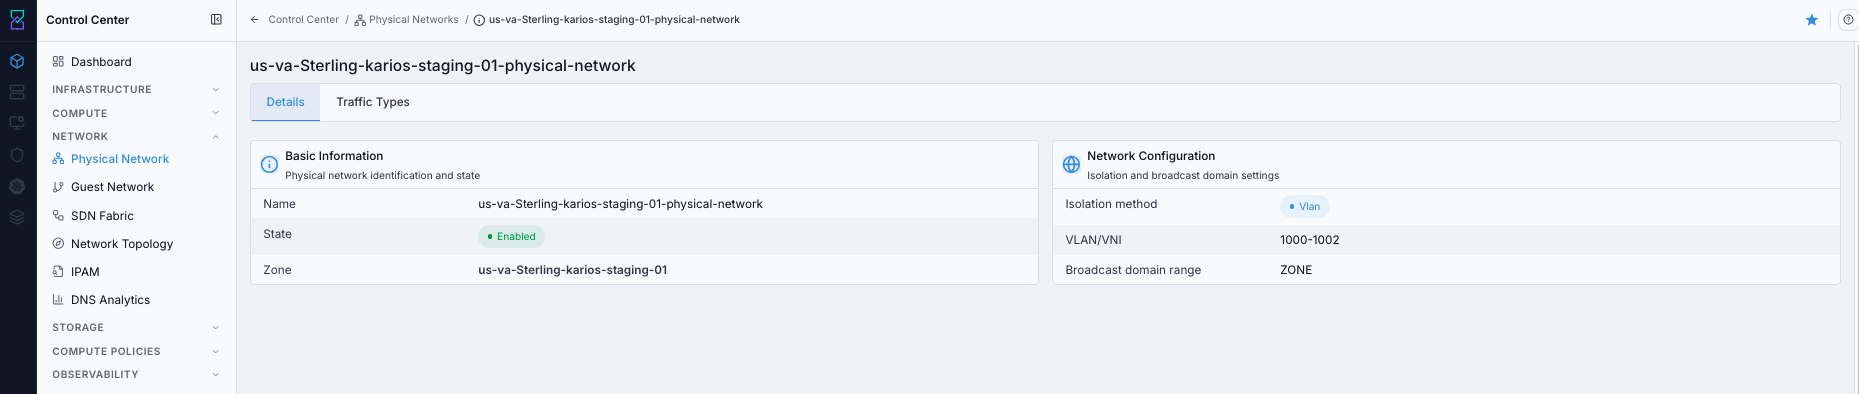
Details tab:
Basic Information:
Name,State,Zone.Network Configuration:
Isolation Method,VLAN/VNI,Broadcast Domain Range.
Traffic Types tab:
Configure which traffic categories this physical network carries.
Available categories:
Guest,Management,Public,Storage.Traffic-type actions are performed from this
Traffic Typestab.Available actions vary by traffic type and your role permissions.
Expected Outcome:
The selected physical-network details page opens.
You can verify
Name,State,Zone,Isolation Method, andVLAN/VNIvalues.You can continue to
Traffic Typesfor traffic-type-specific actions.
If this fails:
Return to
Physical Networkdashboard and verify the correct row was selected.Refresh the page and retry opening the same network.
Verify your account has access to Network details pages.
2.6. Traffic Types
Traffic-type operations are documented in the specific sections below:
Guest Traffic
Purpose:
Manage the guest networks attached to a physical network.
Guest traffic represents whole VM networks carried by the parent physical network. Each guest network becomes a VM NIC network and consumes VLAN/VNI capacity from the parent physical-network range.
How Guest Networks Work:
A physical network defines a VLAN/VNI pool (for example
1000-1002).Creating a guest network consumes one VLAN/VNI from that pool.
VMs attached to that guest network receive NICs and IPs from the guest-network subnet.
Network type (
IsolatedorShared) determines routing model and access behavior.
Tip
Monitor VLAN/VNI usage in this table. If the range is exhausted, no new guest networks can be created until you expand the range or add a new physical network.
Guest Network Types:
Isolated:Private network model scoped to a tenant/account.
Uses virtual-router services from the selected offering (NAT, firewall, VPN, load balancing).
Source NAT egress is provided by isolated-network services.
Inbound access is controlled through NAT/firewall rules.
Shared:Flat subnet model that can be used across accounts.
No virtual-router NAT/firewall path for the guest network.
VMs receive IPs directly from the configured shared-network range.
Guest Networks Table Columns:
Column |
Description |
|---|---|
Name |
Guest network name. Click to open guest-network details. |
Type |
|
VLAN/VNI |
Assigned VLAN/VNI ID or |
Broadcast URI |
Broadcast-domain identifier (for example |
CIDR |
IPv4 subnet for the guest network. |
IPv6 CIDR |
IPv6 subnet when configured, otherwise |
Step: Open Guest Traffic Details Page
When to Use: Use this when you need to review guest networks on a specific physical network.
Purpose: Guest networks consume VLAN/VNI IDs from the parent physical network, so this is the primary place to verify capacity and network inventory.
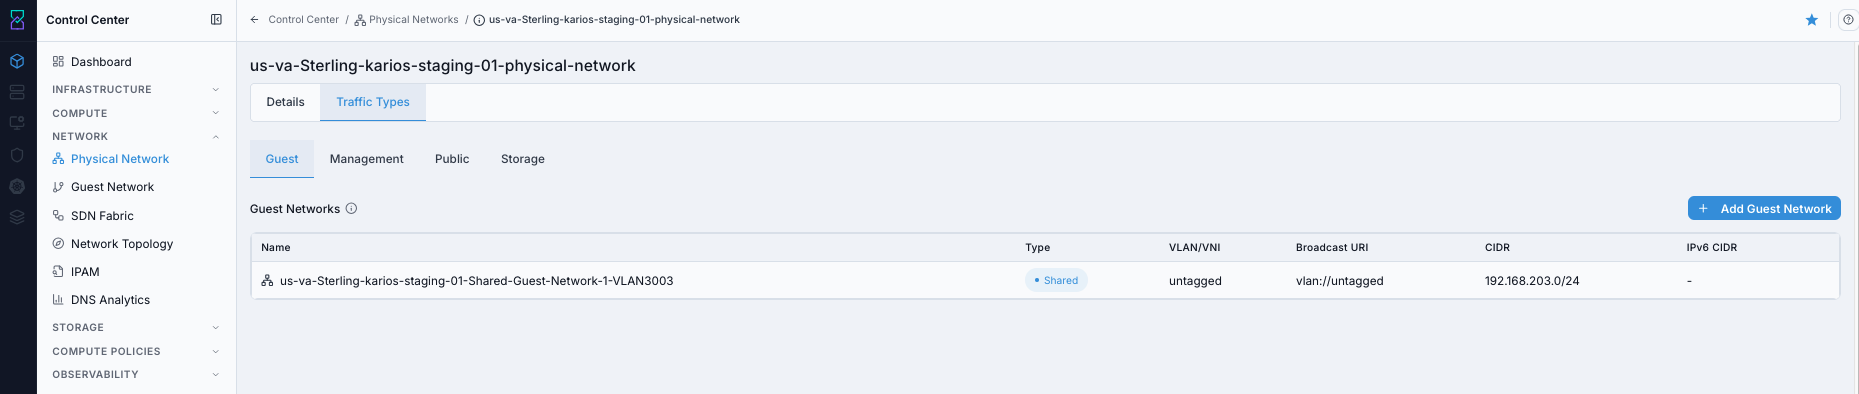
Details page shows:
Guest network rows with
Name,Type,VLAN/VNI,Broadcast URI, andCIDRcolumns.+ Add Guest Networkaction for new network creation.
What you can do from this screen:
Open guest-network details by clicking a network name.
Launch guest-network creation for isolated/shared workflows.
Validate current VLAN/VNI consumption in this physical network.
Steps:
Open
Control Center -> Network -> Physical Network.Click the target physical network name.
Click
Traffic Types.Click
Guest.
Expected Outcome:
You can review all guest networks on the selected physical network.
You can create guest networks and open each network’s detail page.
Continue with Page Help Review:
Click the top-right help icon.
Use the
iicon nearGuest Networksfor quick column definitions.For help-panel behavior, follow the same flow used in
2.2.1 Open Physical Network Help Panel.
If this fails:
1. Confirm you opened the intended physical network row.
2. Refresh and reopen Traffic Types -> Guest.
3. Verify your account can access networking pages.
Step: Add Isolated Guest Network (from Physical Network)
When to Use: Use this when you need a tenant-private network with isolated-network services.
Purpose: Isolated networks provide private VM networking with network services based on the selected offering.
Step 1: choose Network Type as Isolated.
Steps:
From
Traffic Types -> Guest, click+ Add Guest Network.Keep
Network Typeset toIsolated.Choose
VLANorVXLANbased on the physical network design.Complete the required network details.
Click
Create Network.
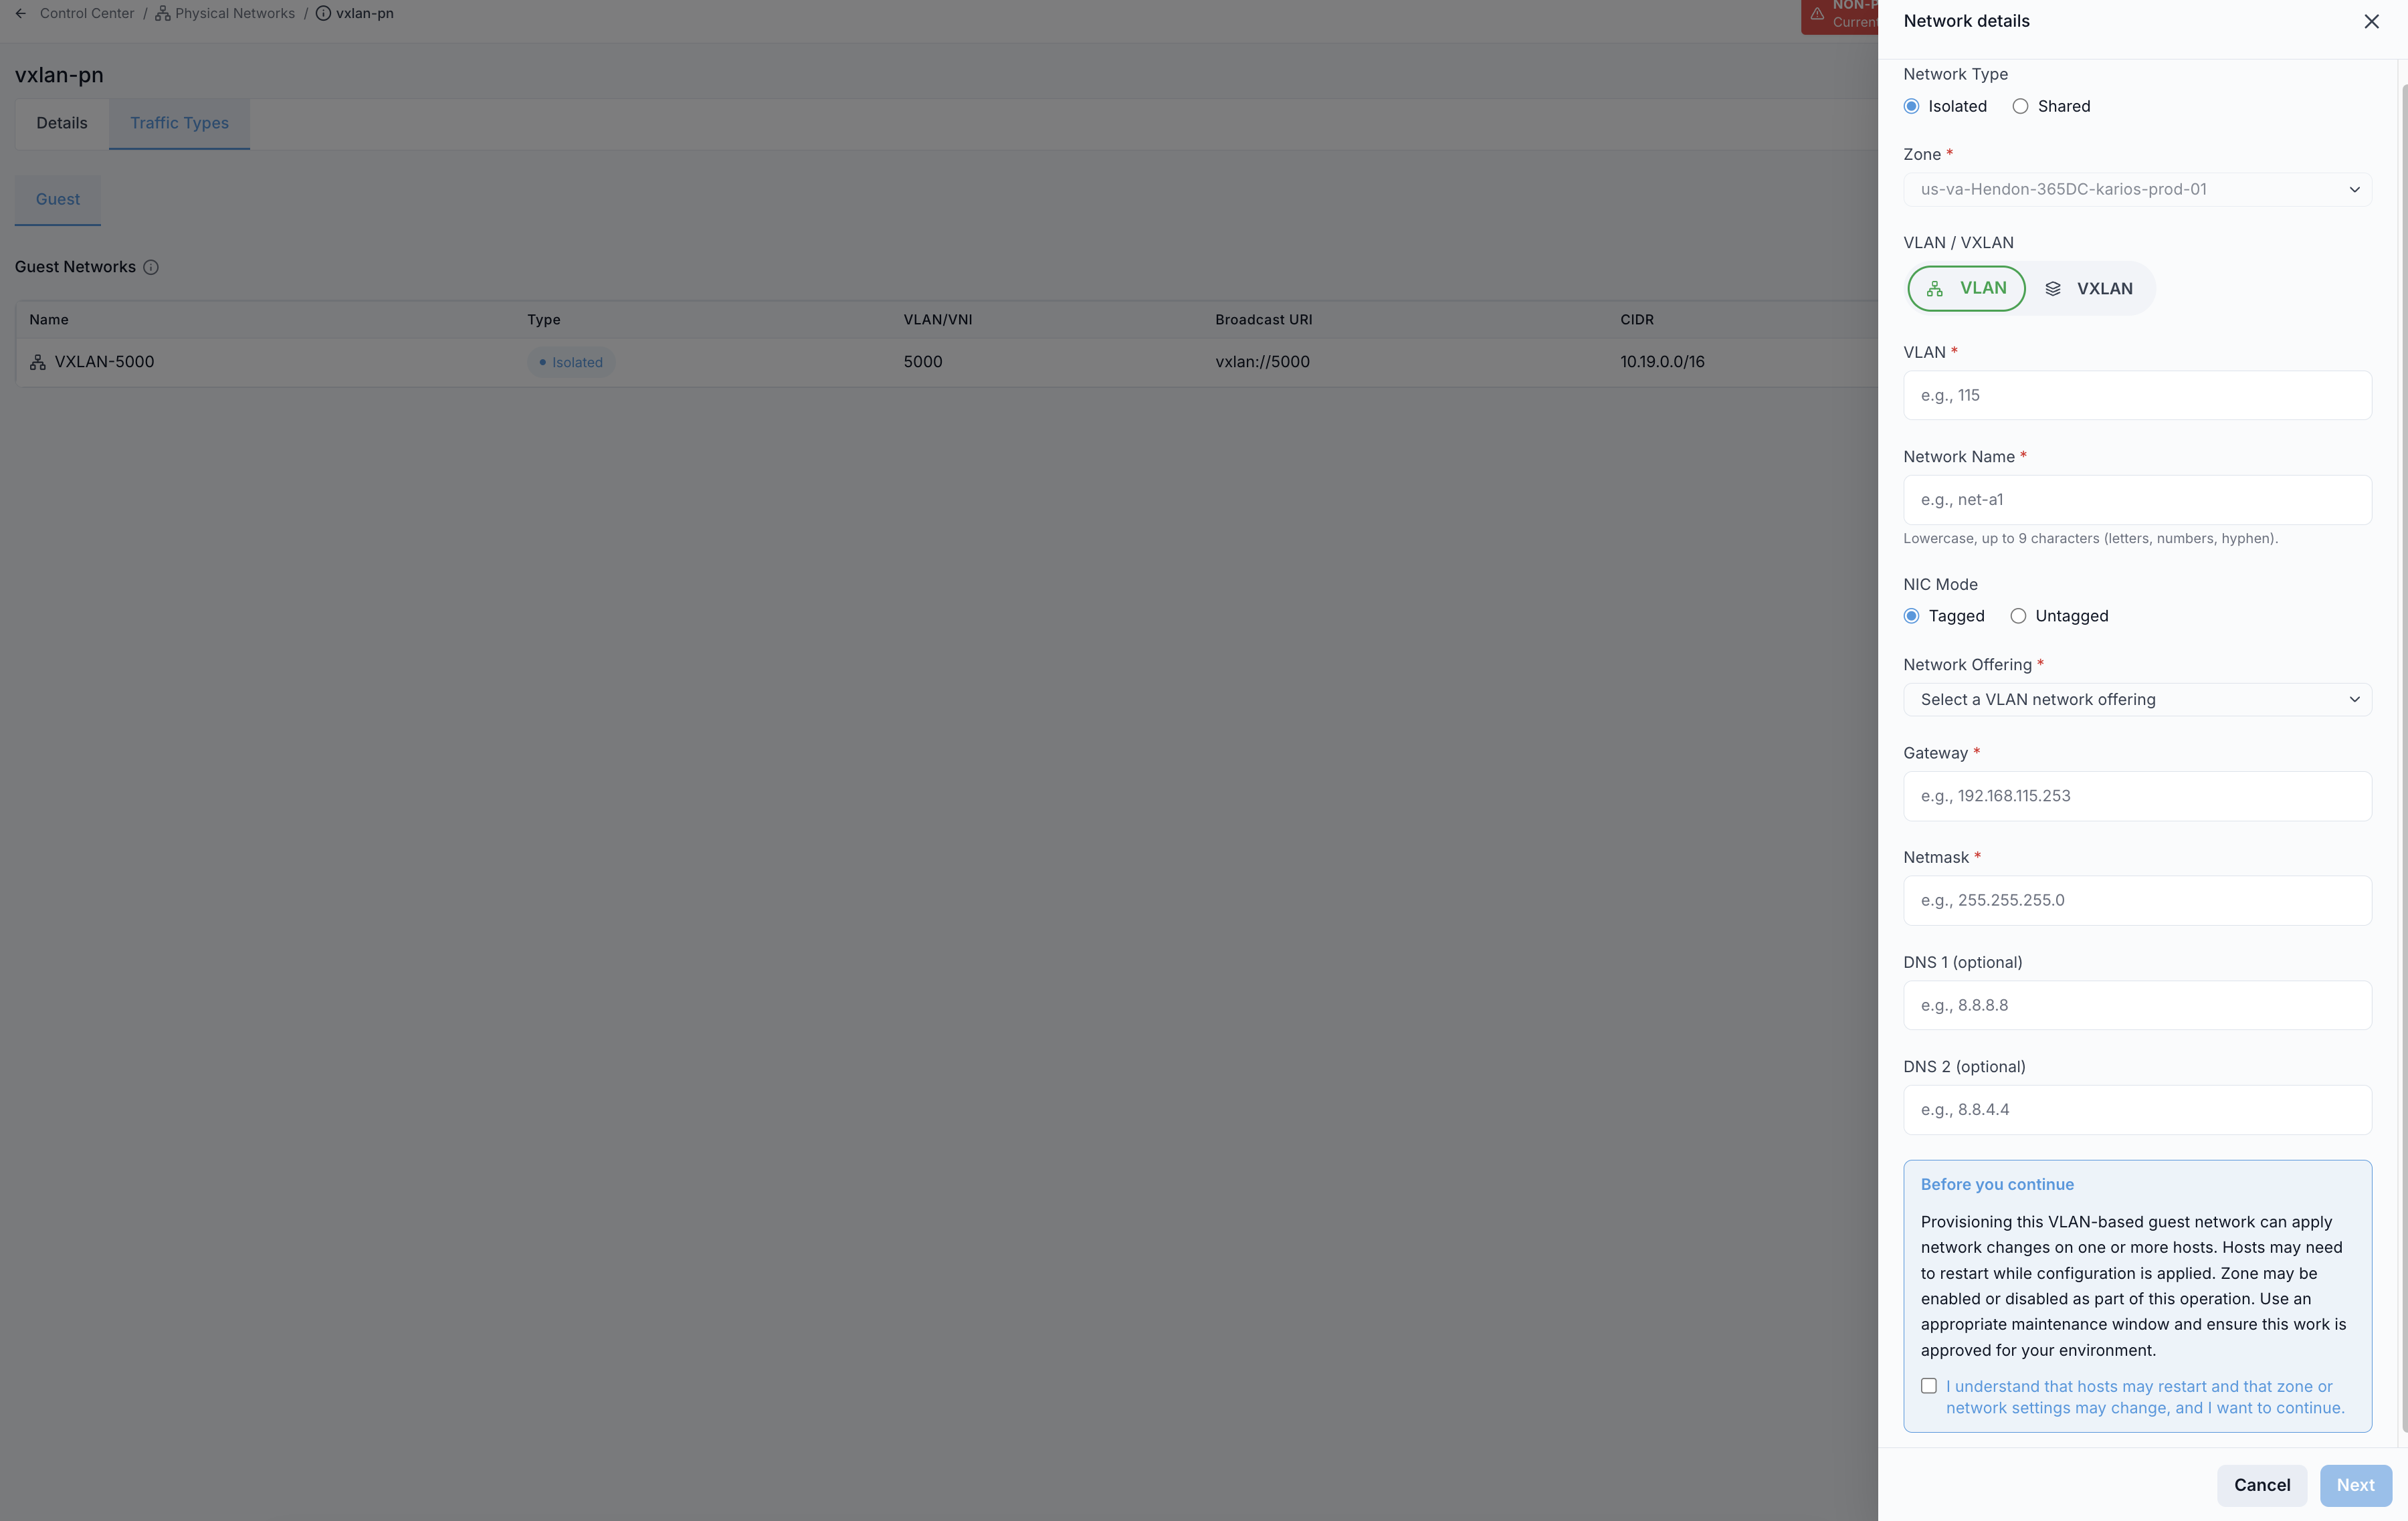
Isolated-network fields:
Zone(required)VLANorVXLAN (VNI)(required, depending on selected mode)Network Name(required)Network Offering(required; must support isolated-network capabilities)GatewayandNetmask(required)DNS 1andDNS 2(optional)NIC Mode:TaggedorUntaggedwhen VLAN mode is selected
Use the canonical field-level steps in Create Guest Network (Section 3.5).
VXLAN option in this flow:
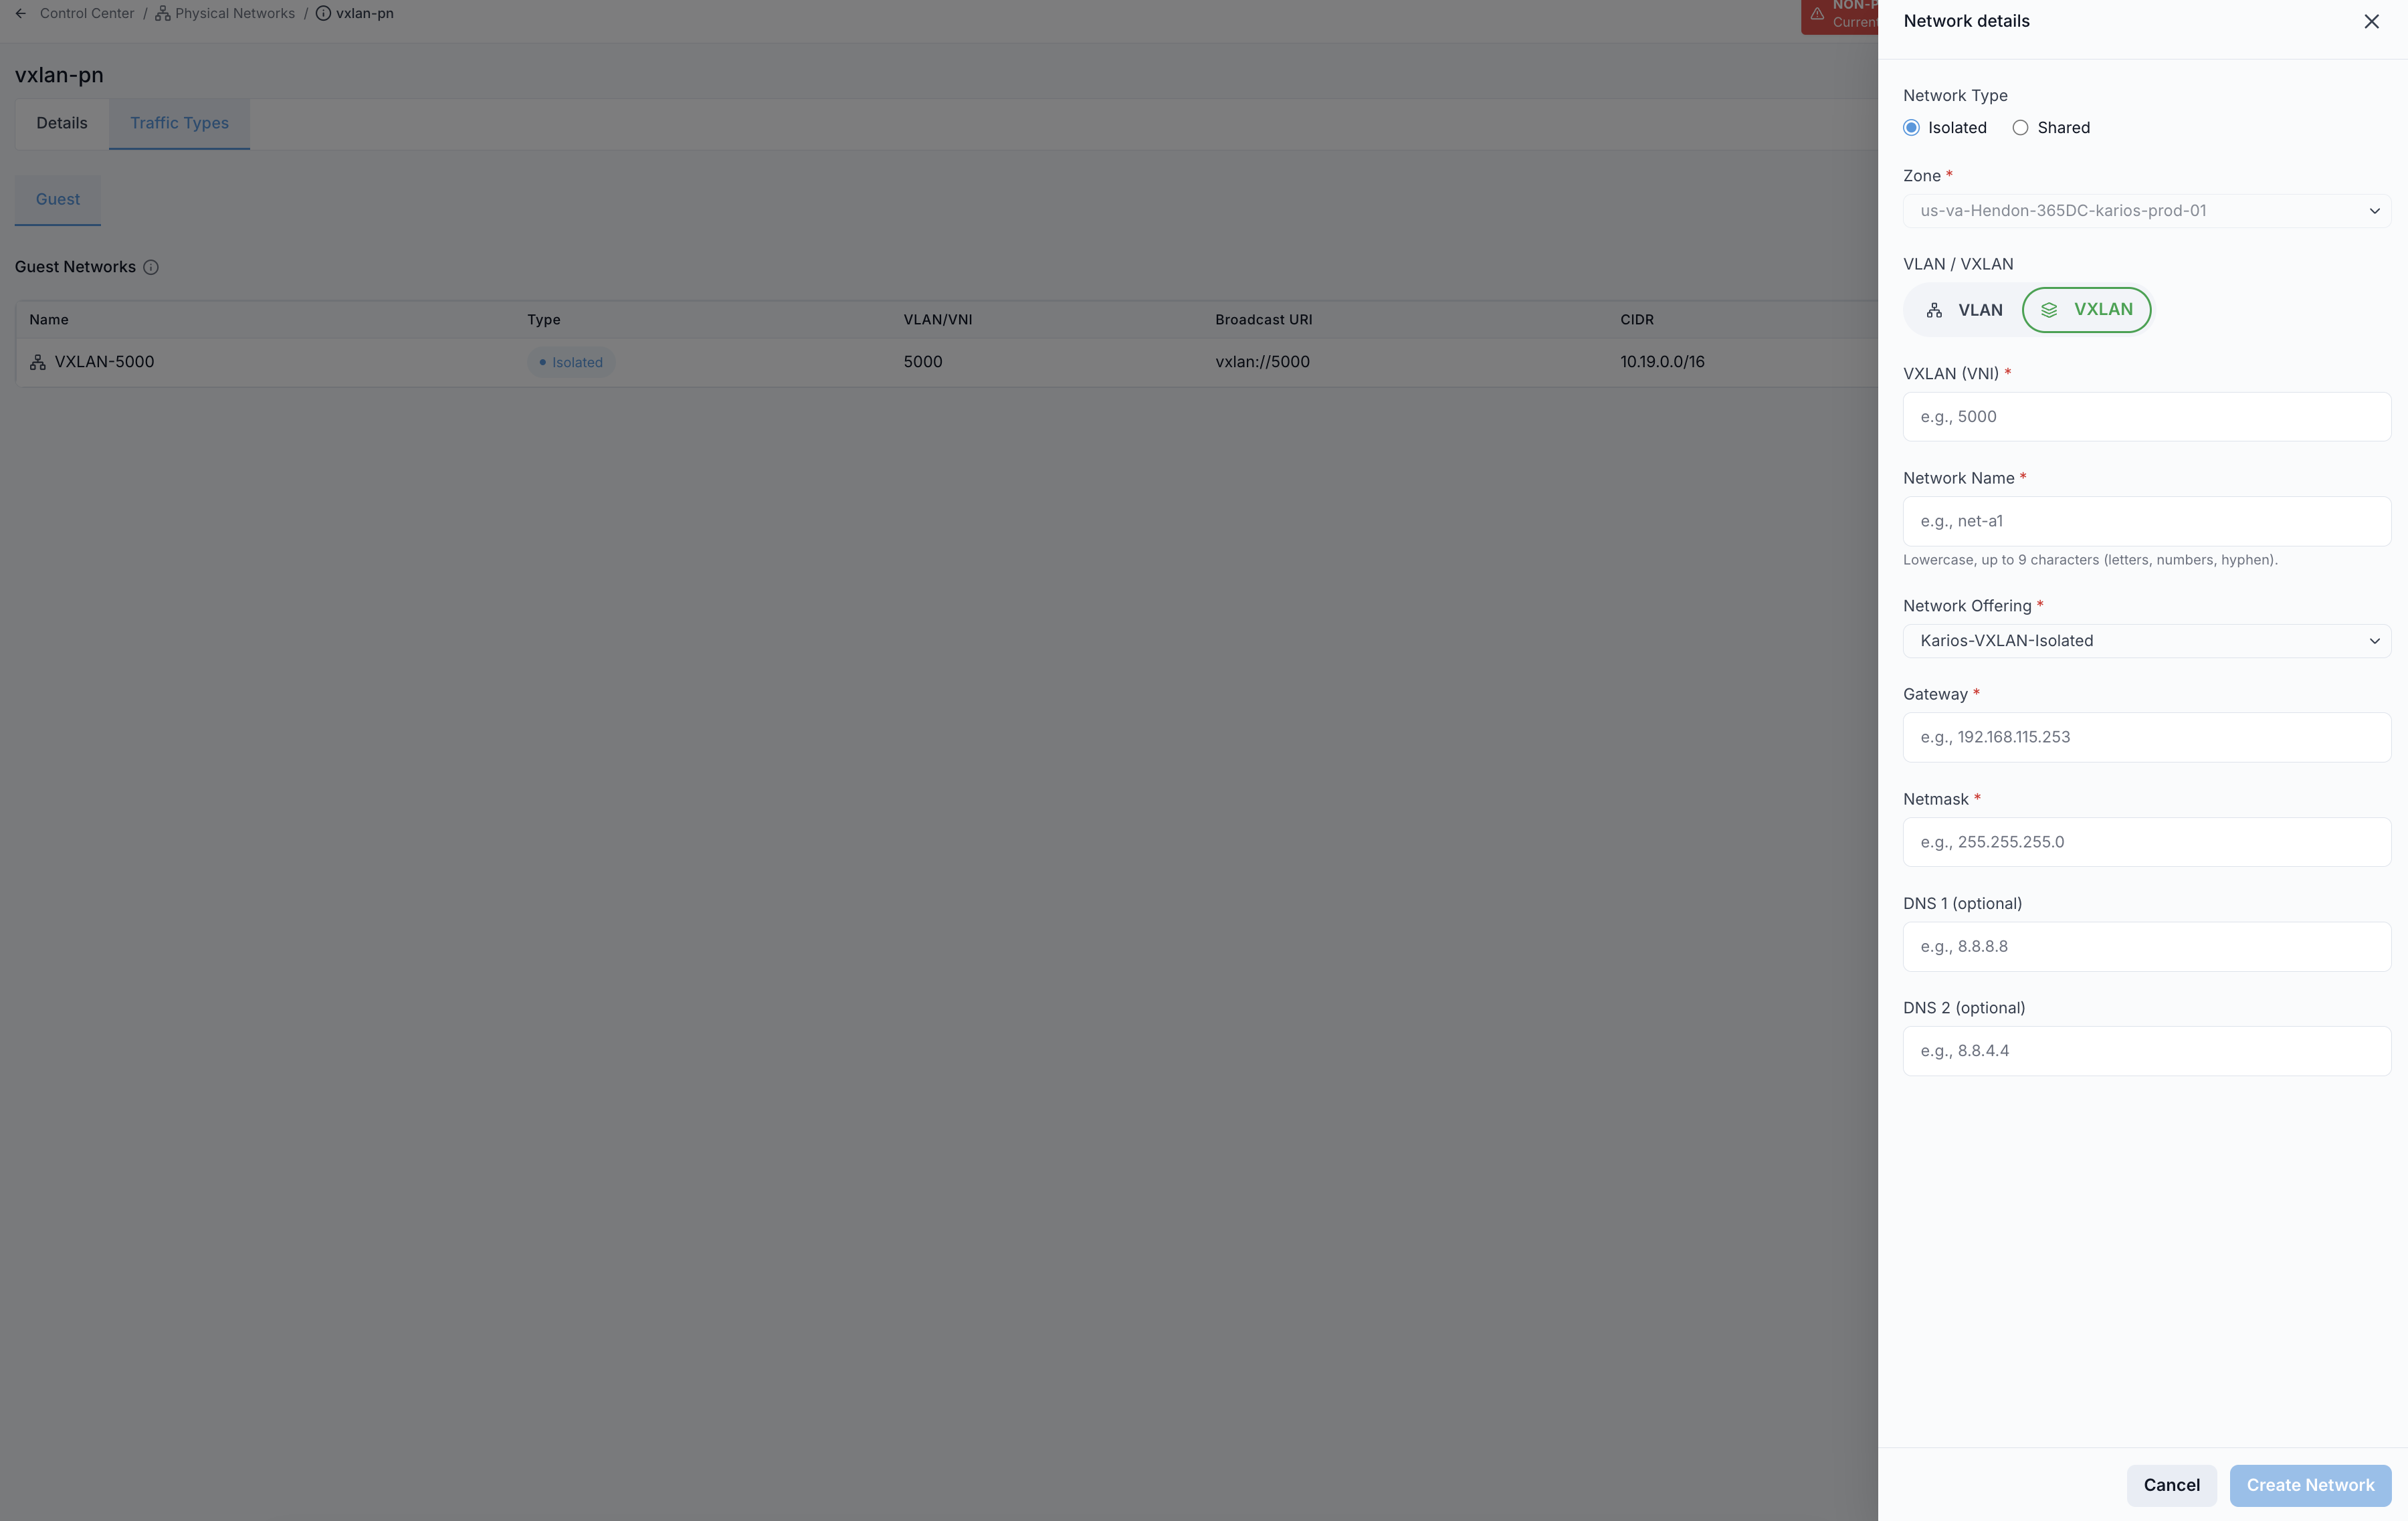
VXLAN-specific fields:
VXLAN (VNI)(required)Network Offeringset to a VXLAN-capable isolated offeringGatewayandNetmask(required)DNS 1andDNS 2(optional)
Expected Outcome:
New network appears in guest network lists.
Initial state can remain
Allocateduntil first VM triggers isolated-network initialization.
Tip
Watch for state movement Allocated -> Implementing -> Setup after first isolated-network VM provisioning.
Warning
Allocated is normal for newly created isolated networks. Do not recreate the network because it is not yet Setup.
If this fails:
Follow Section
3.5failure checks first (required fields, offering compatibility, name uniqueness).Reopen
Traffic Types -> Guestdetails page and confirm whether the network row was created.
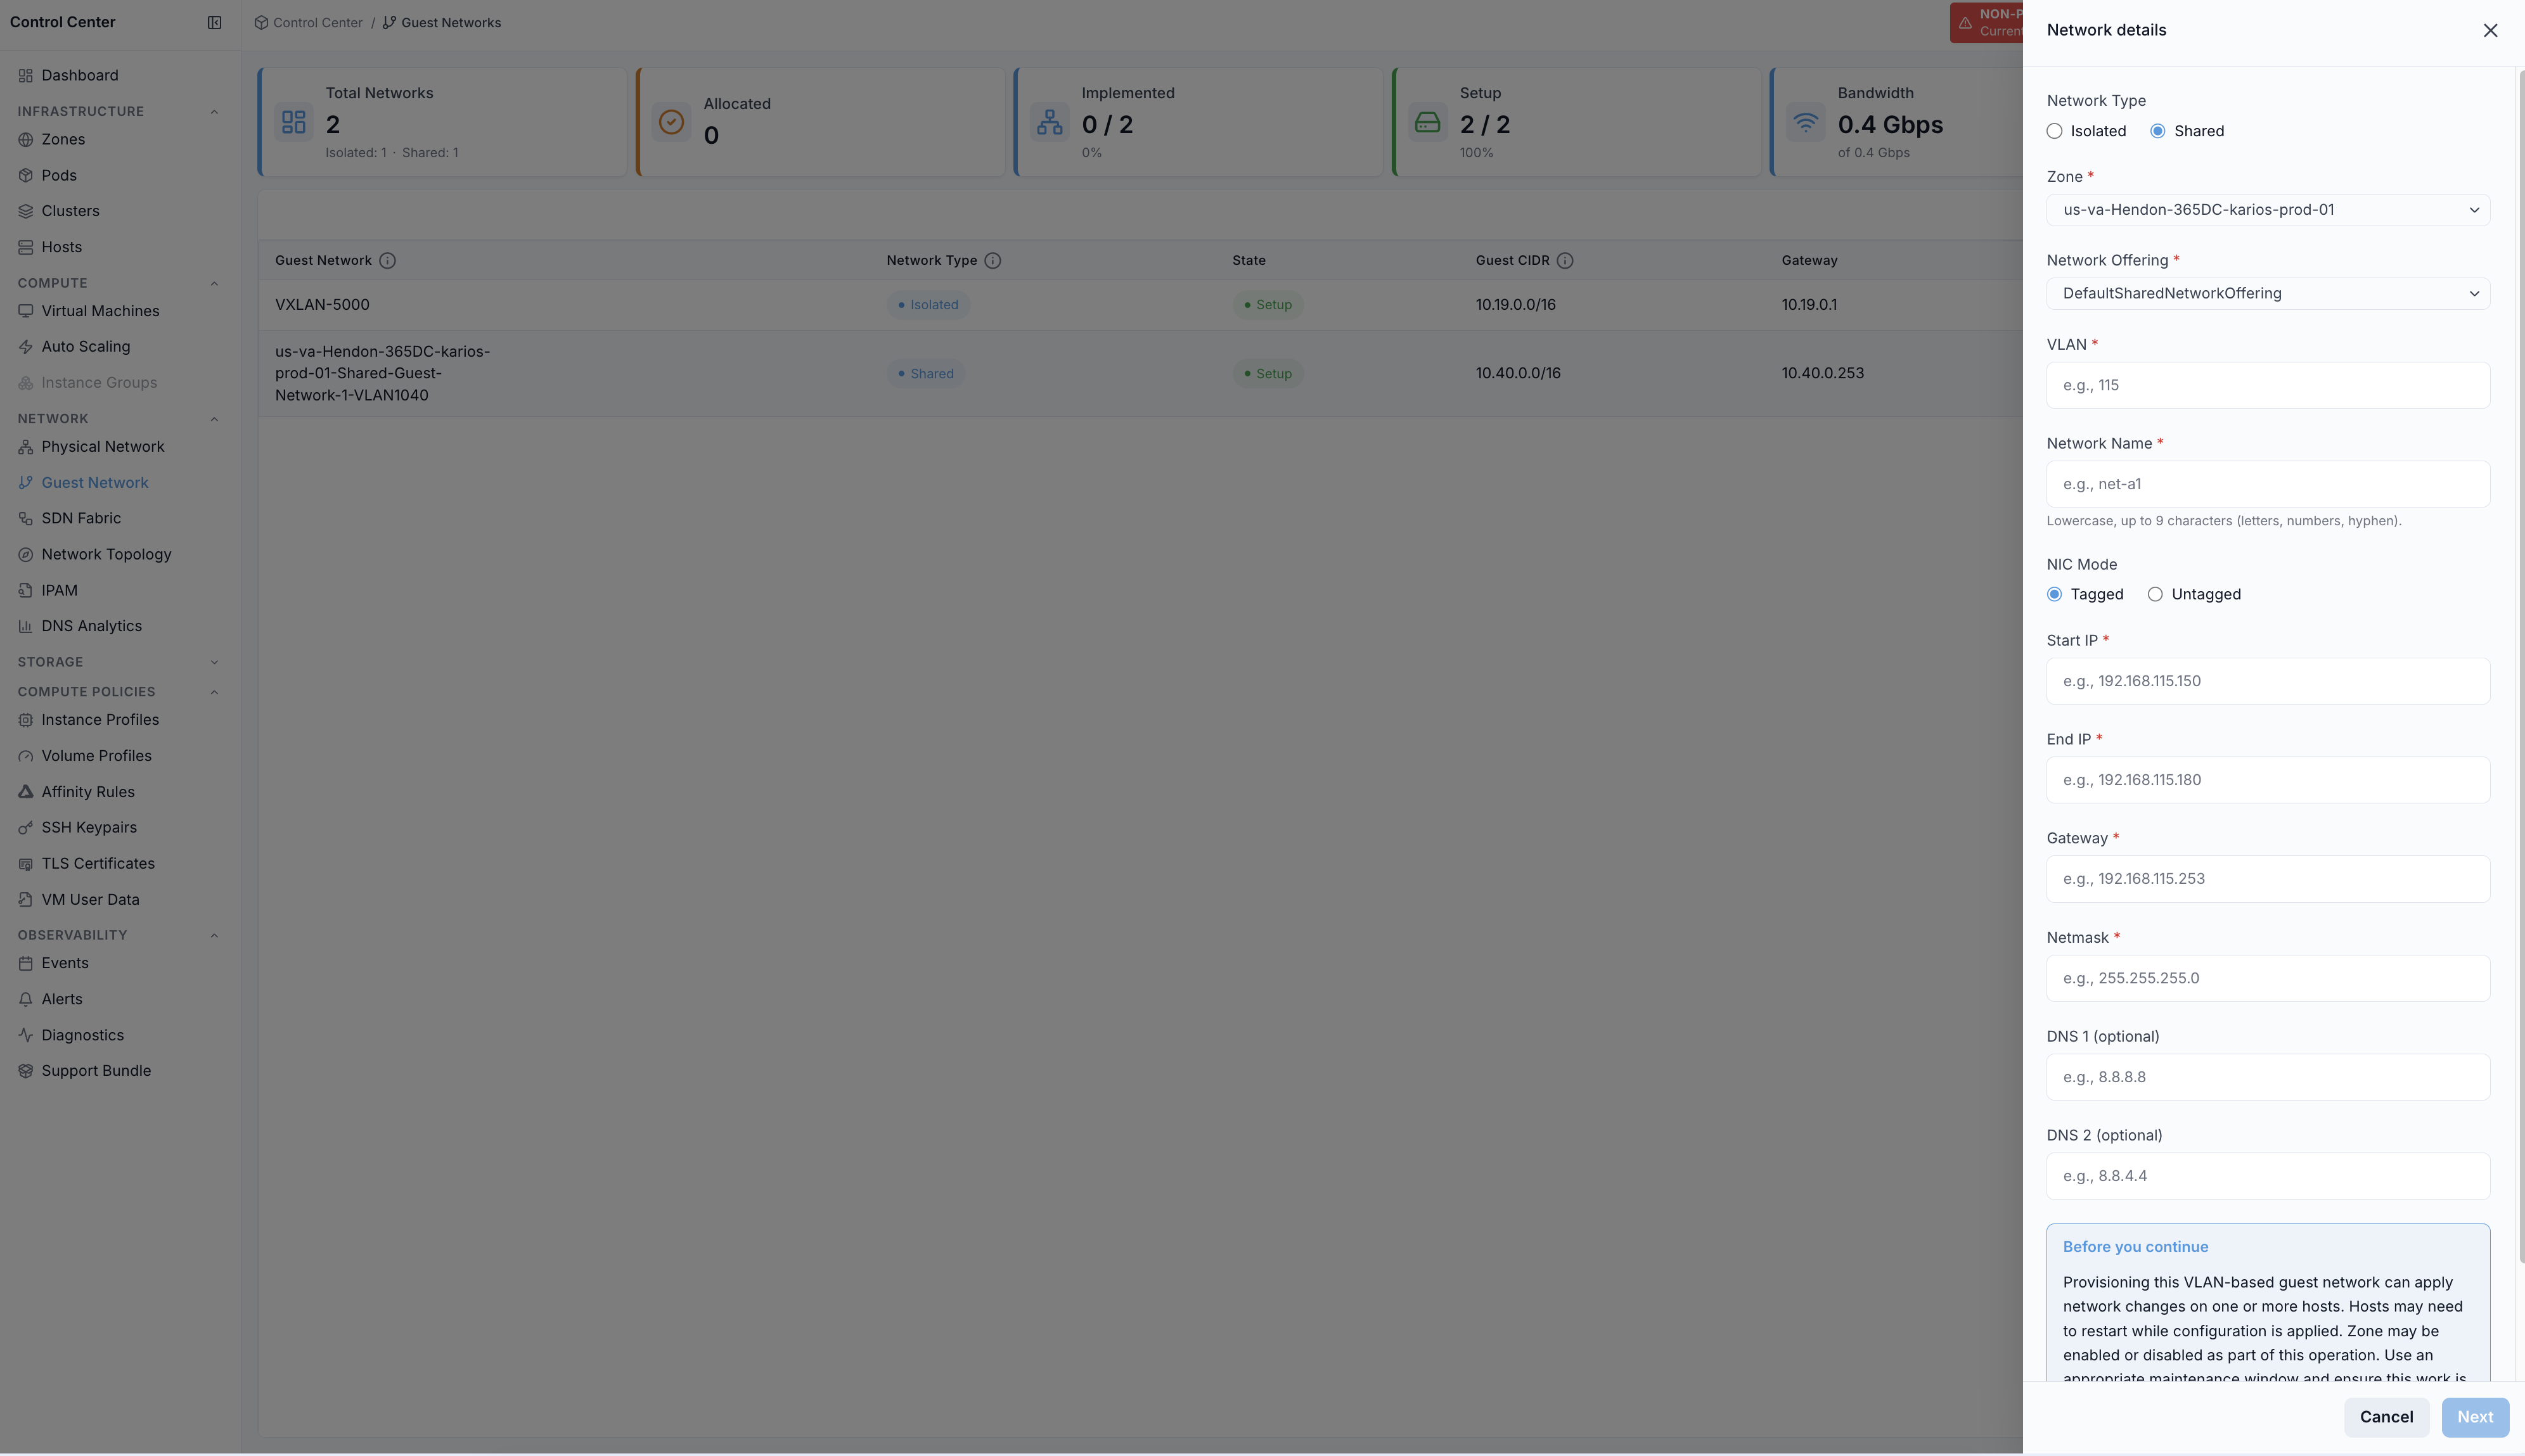
Step: Add Shared Guest Network (from Physical Network)
When to Use: Use this when VMs must use a common flat subnet without isolated-network NAT/firewall path.
Purpose: Shared-network IP, VLAN, and gateway values directly control the VM address pool and subnet behavior.
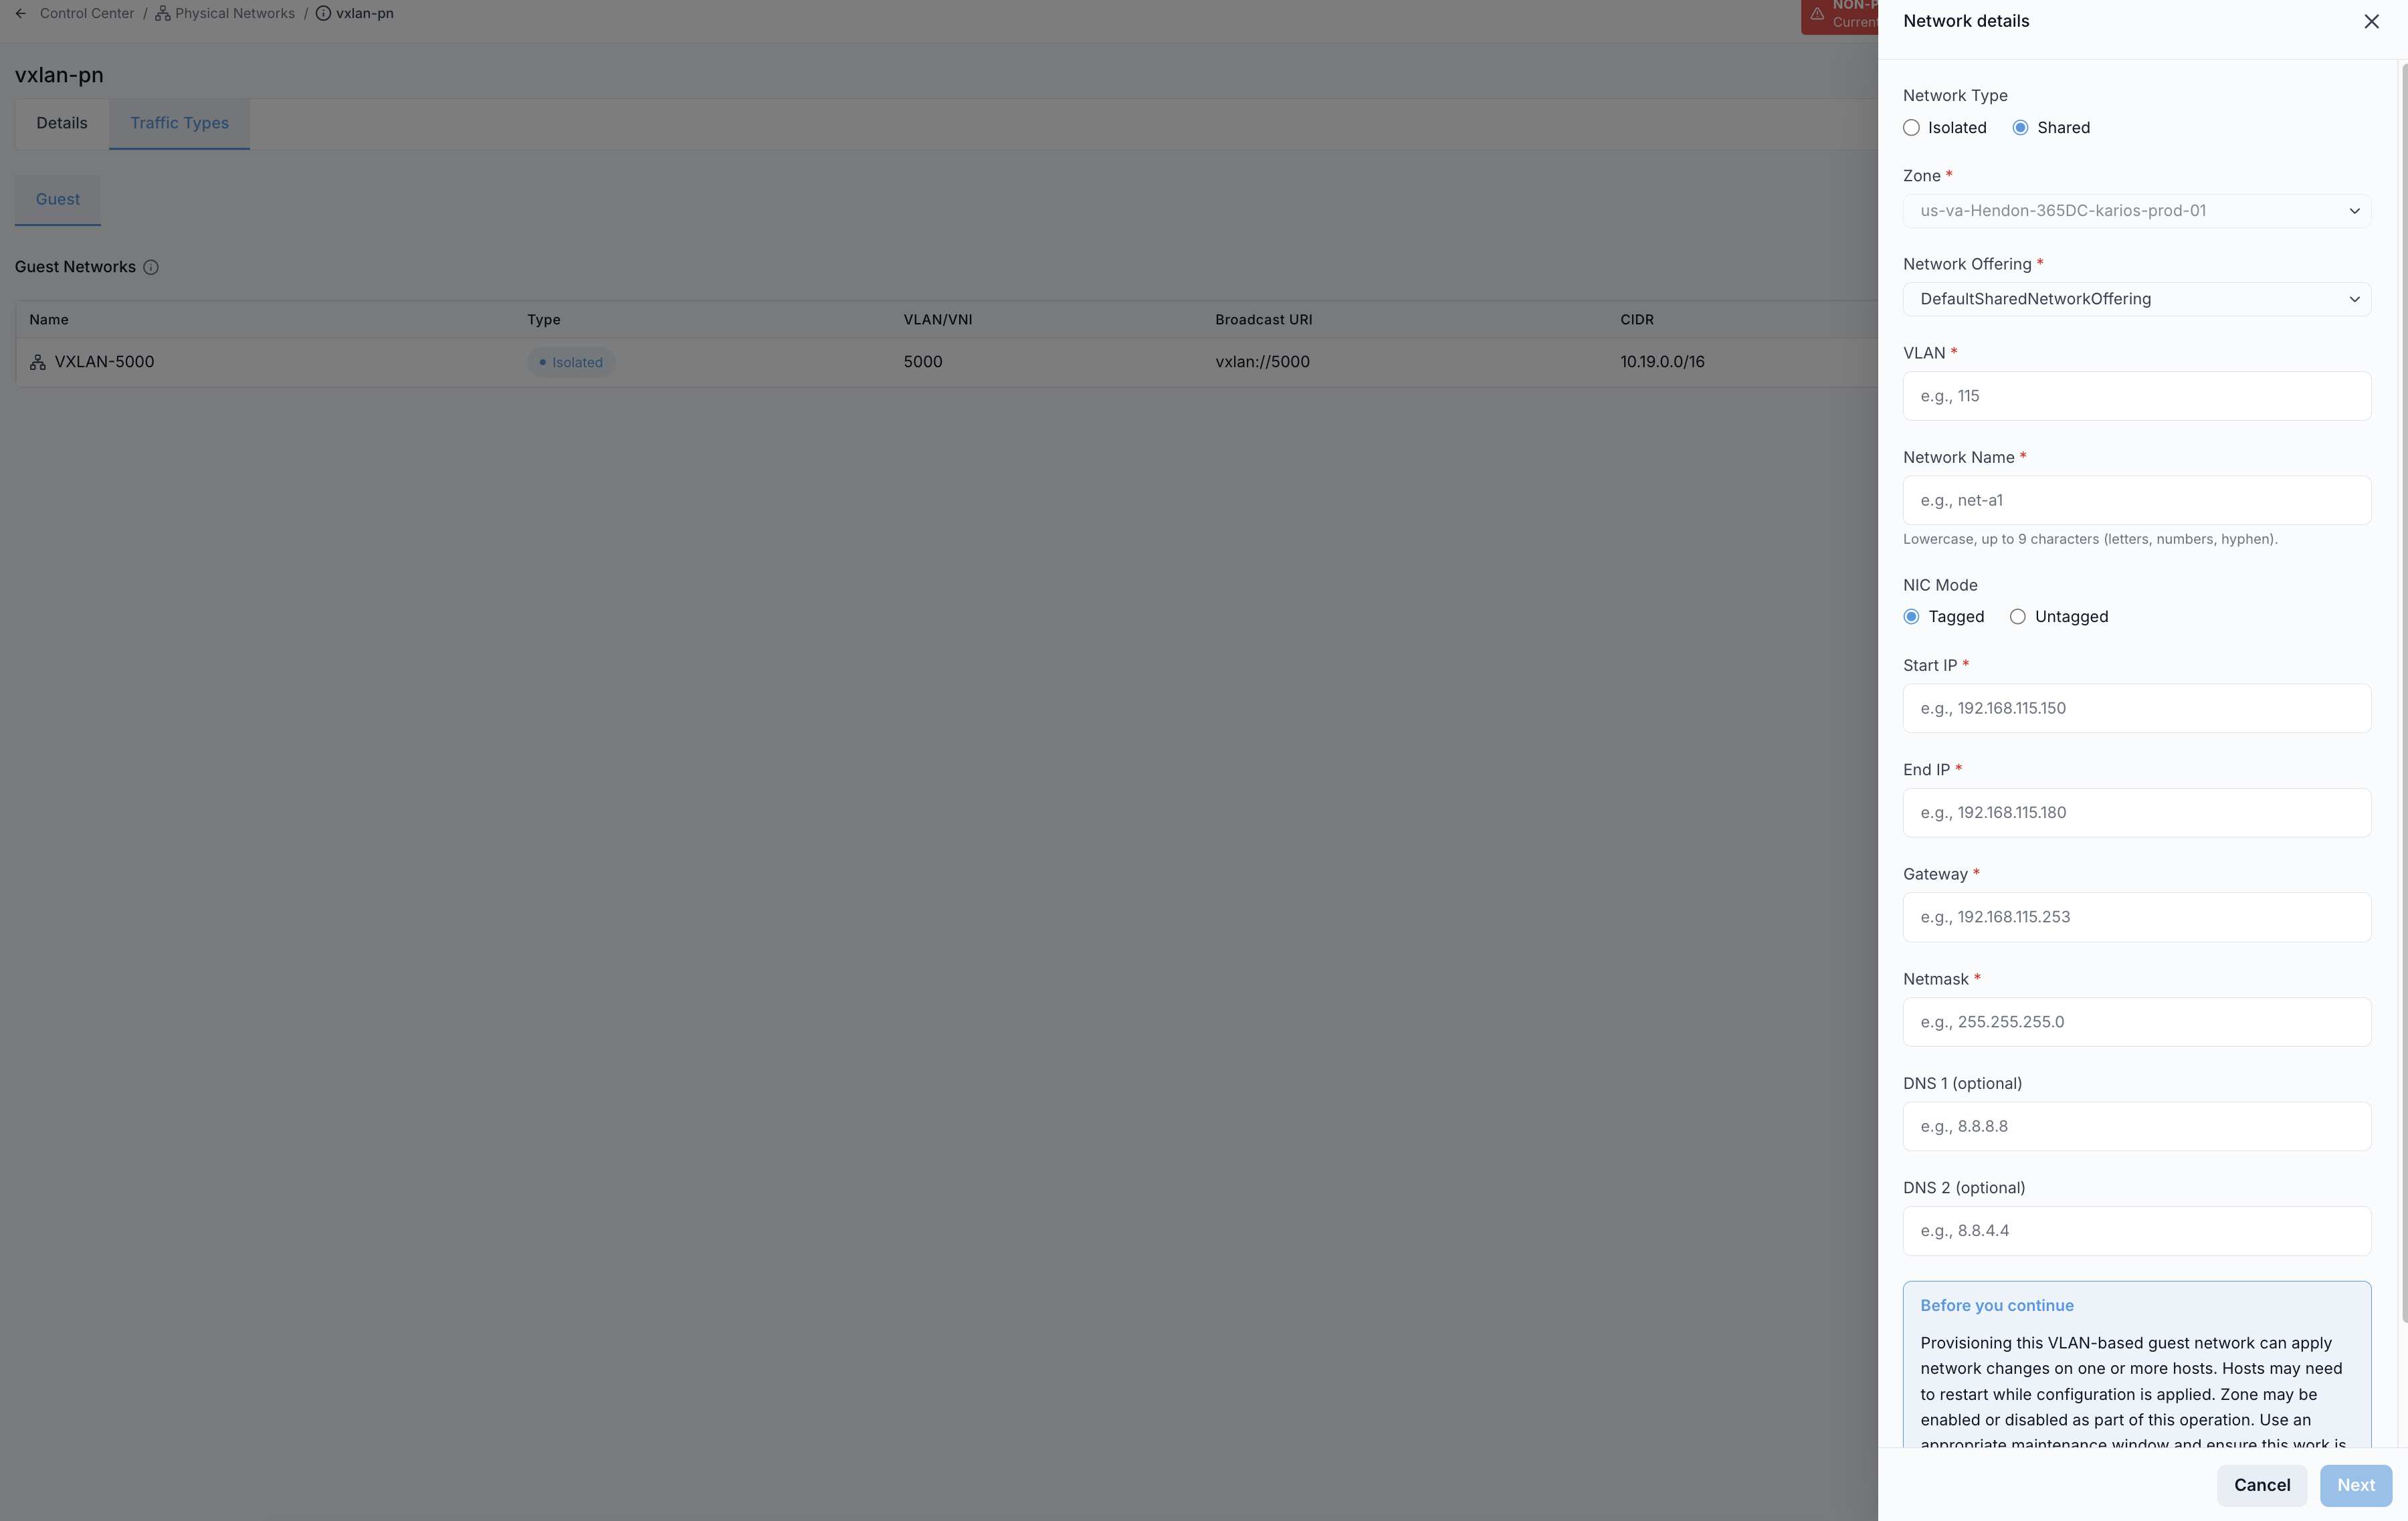
Step 1: choose Network Type as Shared.
Steps:
From
Traffic Types -> Guest, click+ Add Guest Network.Set
Network TypetoShared.Complete the required network details.
Click
Create Network.
Shared-network fields:
Zone(required)Network Offering(required; must support shared networks)VLAN(required; oruntaggedwhere applicable)Network Name(required)NIC Mode:TaggedorUntaggedStart IPandEnd IP(required)Gateway(required)Netmask(required)DNSvalues when required by the environment
Note
The shared-network IP range is the actual VM allocation pool. Size it for expected VM count.
Use the canonical field-level steps in Create Guest Network (Section 3.5).
Expected Outcome:
Network appears in
Setupafter successful creation.VMs can consume IPs from the configured range.
Warning
Keep the gateway outside the VM allocation pool to avoid IP conflicts.
Warning
For shared networks, ensure VLAN is within the parent physical-network VLAN range (or use untagged when supported).
If this fails:
Follow Section
3.5shared-network failure checks first (subnet math, overlap, VLAN validity).Confirm
Physical Network IDmatches the expected physical network.
Step: Open Guest Network Details
When to Use: Use this when you need full configuration for one guest network.
Purpose: The details page is the source for network configuration verification before attaching workloads.
Start from the Guest traffic details page shown in Task: Open Guest Traffic Details Page above.
Steps:
In
Traffic Types -> Guest, click a network name in theNamecolumn.Review full network configuration and attached workload context on the detail page.
Result page:
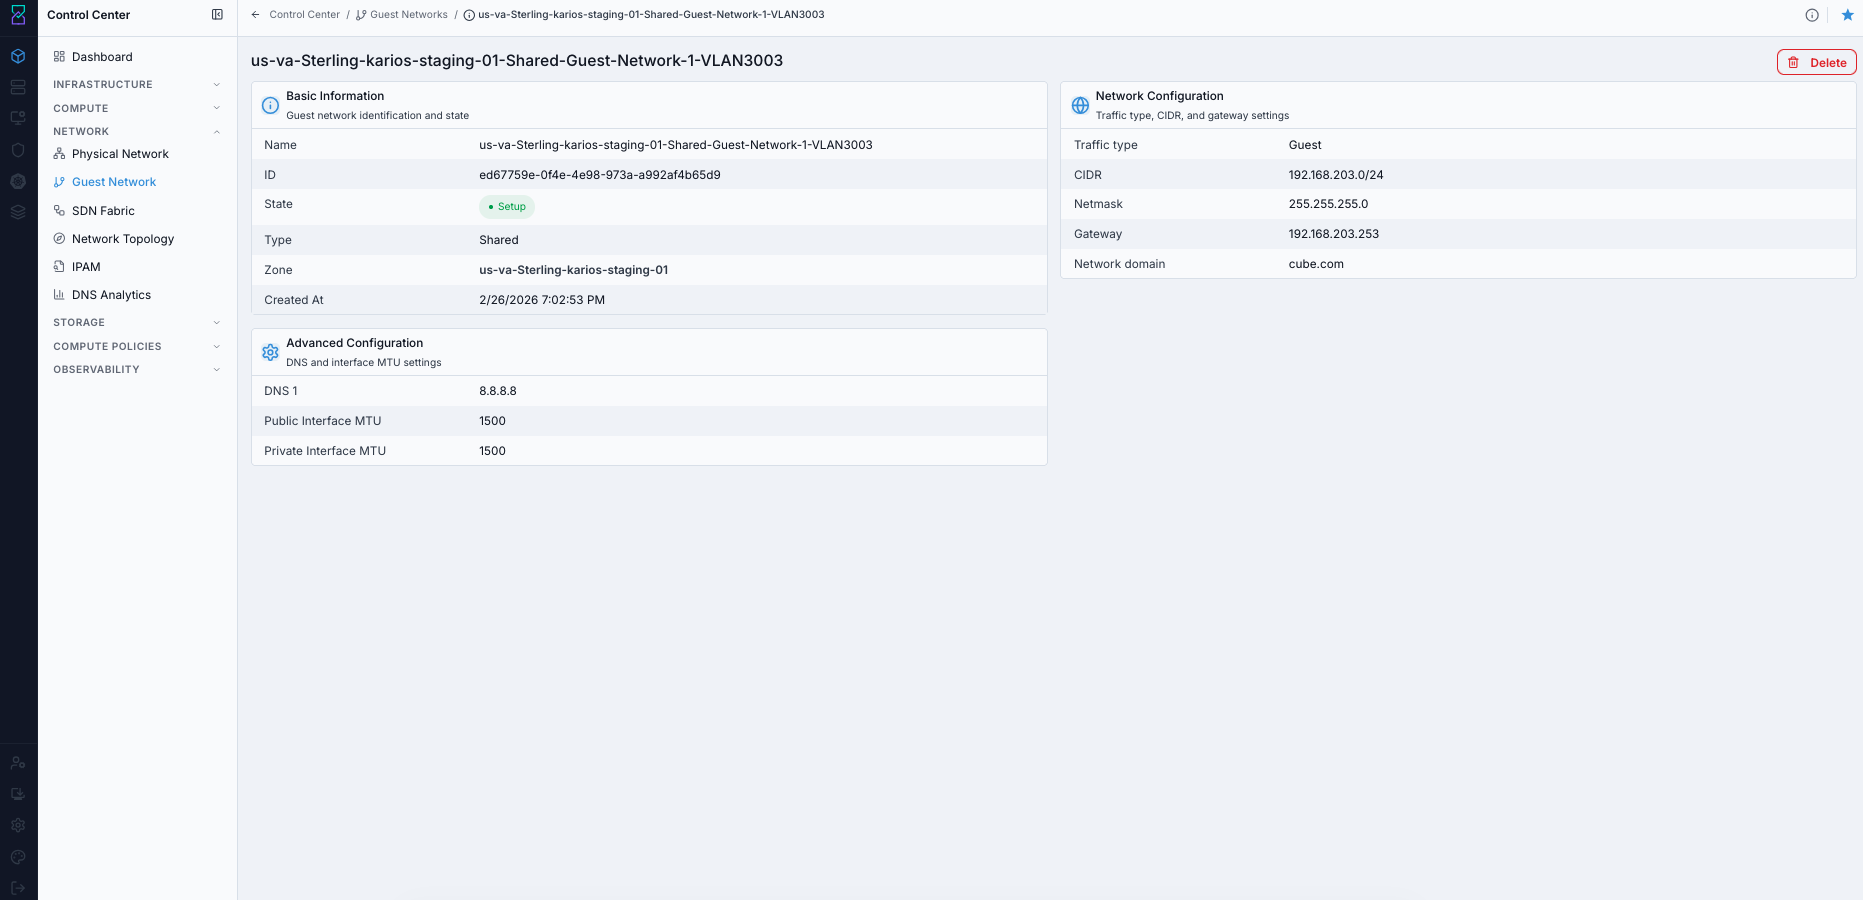
Expected Outcome:
The Guest Network details page opens.
You can review
Basic Information,Network Configuration, andAdvanced Configurationcards.
If this fails:
1. Verify the selected row exists in Traffic Types -> Guest.
2. Refresh and retry opening the same network row.
3. Confirm access rights for guest-network details.
Tips:
Use
Isolatedwhen tenant separation and NAT/firewall controls are required.Use
Sharedwhen workloads must be directly reachable on a common subnet.Network offering selection controls available services (DHCP, DNS, NAT, firewall, load balancing, VPN).
Management Traffic
Purpose:
Manage the internal control-plane network used by Karios infrastructure components.
Management traffic is the control plane for hosts, virtual routers, system VMs, and management services. Each management IP range is assigned per pod, and hosts consume IPs from the range of the pod they join.
Warning
Management IP exhaustion can block host onboarding and delay system-VM operations.
What Uses Management Traffic:
Hosts (KVM compute nodes)
Virtual Routers (network-service system VMs)
System VMs (for platform services)
Management Server control-plane communication
Management IP Ranges Table Columns:
Column |
Description |
|---|---|
Pod |
Pod this range belongs to. Pod name links to pod details. |
Zone |
Zone where the pod resides. |
Start IP |
First IP in the management range. |
End IP |
Last IP in the management range. |
VLAN |
VLAN tag or |
For System VMs |
Whether the range is reserved for system VMs only ( |
Step: Open Management Traffic Details Page
When to Use: Use this when reviewing control-plane IP ranges for a physical network.
Purpose: Management ranges determine addressing for hosts and system components in each pod.

Details layout reference:
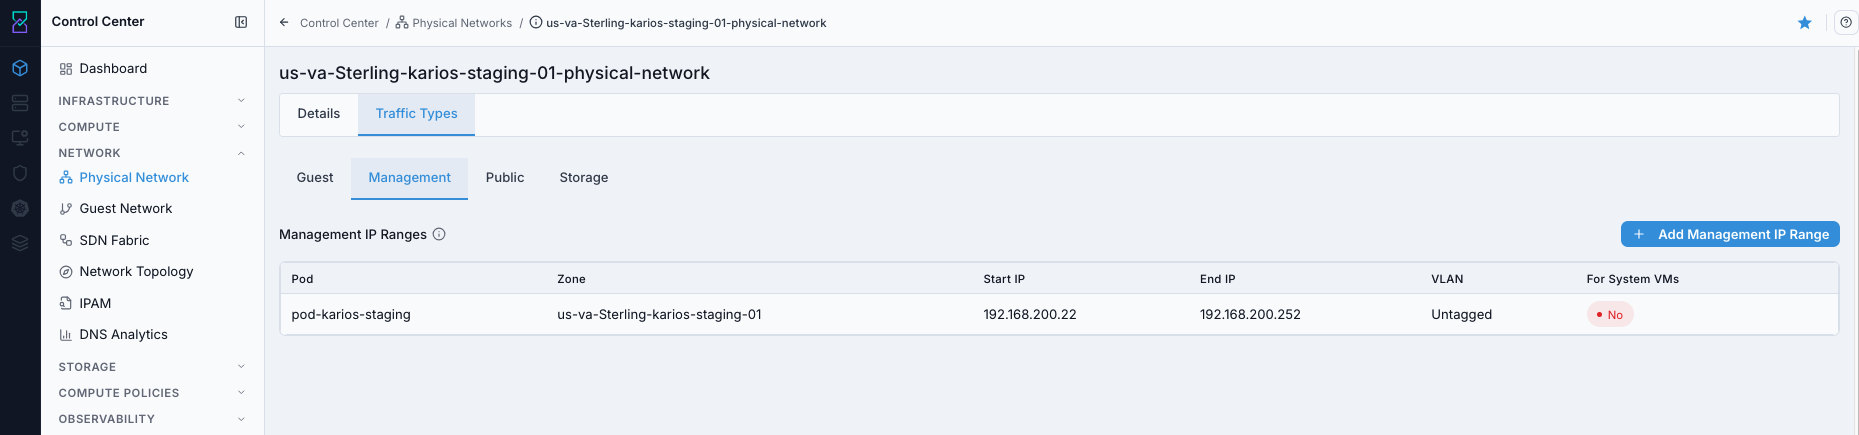
Details page shows:
Management IP range rows with pod, zone, subnet, VLAN, and system-VM reservation context.
+ Add Management IP Rangeaction for control-plane capacity expansion.
What you can do from this screen:
Review management addressing coverage per pod.
Add new management IP ranges.
Validate whether ranges are reserved for system VMs.
Steps:
Open
Control Center -> Network -> Physical Network.Click the target physical network name.
Click
Traffic Types.Click
Management.
Expected Outcome:
You can review all management IP ranges for this physical network.
You can add ranges, validate pod assignment, and verify system-VM reservation settings.
Continue with Page Help Review:
Click the top-right help icon.
Use the
iicon besideManagement IP Rangesfor field definitions.For help-panel behavior, follow the same flow used in
2.2.1 Open Physical Network Help Panel.
If this fails:
Refresh and reopen
Traffic Types -> Management.Confirm the selected physical network row is correct.
Confirm your account can open traffic-type details pages.
Step: Add Management IP Range
When to Use: Use this when a pod needs additional management addressing capacity.
Purpose: Hosts and system services consume management IPs from pod-scoped ranges.
Steps:
Open
Control Center -> Network -> Physical Network.Click the physical network name.
Click
Traffic Types -> Management.Click
+ Add Management IP Range.Fill required form fields:
Pod(required)Gateway(required)Netmask(required)Start IP(required)End IP(required)
Click
Create IP Range.

Field guidance:
Pod: only pods in the physical network’s zone are available.Gateway,Netmask,Start IP, andEnd IPmust be valid IPv4 values in the same subnet.Ensure
Start IP <= End IP.
Expected Outcome:
New row appears in
Management IP Rangesfor the selected pod.
How Many IPs to Plan:
One management IP per host added to the pod
Additional IPs for system VMs
Additional IPs for virtual routers when isolated guest networks are used
Tip
Allocate headroom in management ranges to avoid blocking future host or system-VM placement.
Warning
Do not overlap management range with guest, storage, or public ranges.
If this fails:
Verify pod selection is correct.
Verify IPv4 format and subnet math (gateway/start/end in same subnet).
Ensure
Start IP <= End IP.Confirm the range is not already present.
Management Tips:
Keep management traffic on a stable, dedicated network path.
Use pod-specific management ranges to avoid cross-pod conflicts.
Use
For System VMs: Yesranges when separating system-VM addressing from host management addressing.
Storage Traffic
Purpose:
Manage storage-network IP ranges used by hosts and storage services.
Storage traffic defines how hosts communicate with shared storage backends across Karios. These ranges are pod-scoped and are isolated on dedicated VLANs or subnets so storage I/O does not compete with management or guest traffic.
Warning
Running out of storage IPs can block new host onboarding and storage access expansion.
What Uses Storage Traffic:
Instance Storagebackends (for VM disk volume read/write paths)Image Storageservices (VM template, Boot Image, and snapshot transfer paths)Hoststhat mount and access shared storage
Storage IP Ranges Table Columns:
Column |
Description |
|---|---|
Pod |
Pod this storage range belongs to. |
Gateway |
Gateway for the storage subnet. |
Netmask |
Subnet mask for the storage subnet. |
Start IP |
First IP in the storage range. |
End IP |
Last IP in the storage range. |
VLAN |
VLAN tag for this range, or |
Actions |
Delete action for the range row. |
Step: Open Storage Traffic Details Page
When to Use: Use this when checking storage-network ranges on a physical network.
Purpose: Storage ranges are required for host-to-storage communication and expansion planning.
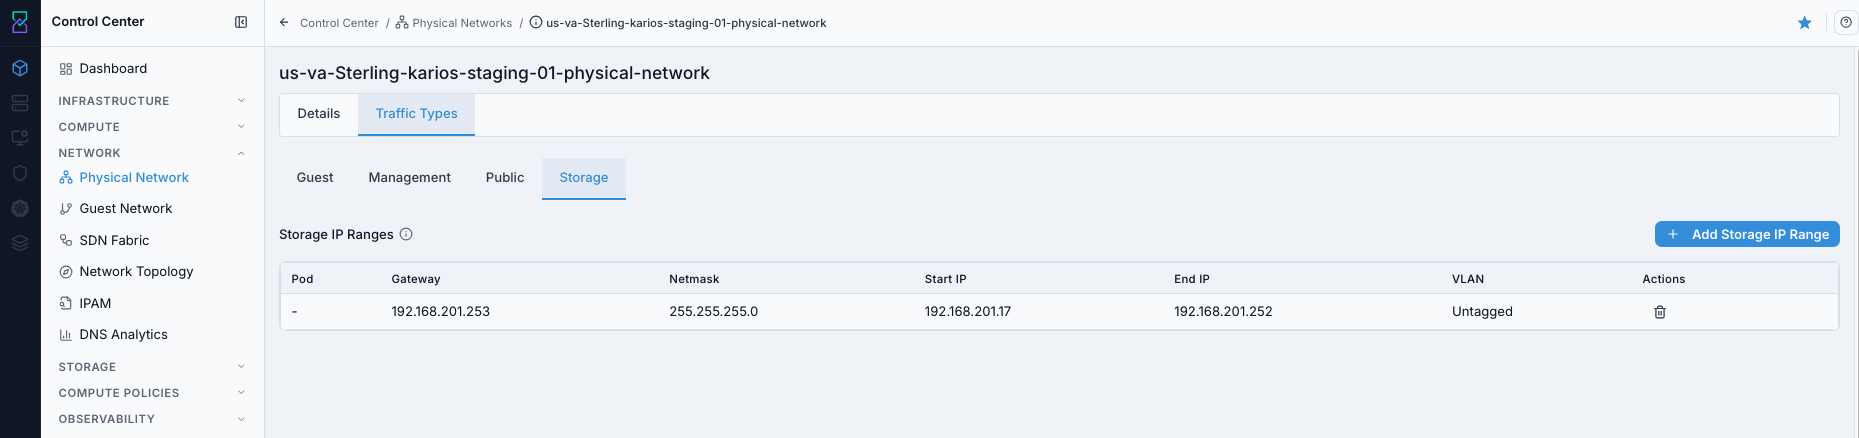
Details layout reference:

Details page shows:
Storage IP range rows with pod, subnet, VLAN, and actions.
+ Add Storage IP Rangeaction for storage-network capacity expansion.
What you can do from this screen:
Review storage network ranges per pod.
Add new storage IP ranges.
Delete existing ranges when no longer needed.
Steps:
Open
Control Center -> Network -> Physical Network.Click the target physical network name.
Click
Traffic Types.Click
Storage.
Expected Outcome:
You can review storage ranges and launch add/delete actions.
Continue with Page Help Review:
Click the top-right help icon.
Use the
iicon besideStorage IP Rangesfor field definitions.For help-panel behavior, follow the same flow used in
2.2.1 Open Physical Network Help Panel.
If this fails:
Refresh and reopen
Traffic Types -> Storage.Confirm the selected physical network row is correct.
Confirm your account can open storage traffic details.
Step: Add Storage IP Range
When to Use: Use this when a pod needs more storage-network IP capacity.
Purpose: Each host and storage service path consumes storage IPs from these ranges.
Steps:
Open
Control Center -> Network -> Physical Network.Click the physical network name.
Click
Traffic Types -> Storage.Click
+ Add Storage IP Range.Fill required fields:
PodGatewayNetmaskStart IPEnd IP
Click
Create IP Range.
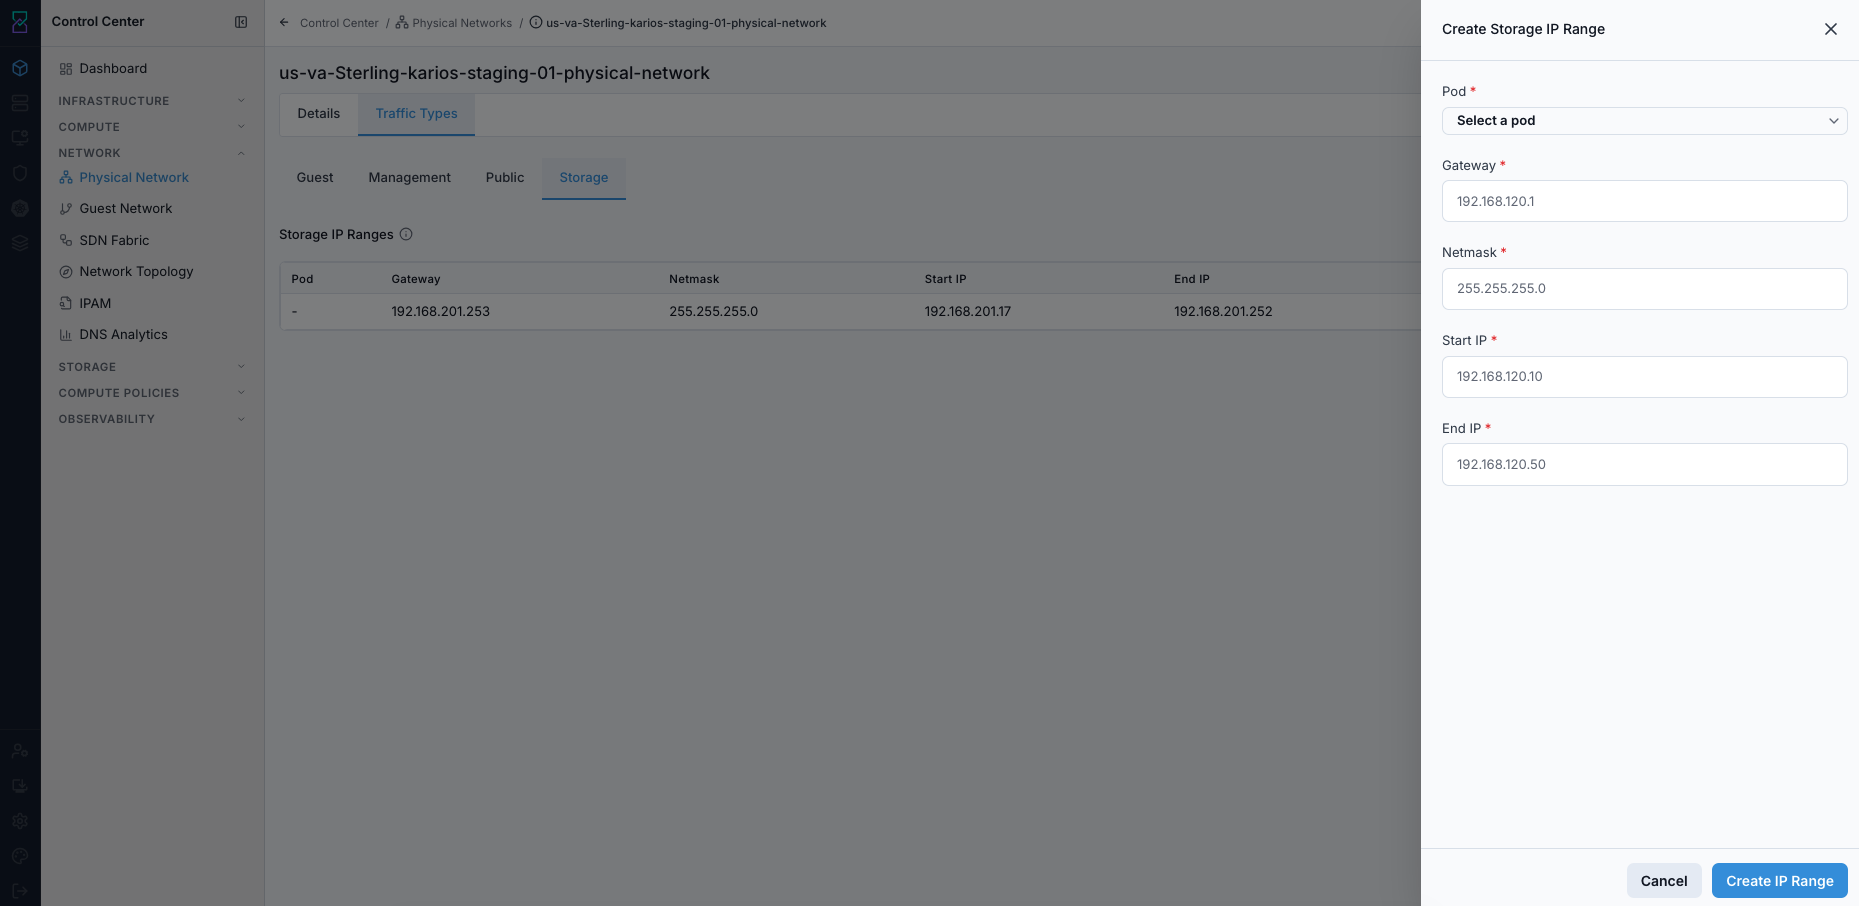
Field guidance:
Pod: choose the pod this range belongs to.Gateway,Netmask,Start IP, andEnd IPmust be valid IPv4 values in one subnet.Ensure
Start IP <= End IP.
Expected Outcome:
New row appears in
Storage IP Ranges.
How Many IPs to Plan:
One storage IP per host in the pod
One storage IP for image-storage services
Additional spare IPs for future host additions
Tip
Keep storage traffic on a dedicated low-latency network path where possible.
If this fails:
Confirm valid pod and subnet values.
Confirm no overlap with management/guest/public ranges.
Confirm
Start IP <= End IP.
Step: Delete Storage IP Range
When to Use: Use this when a specific storage range is no longer needed.
Purpose: Removing unused ranges keeps storage addressing clean and avoids stale allocations.
Start from the Storage traffic details page shown in Task: Open Storage Traffic Details Page above and locate the target row in the Storage IP Ranges table.
Steps:
In
Traffic Types -> Storage, locate the target range row.Click the trash icon in the
Actionscolumn.Confirm deletion when prompted.
Refresh and confirm the row is removed.
Expected Outcome:
The selected storage range is removed.
Existing hosts using already-assigned IPs continue operating.
New hosts cannot receive storage IPs if no storage ranges remain.
Warning
Delete only after confirming capacity and growth requirements are still satisfied.
If this fails:
Check whether the range is still referenced by active services.
Verify you have permission for delete action.
Retry after releasing dependent allocations.
Storage Tips:
Use dedicated VLANs/subnets for storage traffic to protect storage performance.
Multiple storage ranges can exist in the same pod for separate storage backends.
Validate storage network bandwidth and latency to match backend requirements.
Public Traffic
Purpose:
Manage internet-facing IP ranges used for external connectivity services.
Public traffic provides the public IP inventory used for outbound and inbound connectivity in cloud networking workflows.
What Public IPs Are Used For:
Source NAT: outbound internet access for isolated guest networks.Static NAT: one-to-one public-to-private VM mapping.Port Forwarding: port-level mapping from public IP to VM service ports.Firewall: ingress policy control applied to public-IP traffic.Load Balancing: front-end public VIPs distributed to backend VM pools.VPN: remote-access and site-to-site tunnel endpoints.
Warning
Incorrect gateway or routing for public ranges can break all external connectivity for dependent services.
Public IP Ranges Table Columns:
Column |
Description |
|---|---|
VLAN |
VLAN tag for this range, or |
Gateway |
Upstream gateway for the public subnet. |
Netmask |
Subnet mask for the public range. |
Start IP |
First public IP in the range. |
End IP |
Last public IP in the range. |
Actions |
Edit and Delete controls for the range. |
Step: Open Public Traffic Details Page
When to Use: Use this when reviewing internet-facing IP inventory and range actions.
Purpose: Public ranges back Source NAT, Static NAT, load balancer, VPN, and forwarding workflows.
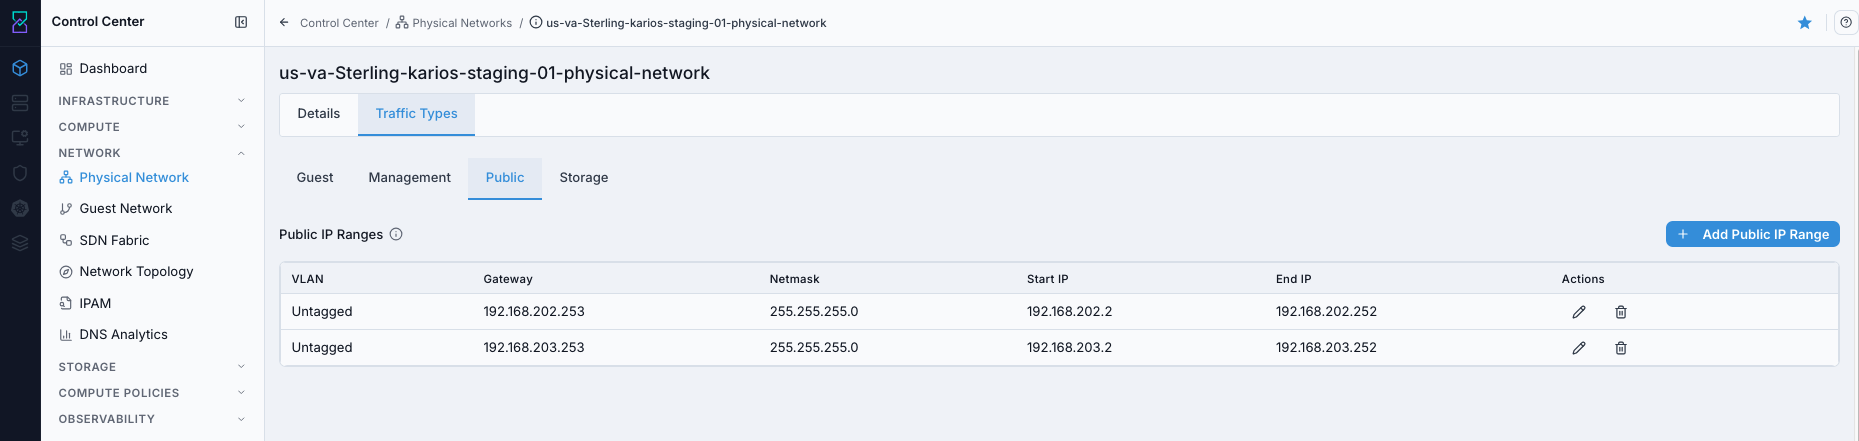
Details page shows:
Public IP range rows with
VLAN,Gateway,Netmask, and IP boundaries.Actionsfor in-place edit/delete.+ Add Public IP Rangeaction for expanding public inventory.
What you can do from this screen:
Review current public subnet inventory.
Add, edit, and delete public IP ranges.
Validate gateway/subnet consistency before NAT and exposure workflows.
Steps:
Open
Control Center -> Network -> Physical Network.Click the target physical network name.
Click
Traffic Types.Click
Public.
Expected Outcome:
You can view configured public IP ranges and launch create/edit/delete actions.
Continue with Page Help Review:
Click the top-right help icon.
Use the
iicon besidePublic IP Rangesfor field definitions.For help-panel behavior, follow the same flow used in
2.2.1 Open Physical Network Help Panel.
If this fails:
Refresh and reopen
Traffic Types -> Public.Confirm the selected physical network row is correct.
Confirm your account can open public traffic details.
Step: Add Public IP Range
When to Use: Use this when you need additional public addresses for external connectivity services.
Purpose: Public IP pool size controls how many NAT, VPN, and public service mappings can be created.
Start from the Public traffic details page shown in Task: Open Public Traffic Details Page above.
Steps:
Open
Control Center -> Network -> Physical Network.Click the physical network name.
Click
Traffic Types -> Public.Click
+ Add Public IP Range.Fill required fields:
Physical NetworkZoneVLAN(oruntagged)GatewayNetmaskStart IPEnd IP
Click
Create IP Range.
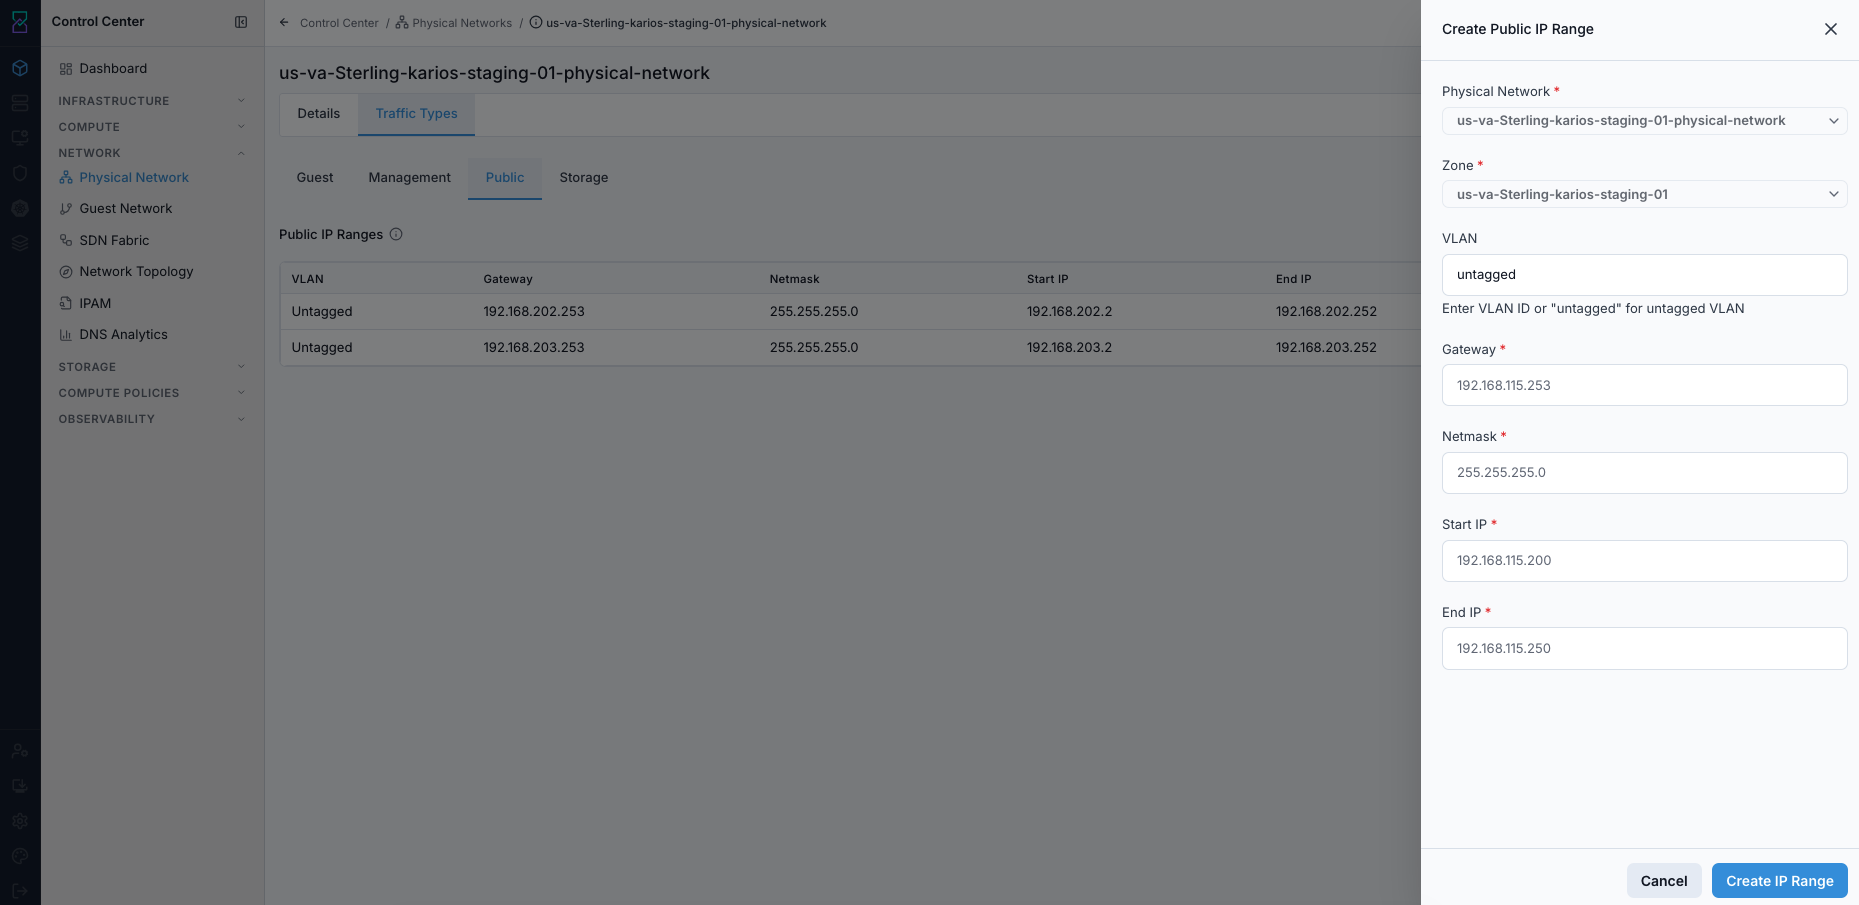
Field guidance:
Physical Network: parent network for this range.Zone: populated from the selected physical network.VLAN: tagged VLAN ID oruntagged.Gateway,Netmask,Start IP, andEnd IPmust be valid IPv4 values in the same subnet.
Expected Outcome:
New range appears in
Public IP Ranges.
How Many Public IPs to Plan:
One Source NAT IP per isolated guest network.
One IP per static NAT VM mapping.
Additional IPs for VPN and load-balancer endpoints.
Port-forwarding services can share a public IP when port mappings do not overlap.
If this fails:
Verify
Gateway,Netmask,Start IP, andEnd IPare valid and in the same subnet.Confirm range does not overlap an existing public range.
Confirm VLAN/tagging selection is valid for the selected physical network.
Step: Edit Public IP Range
When to Use: Use this when correcting gateway/netmask/start/end values on an existing range.
Purpose: In-place edits adjust usable public range boundaries without recreating the range object.
Start from the Public traffic details page shown in Task: Open Public Traffic Details Page above.
Steps:
In
Traffic Types -> Public, locate the target row.Click the pencil icon in
Actions.Update allowed fields in the edit form.
Save and verify the updated values in the table.
Expected Outcome:
Updated range values are visible in the
Public IP Rangestable.Existing allocations remain unchanged; only range boundaries/metadata are updated.
Tip
Use edit for boundary corrections; use new range creation for major subnet redesigns.
Editable fields:
GatewayNetmaskStart IPEnd IP
Not editable in-place:
VLANPhysical NetworkZone
Warning
Shrinking a range affects only unallocated IPs. In-use IP allocations are not reclaimed automatically.
If this fails:
Confirm you are editing allowed fields only (gateway/netmask/start/end).
Verify updated values remain in one valid subnet.
Refresh the page and retry the edit action.
Step: Delete Public IP Range
When to Use: Use this when a public range is no longer required.
Purpose: Removing unused ranges keeps the public IP inventory aligned to active services.
Start from the Public traffic details page shown in Task: Open Public Traffic Details Page above.
Steps:
In
Traffic Types -> Public, locate the target row.Click the trash icon in
Actions.Confirm deletion.
Refresh and verify row removal.
Expected Outcome:
The selected public IP range is removed from the table.
Deleted range space is no longer available for new allocation.
Warning
Delete is blocked when IPs are still allocated to NAT, load balancer, VPN, or forwarding rules.
If this fails:
Confirm subnet and gateway correctness.
Check whether any public IP from the range is in active use.
Validate you have sufficient privileges for the action.
Retry after releasing dependent public IP allocations.
Tips:
Public IPs are finite resources. Use port forwarding where possible to reduce one-IP-per-service consumption.
Multiple public ranges can be added to one physical network when needed.
Isolated networks consume public IPs for Source NAT; shared networks use their own guest-network IP definitions.
Always verify upstream gateway reachability before creating ranges.
3. Guest Networks
3.1. What are Guest Networks?
Guest networks are where VMs attach and receive their runtime IP connectivity.
Quick selection:
Isolated: private network with built-in network services.Shared: flat subnet model with explicit VLAN/IP inputs.
What These Terms Mean:
CIDR: Classless Inter-Domain Routing notation for subnet size (for example10.1.0.0/16).NIC: Network Interface Card attached to a VM.NAT: Network Address Translation for private-to-public traffic mapping.Gateway: default route endpoint used by VMs to reach other networks.
For create/delete tasks, use Sections 3.5 and 3.6.
3.2. Network States
State/action quick reference:
State |
What It Means |
Typical Operator Action |
|---|---|---|
Allocated |
Created, waiting for first isolated-network VM/service activation |
Attach/provision first VM to activate services |
Implementing |
Isolated-network services are being initialized |
Wait and monitor; avoid concurrent config changes |
Setup |
Operational and ready for VM use |
Attach additional VMs and continue normal operations |
3.3. First VM Activation and Guest-Network State Change
After creating an isolated guest network, first-VM provisioning performs initial network-service activation.
Expected state flow:
First isolated-network VM provisioning triggers state progression
Allocated -> Implementing -> Setup.Additional VMs on the same guest network use the existing initialized network services.
Tip
Watch guest-network state changes between Allocated and Setup while the first VM is being created.
If the network remains Implementing after provisioning tasks complete, review the If this fails guidance in the related Guest Network tasks in this section.
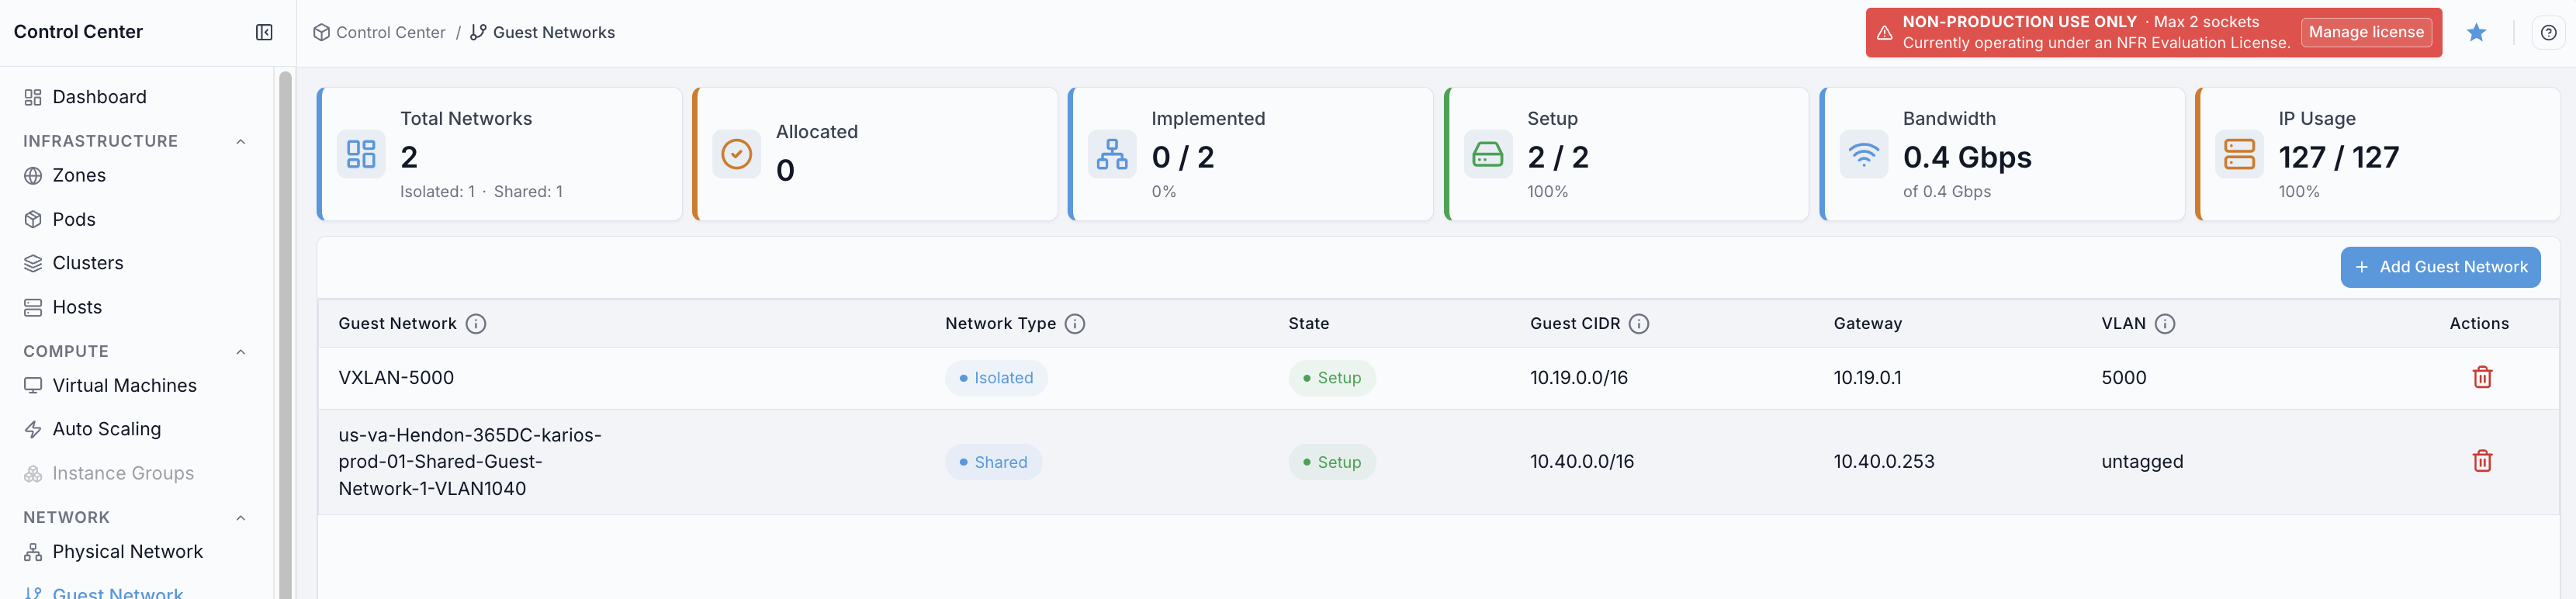
3.4. Viewing Guest Networks
Access: Control Center → Network → Guest Network
This dashboard shows all guest networks in the selected environment and provides the main entry points for create, review, and delete actions.
Actions you can perform:
Click
+ Add Guest Networkto open the guest-network creation form.Click a value in
Guest Networkcolumn to open that network’s details page.Click the trash icon in
Actionsto delete a guest network row.Review
Statebadges (for exampleSetup) to confirm whether a network is ready for VM attachment.Hover the
iicons in table headers (where shown) for inline field help.
VXLAN visibility in this screen:
VXLAN-backed guest networks appear in the same
Guest Networktable as other network types.In the screenshot above,
VXLAN-5000is an example of a VXLAN guest-network row.Use the same actions for VXLAN rows: open details from
Guest Networkname, verifyState, and use rowActions.
Dashboard cards and definitions:
Card |
Definition |
|---|---|
|
Total count of guest networks in this view, with isolated and shared totals shown below the count. |
|
Count of networks currently in |
|
Implemented/active-state summary shown as count and percentage. |
|
Networks currently ready for workload attachment, shown as count and percentage. |
|
Aggregate bandwidth usage shown as used versus total capacity. |
|
Aggregate IP consumption shown as used versus total IPs. |
Table columns and definitions:
Column |
Definition |
|---|---|
|
Guest network name. Click to open details. |
|
Network model: |
|
Current network lifecycle state (for example |
|
IPv4 subnet assigned to the guest network. |
|
Default gateway for that guest subnet. |
|
Segment identifier shown for the network (VLAN value, or overlay segment value for VXLAN-backed rows), or |
|
Row-level action icons (for example delete). |
Use this screen first to validate guest-network readiness before VM deployment.
3.4.1. Open Guest Network Help Panel
When to Use:
Use this after reviewing the Guest Network dashboard when you need help text for fields and actions.
Purpose:
Open the dashboard help panel as a separate step so users can read quick-reference guidance before performing create/delete operations.
Steps:
Open
Control Center -> Network -> Guest Network.Click the top-right help icon.
Review the
Quick Referencecontent and use search to find specific field guidance.
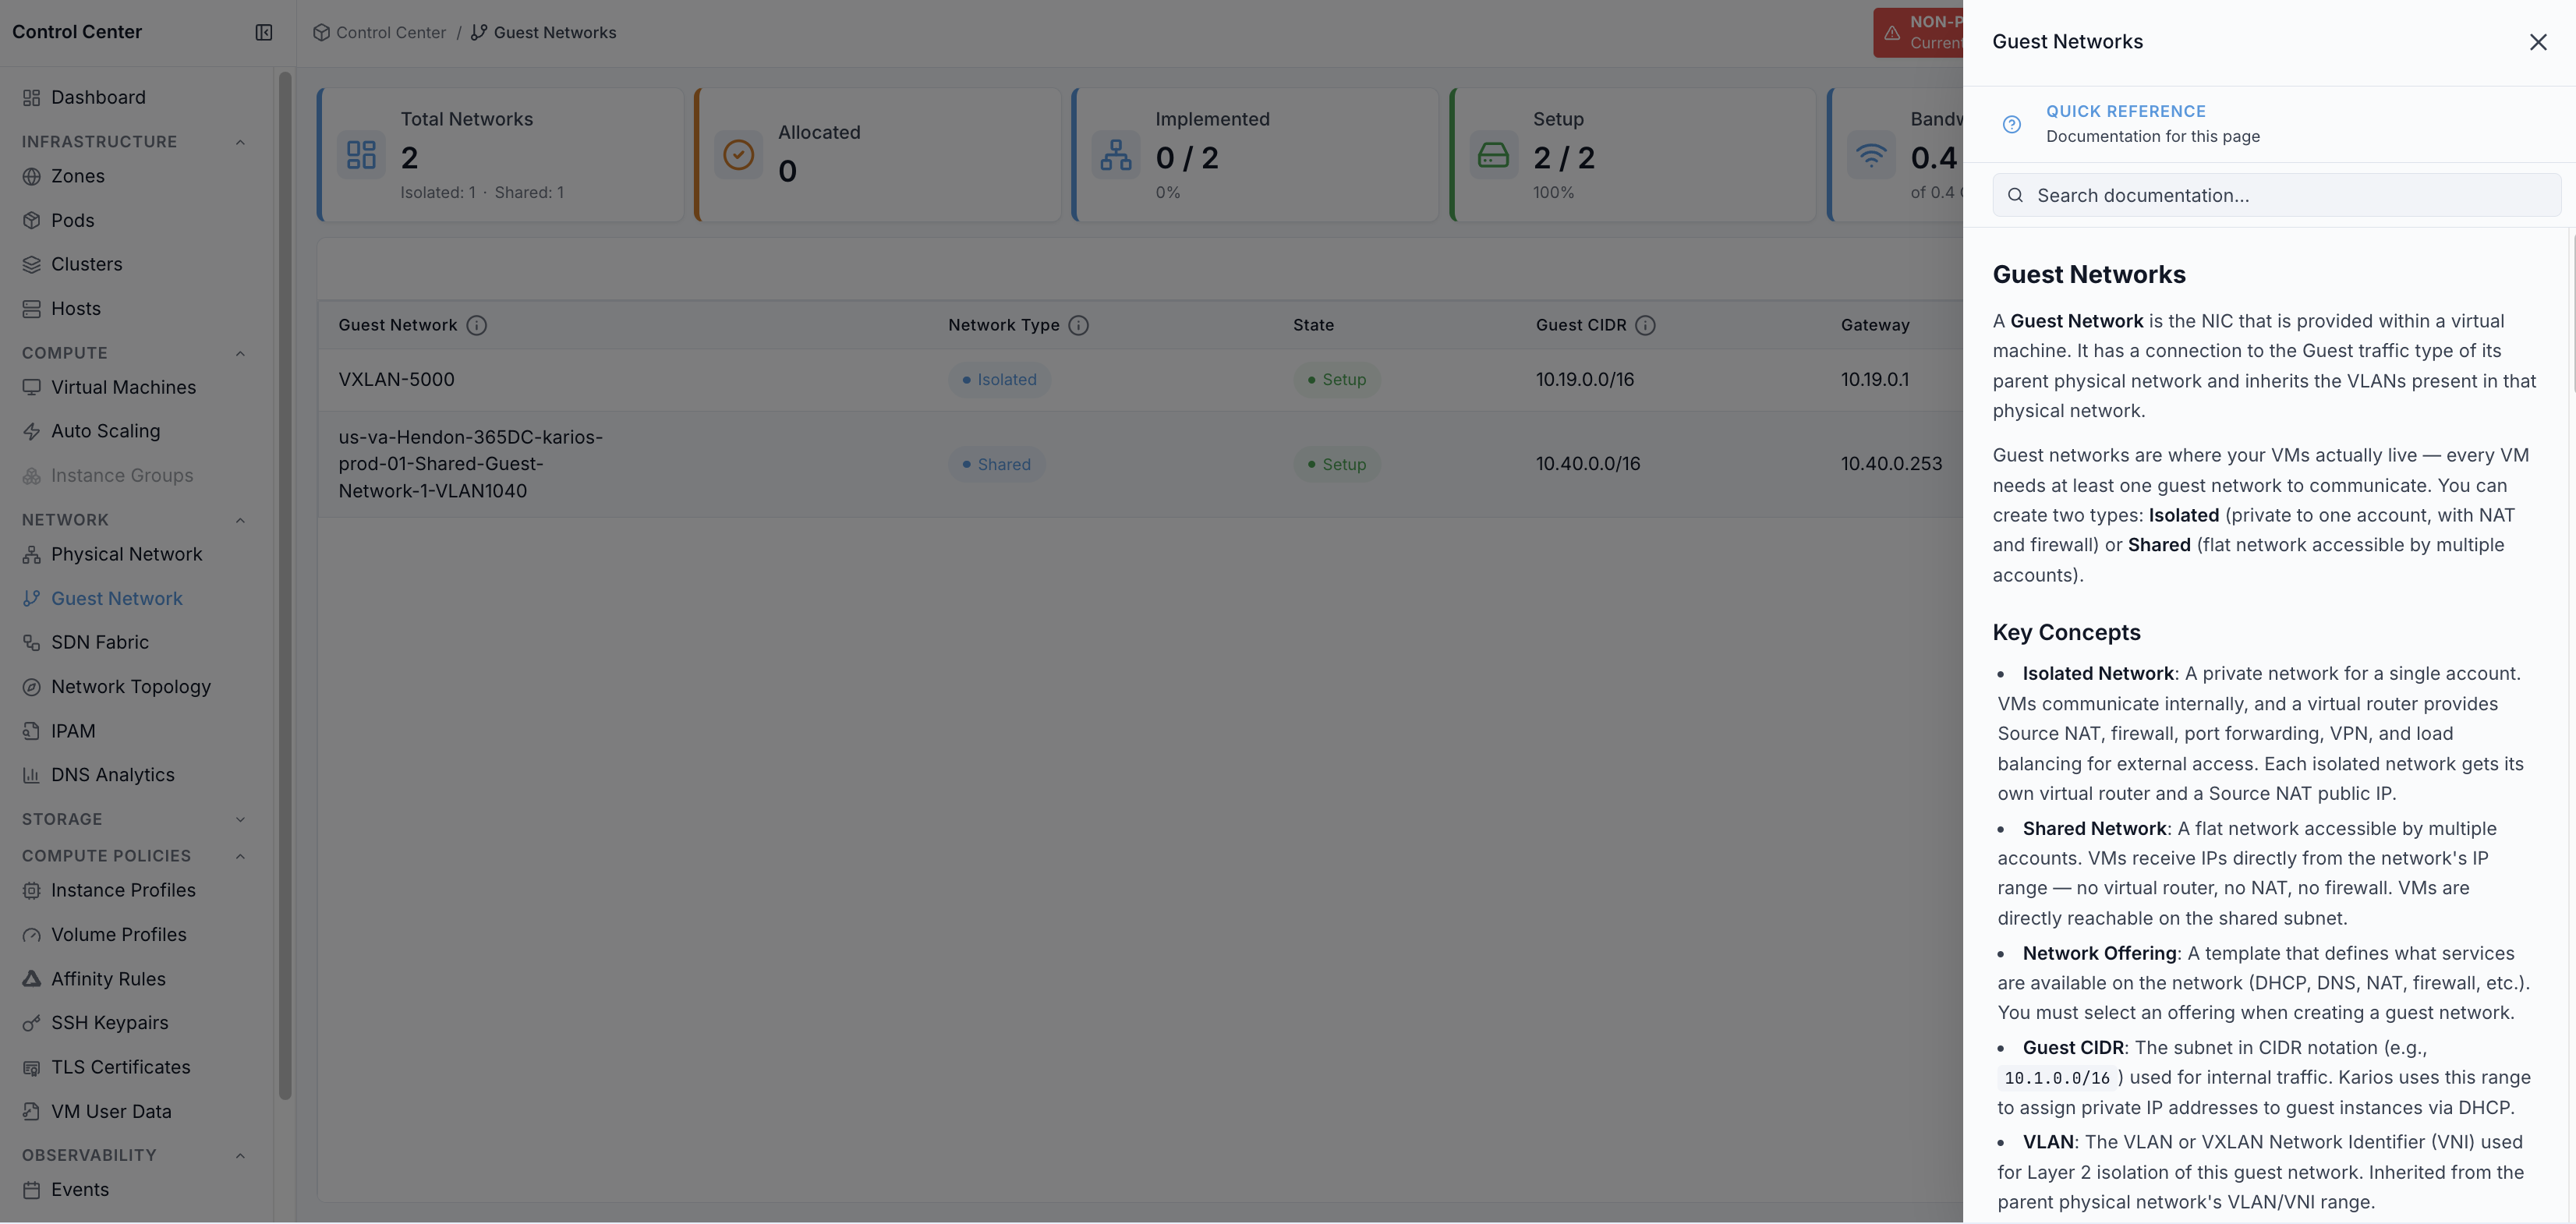
Expected Outcome:
Guest Networkshelp content opens in the right-side panel.You can review key concepts such as isolated networks, shared networks, network offerings, guest CIDR, and VLAN/VNI usage.
You can return to dashboard actions with clear field guidance.
If this fails:
Refresh the page and click the help icon again.
Confirm your account can access in-product help content.
Retry after reopening
Guest Network.
3.5. Creating Guest Network
Use this section when creating guest networks from Control Center -> Network -> Guest Network.
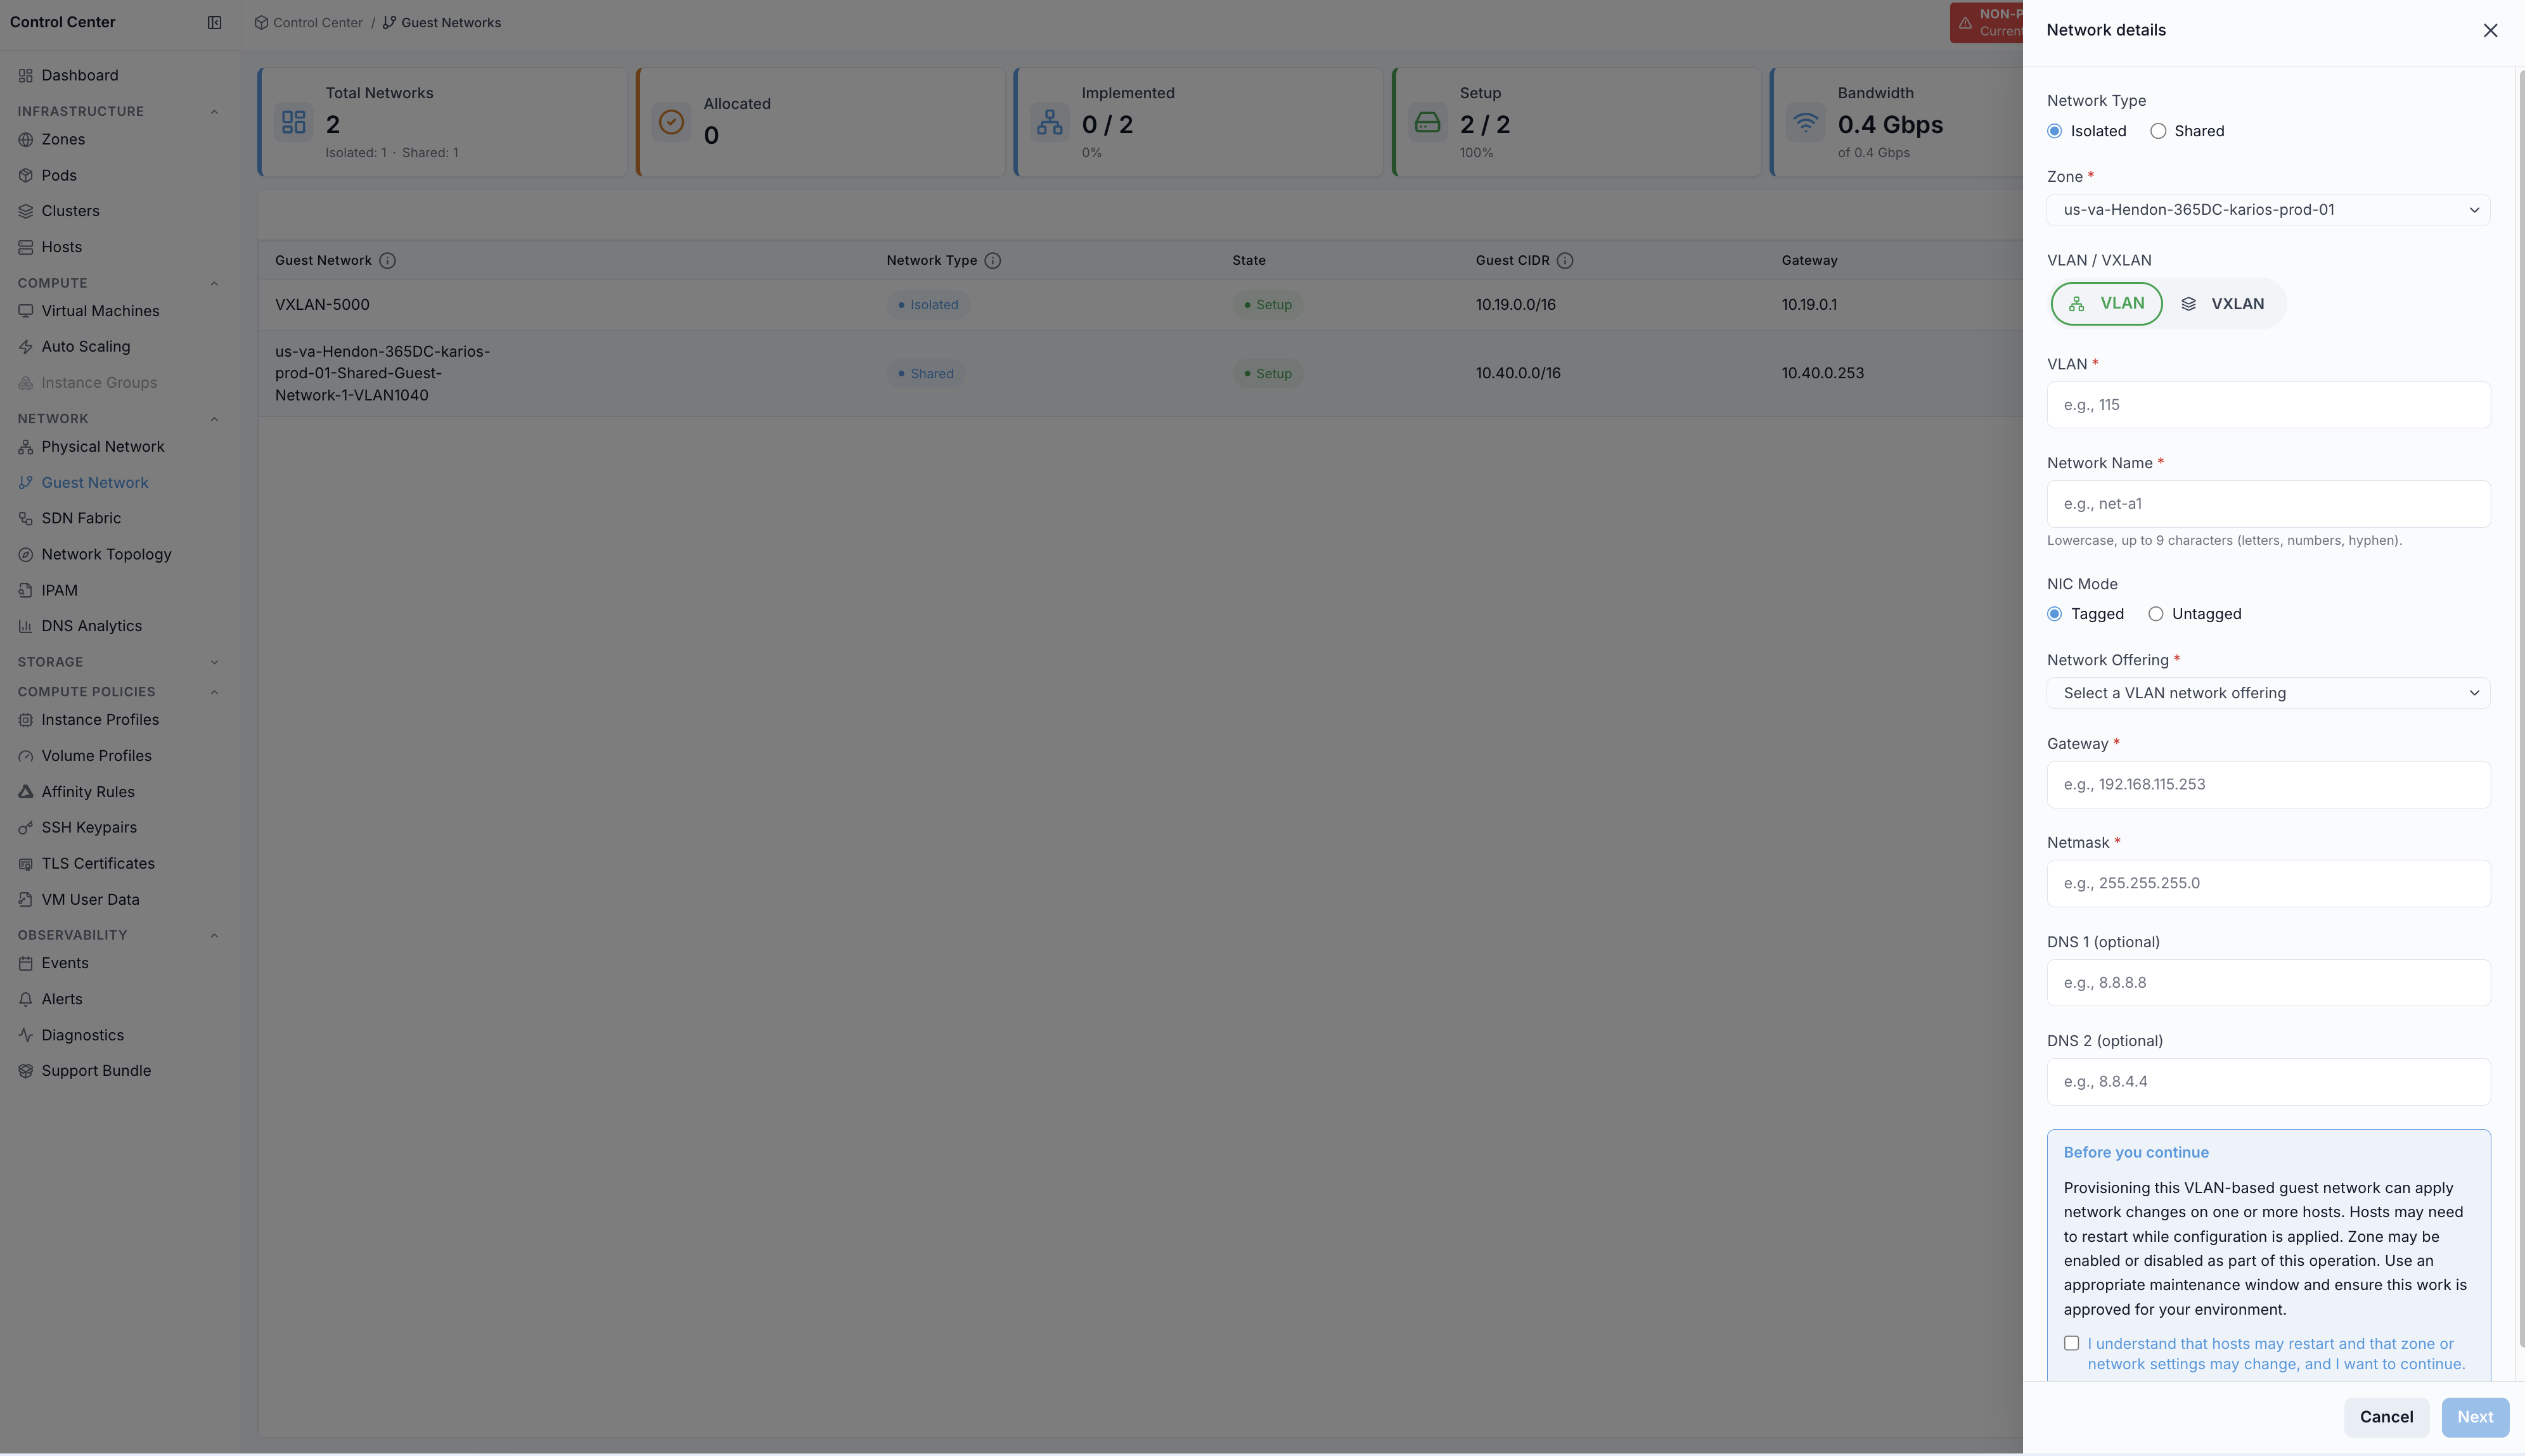
Step: Add Isolated Guest Network (from Guest Network page)
When to Use: Use this when creating a tenant-isolated network directly from the Guest Network module.
Purpose: Create an isolated guest network with the required offering and network parameters.
Steps:
Open
Control Center -> Network -> Guest Network.Click
+ Add Guest Network.Keep
Network TypeasIsolated.Select
VLANorVXLANbased on the network segment you are creating.Complete the required network details.
Acknowledge the
Before you continuenotice when it appears.Click
Create Network.
Isolated-network fields:
Zone(required)VLANorVXLAN (VNI)(required, depending on selected mode)Network Name(required)NIC Mode:TaggedorUntaggedwhen VLAN mode is selectedNetwork Offering(required; use a VLAN-capable or VXLAN-capable isolated offering)GatewayandNetmask(required)DNS 1andDNS 2(optional)
VXLAN option (isolated):
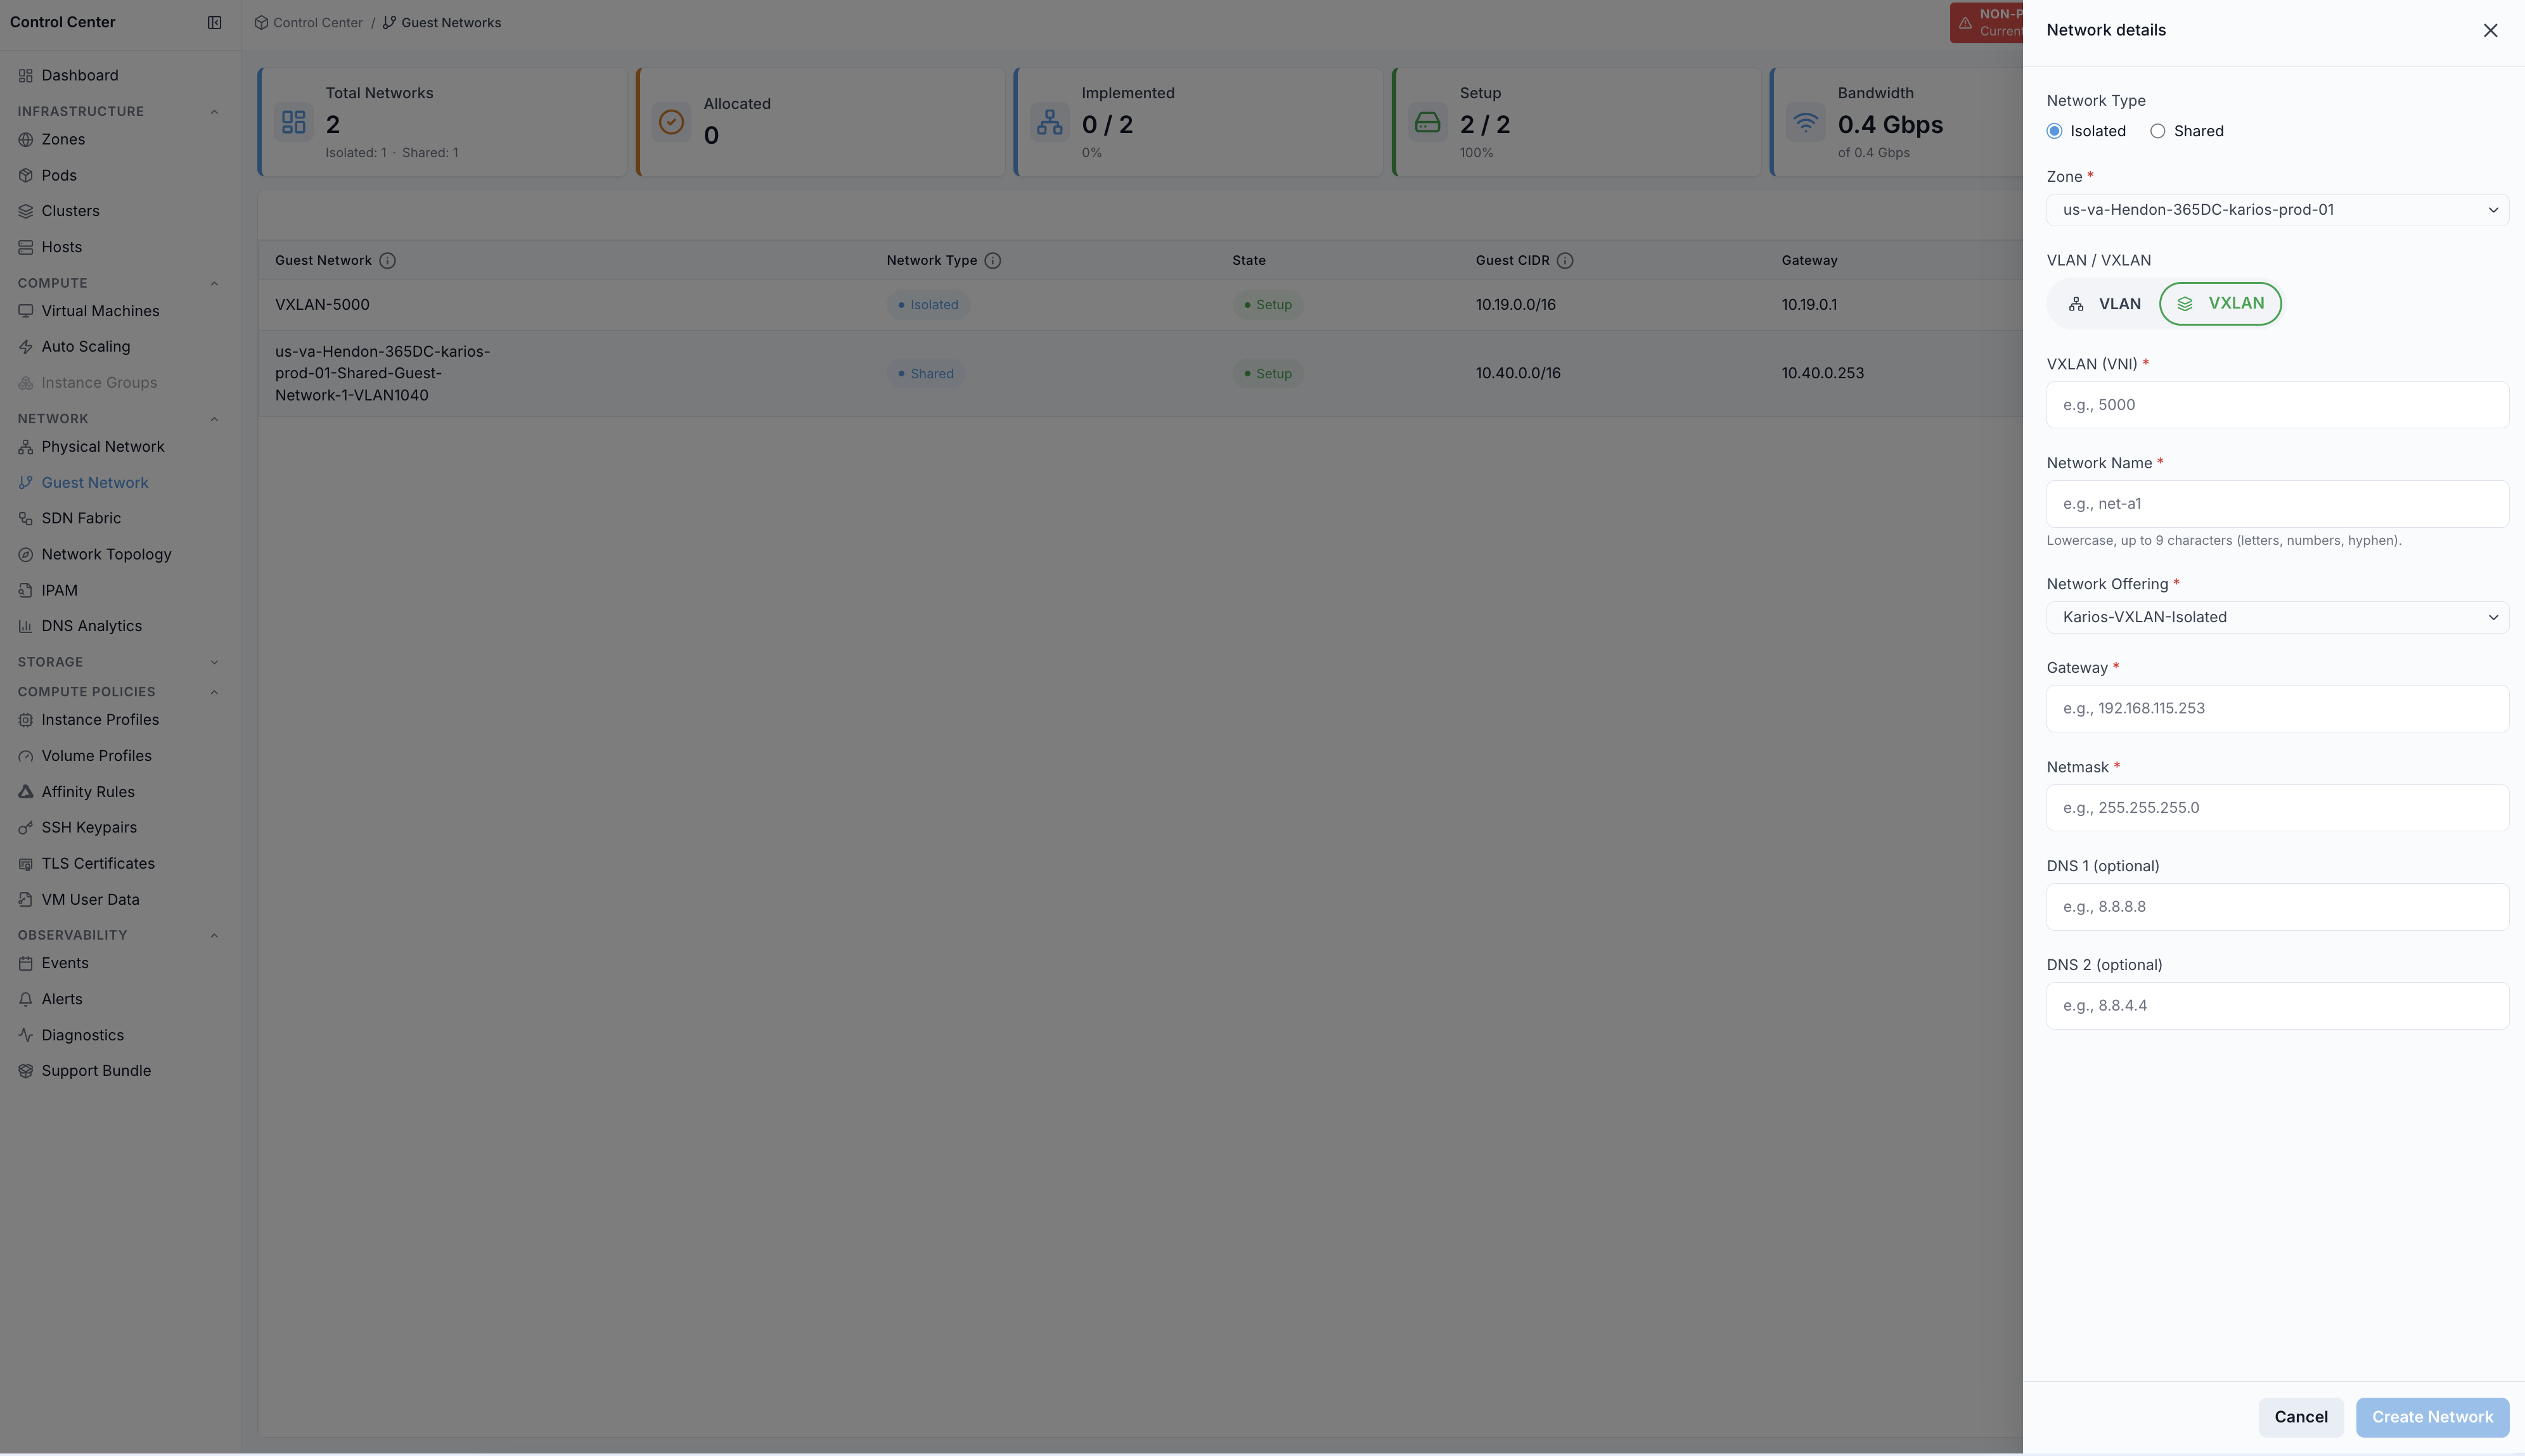
VXLAN-specific fields:
VXLAN (VNI)(required)Network Offeringset to a VXLAN-capable isolated offeringGatewayandNetmask(required)DNS 1andDNS 2(optional)
Expected Outcome:
New isolated network is listed.
Initial state can be
Allocateduntil first VM/network-service activation.
Tip
Confirm the network appears in the list before attempting to create it again.
Warning
Network offering choice affects available services and can not be easily changed later.
If this fails:
Confirm required fields are not blank.
Confirm offering supports isolated mode.
Verify network name is unique in zone.
Step: Add Shared Guest Network (from Guest Network page)
When to Use: Use this when creating a shared guest network directly from the Guest Network module.
Purpose: Create a shared guest network with explicit VLAN and IP-range settings.
Steps:
Open
Control Center -> Network -> Guest Network.Click
+ Add Guest Network.Select
Network Type -> Shared.Complete the required network details.
Click
Create Network.
Shared-network fields:
Zone(required)Network Offering(required; must support shared networks)VLAN(required; oruntaggedwhere applicable)Network Name(required)NIC Mode:TaggedorUntaggedStart IPandEnd IP(required)GatewayandNetmask(required)DNS 1andDNS 2(optional)
Expected Outcome:
Shared network is listed in
Setupafter successful creation.VMs consume IPs from the provided range.
Expected Behavior
Shared networks do not require isolated-network service initialization.
Warning
Common First-Time Mistake
Wrong: gateway placed inside VM allocation pool.
Symptom: IP conflicts or unstable connectivity.
Correct pattern:
CIDR:
192.168.10.0/24Gateway:
192.168.10.1(reserved)Start IP:
192.168.10.10End IP:
192.168.10.250
Tip
If you do not know Physical Network ID, use Add Shared Guest Network from Physical Network.
That flow pre-populates the physical network context.
If this fails:
Verify subnet math and gateway reachability.
Verify no overlap with existing ranges.
Verify VLAN value is valid for target physical network.
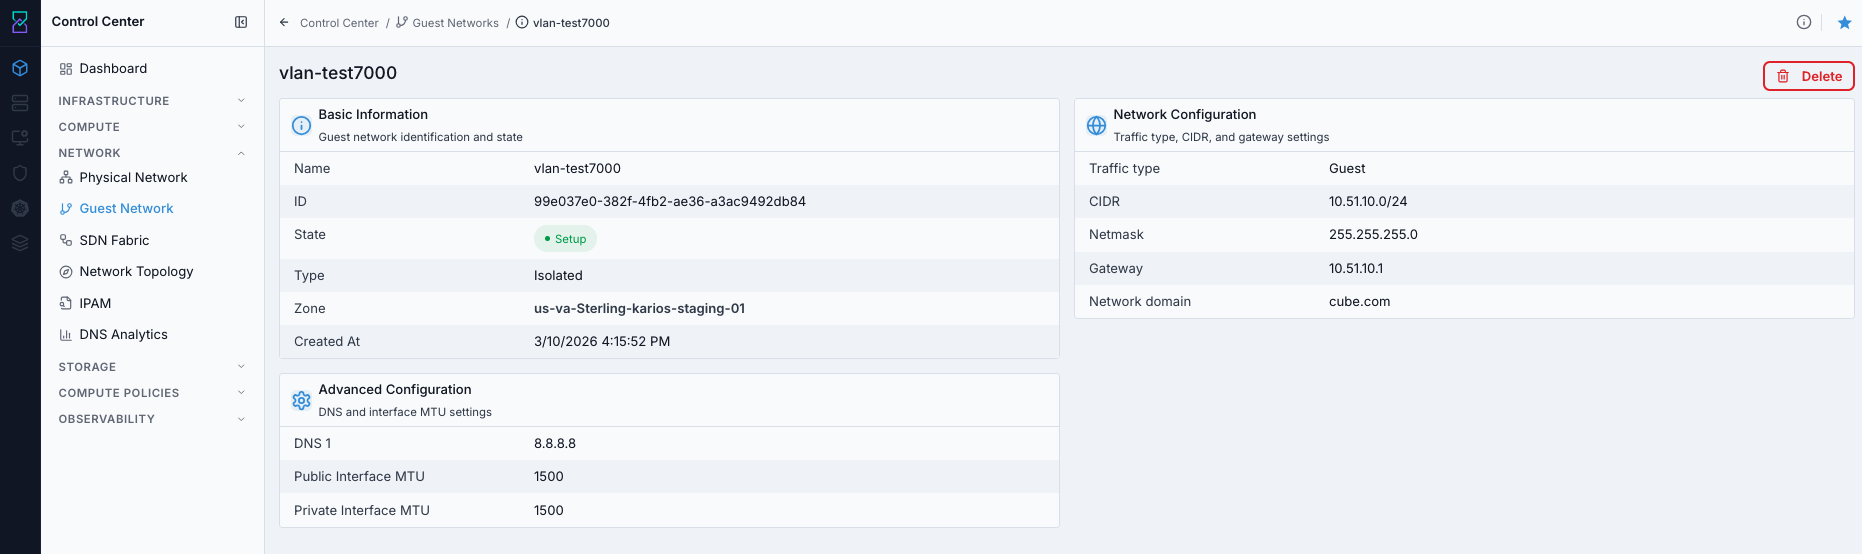
3.6. Guest Network Details
Step: Review Guest Network Details
When to Use: Use this when validating configuration and identity fields for one guest network.
Purpose: Inspect the selected guest network before VM attachment, change review, or troubleshooting.
Steps:
Open
Control Center -> Network -> Guest Network.Click a network name from the table.
Validate:
IDfor API calls, automation, and log correlationStateandTypeCIDR,Netmask,GatewayDNSand MTU values in advanced fields
Expected Outcome:
You confirm the guest network identifier and whether core network values match design intent.
If this fails: 1. Refresh the guest network list and reopen the same row. 2. Confirm the network still exists and is visible in the table. 3. Confirm your account can access guest-network details.
Step: Delete Guest Network
When to Use: Use this when a guest network is no longer needed and has no required dependents.
Purpose: Remove a guest network from inventory and confirm it is no longer available for VM attachment.
Use the Guest network details screenshot shown in Task: Review Guest Network Details above.
Steps:
Open
Control Center -> Network -> Guest Network.Click the target network name.
In details page, click
Delete(top-right).Confirm deletion.
Return to guest network list and verify the row is removed.
Expected Outcome:
The guest network is removed from inventory.
It no longer appears as an attachable network during VM provisioning.
Warning
Delete only after detaching workloads and dependent services.
If this fails:
Check whether VMs or services are still attached.
Check whether related NAT/LB/firewall objects still reference this network.
Retry after dependencies are removed.
4. SDN Fabric
The SDN Fabric is the Karios EVPN-VXLAN control plane. It lets operators offer self-service, isolated tenant networks across compute hosts without raising a switch-team ticket for every new network.
What you get:
Self-service isolation. Create a fully isolated tenant network on demand. Its traffic rides a private overlay tunnel across your hosts; nobody outside the network sees it.
Visibility instead of guesswork. The dashboard shows, per node, whether the fabric is healthy — BGP up, OSPF formed, routes flowing — so you are never blindly debugging.
A safety net. If the fabric is unhealthy, Karios refuses to create a network or VM that would silently break, and tells you which node is at fault. You find out at click-time, not after a tenant reports broken connectivity.
After a one-time Fabric Switch setup (underlay, BGP peer, fabric ASN, router-id base, a Preflight check, and apply), day-to-day you simply create networks — the fabric is already there.
Already running on a fabric that someone else set up? You only need 4.2 when configuring the fabric for the first time — skip to the Dashboard (4.3) to check health and the Troubleshooting Flow (4.7).
Term Definitions:
BGP: Border Gateway Protocol used for route exchange between SDN nodes.OSPF: Open Shortest Path First used for underlay reachability between nodes.EVPN: Ethernet VPN control-plane for sharing MAC/IP endpoint information.VXLAN: overlay encapsulation that carries isolated tenant traffic host-to-host.VNI: VXLAN Network Identifier — the overlay network’s ID (its “VLAN number”), with a ~16 million address space.VTEP: VXLAN Tunnel Endpoint on a node. It is also the BGP loopback — one loopback for both, which is why the fabric is iBGP.RIB: Routing Information Base, the active route table used for forwarding decisions.underlay/overlay: the routed network OSPF runs on (underlay) versus the isolated virtual networks VXLAN builds on top (overlay).iBGP: internal BGP — every node uses the same AS number. Karios is iBGP because the BGP loopback and the VTEP are one and the same loopback.FRR: FRRouting, the routing engine that runs on each node.route reflector: the BGP peer (typically the spine) that every node connects to; its address is the peering IP.BFD: Bidirectional Forwarding Detection, fast link-failure detection for BGP/OSPF.DCI: Data Center Interconnect, the external/public path.Public MTU (DCI)is its MTU.SVI/VRF: the L3 gateway interface and the routing instance for an overlay segment.IMET(Type-3): EVPN route that advertises “this VTEP has joined this VNI” — VTEP membership.BUM: Broadcast, Unknown-unicast, and Multicast traffic, replicated to VTEPs in a VNI.
4.1. Concepts: VXLAN, the Three Planes, and Boot Order
When to Use:
Read this before setup or troubleshooting so every screen maps to a known role.
Purpose:
Explain why Karios uses EVPN-VXLAN and how its planes fit together.
Why VXLAN instead of VLAN:
Before (VLAN) |
After (VXLAN + SDN Fabric) |
|---|---|
Network team creates each VLAN on the switch |
You create networks yourself in the console |
A ticket and a wait, every time |
Self-service, in seconds, no ticket |
~4094 networks maximum |
~16,000,000 isolated networks |
Switch change = risk and a change window |
Zero switch change after first-time setup |
Hard to see if it is working |
A dashboard that shows live health |
Isolation lives in software, in an overlay on top of your existing network. You configure the switch once (it only needs to speak OSPF and BGP). VXLAN is made operable at scale by EVPN, an industry-standard control technology.
The three planes (every screen maps to one):
Plane |
Protocol |
Plain-English job |
UI tab |
|---|---|---|---|
Underlay |
OSPF |
How each host reaches every other host. Also discovers the BGP peer’s address. |
OSPF tab |
Control |
BGP + EVPN |
Who lives on which overlay network (MAC/IP + VNI membership). |
BGP tab + EVPN tab |
Data |
VXLAN |
Wraps and carries the tenant’s packets host-to-host. |
(no tab — it is the result) |
The boot order (the single most important thing):
OSPF forms  ->  OSPF learns the BGP peering IP  ->  BGP moves Connect -> Established
            ->  EVPN routes flow  ->  VXLAN tunnels carry traffic
Important
If OSPF is not healthy, BGP cannot establish, and no VXLAN network will work. When you debug, always start at OSPF and walk up. Karios uses iBGP-EVPN with an OSPF underlay and a deliberately minimal default FRR configuration — few knobs, few failure modes.
4.2. Add a Fabric Switch
When to Use:
Use this for the one-time fabric setup, before or after onboarding your first node.
Purpose:
Configure the underlay, BGP peer, and router-id derivation so nodes converge to a shared fabric configuration.
Note
“Add a Fabric Switch” registers your existing physical switch/router with Karios and
rolls the matching routing config out to the compute nodes. It does not provision or
reconfigure switch hardware — you configure the switch (OSPF + iBGP) yourself beforehand
(see Before You Start). If a fabric is already configured, there is no Add fabric
switch button; use Fabric config on the dashboard to view or edit it (see 4.2.6).
You can add a Fabric Switch before you onboard your first node or after nodes already exist:
Before onboarding — the config sits pending, then applies automatically when a node is configured.
After nodes exist — it applies to the already-onboarded node(s) immediately.
Convergent across the cluster — every participating node converges to the same fabric config. You do not re-configure the fabric per node; onboard a new host and it joins automatically.
The apply is not a long blocking job — it streams progress live (server-sent events), so you watch each node move through it in real time.
Before You Start
Have these ready, or the wizard will fail at the final prerequisite step:
Your physical switch/router is already configured for OSPF + iBGP using the same ASN you will enter here. The last step (4.2.4) makes you confirm this.
One or more hosts are onboarded and reachable on the underlay — see Karios Forge and Physical Networks.
Values to gather: underlay/management CIDR, BGP peering IP (route reflector or spine), the fabric ASN, the router-id base and prefix length, and the path MTU (jumbo
9000for VXLAN).An administrator role — adding a Fabric Switch is an admin action.
Quick Start (Minimum Path)
About 10-15 minutes:
Add fabric switch, enter the underlay and sizing, thenCheck preflight(4.2.1).Continue to fabric details, fill the plan inputs, thenGenerate plan(4.2.2-4.2.3).Review the plan, accept the L3/BGP prerequisite, then
Configure fabric switch(4.2.4).Watch the rollout finish, then confirm fabric health on the dashboard (4.3).
4.2.1. Enter the Underlay and Sizing
Steps:
Open
Control Center -> Network -> SDN Fabric.Click
Add fabric switch.In
Underlay and sizing, enter the fields below.Click
Check preflight.
Field |
What it is |
Example |
|---|---|---|
|
Management/underlay CIDR the OSPF underlay runs over. |
|
|
Sizing hint, bounded by switch capacity. Not a hard cap. |
|
|
Expected tenant VM count, used to size the VTEP/VNI ranges. |
|
|
CIDR for the per-node VTEP loopbacks. Leave blank to use the planner default. |
|
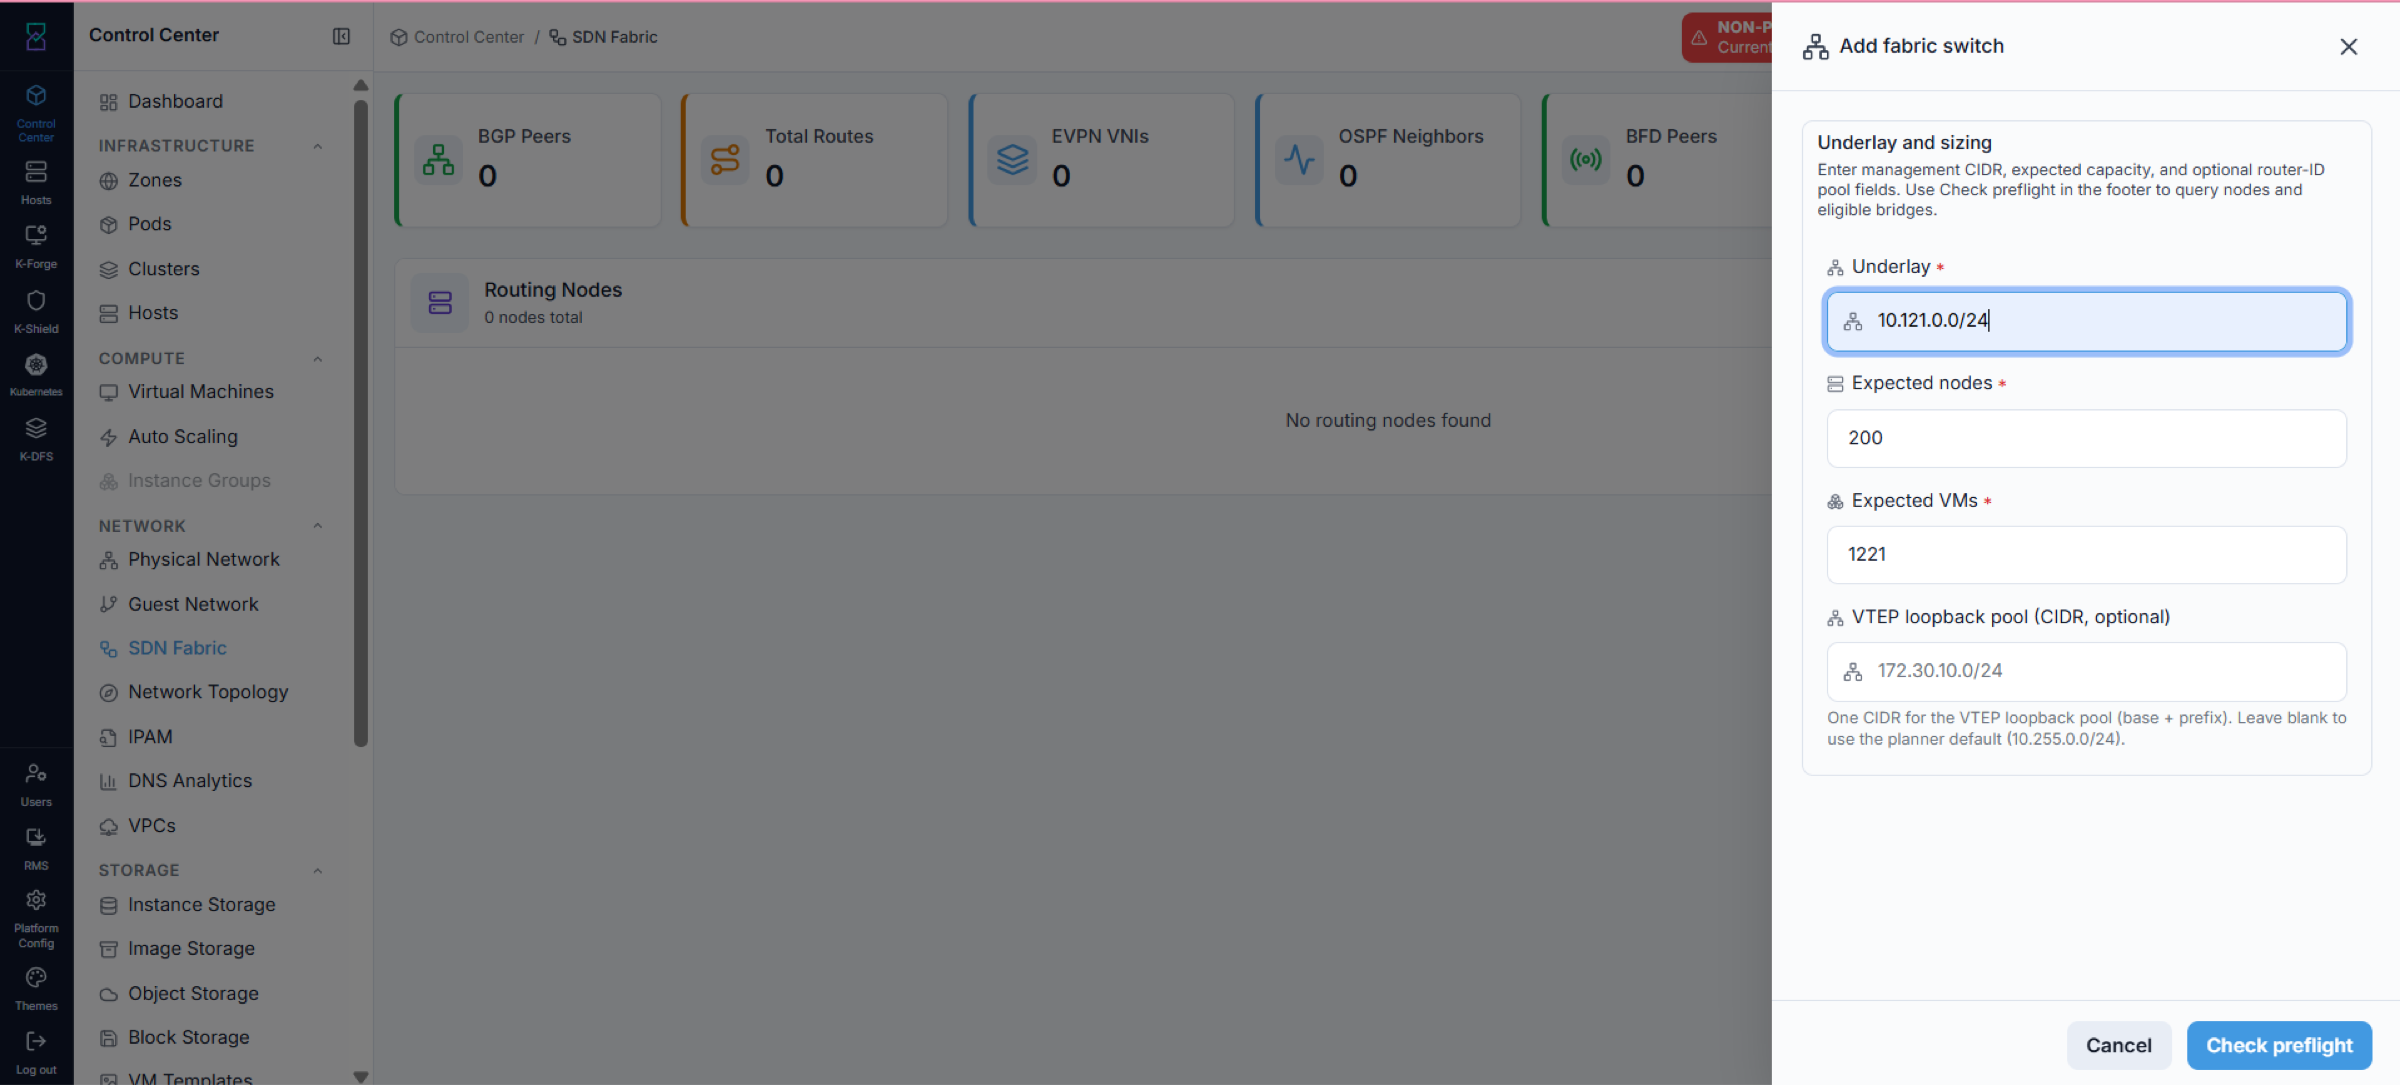
What it shows: the Underlay and sizing inputs. Click Check preflight to validate
the underlay before continuing.
4.2.2. Run the Underlay Preflight
Purpose:
Confirm the underlay CIDR is actually present on a node’s fabric interface (bridge) before you enter the rest of the plan.
Important
Preflight is a hard gate. Until it passes, Continue to fabric details and
Configure fabric switch stay disabled — so the fabric cannot be configured, and the
VXLAN guest networks, VMs, and VPCs that depend on it cannot be created (see 4.6). Get
preflight green first; everything else is blocked behind it.
Steps:
Review the
OSPF fabric interface(bridge) the cluster pre-selected.Read the preflight result.
If it passed, click
Continue to fabric details.
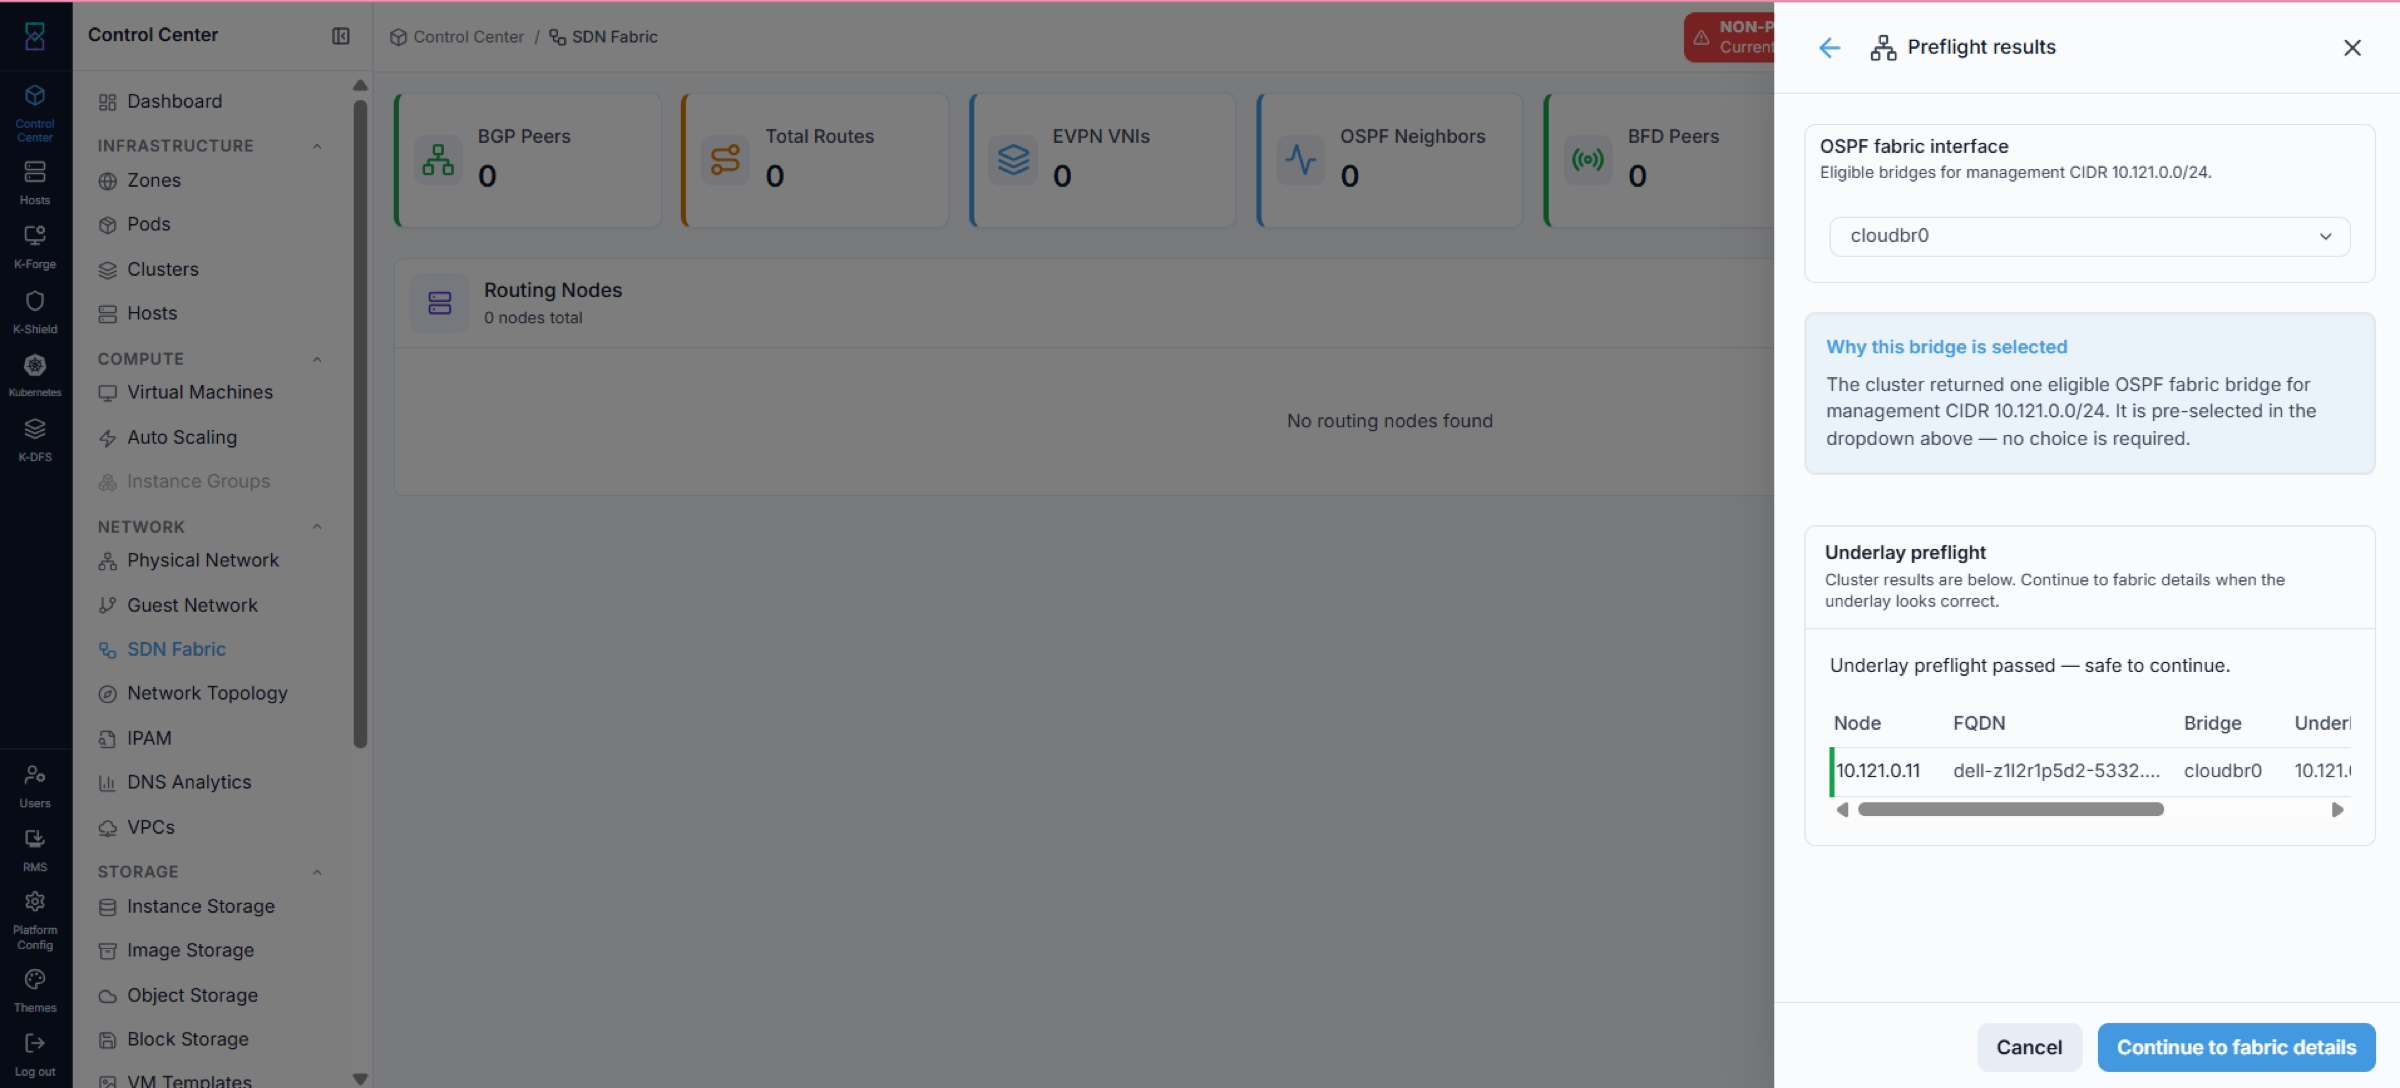
What it shows: a passed preflight. The eligible OSPF bridge (for example
cloudbr0) is pre-selected — no choice is required — and the matched node is listed.
Continue to fabric details is enabled.
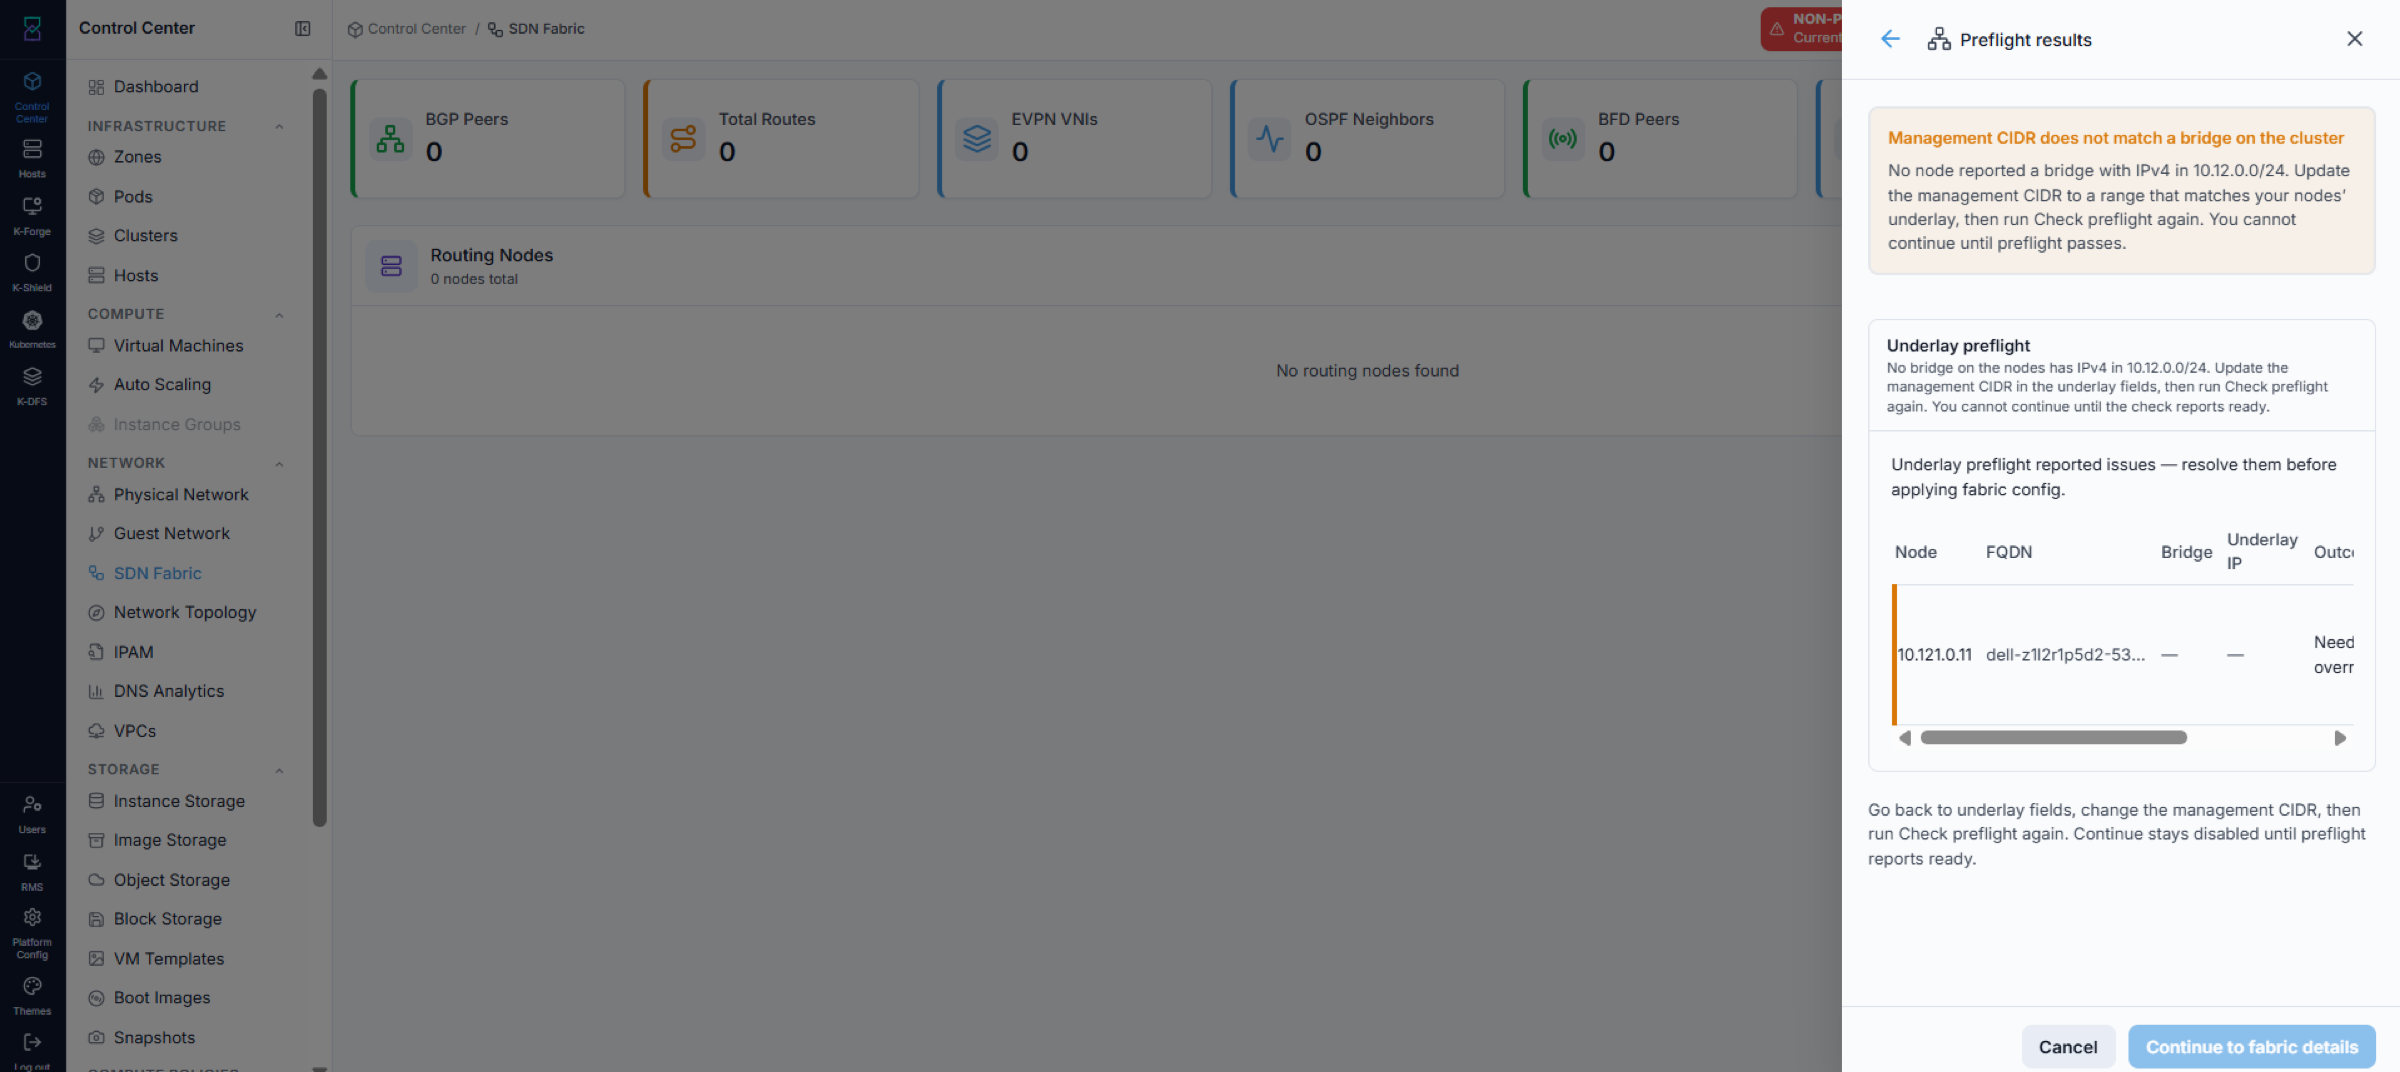
What it shows: a failed preflight. The management CIDR does not match a bridge on the
cluster, so the issues must be resolved first; Continue to fabric details stays
disabled.
Expected Outcome:
Preflight passes, the OSPF bridge is locked in, and
Continue to fabric detailsbecomes available.
After preflight passes, click Continue to fabric details to open the Plan inputs
form, then continue with 4.2.3 below. (For the full end-to-end sequence, see the Quick
Start above.)
If this fails:
Go back to the underlay field, correct the underlay/management CIDR, and click
Check preflightagain.If the MTU is too small, the fabric raises a
Switch MTU change requireddialog — resolve it as described below, then re-run the preflight.
VXLAN needs jumbo frames end-to-end. If the path MTU is too small, the fabric shows a
Switch MTU change required dialog:
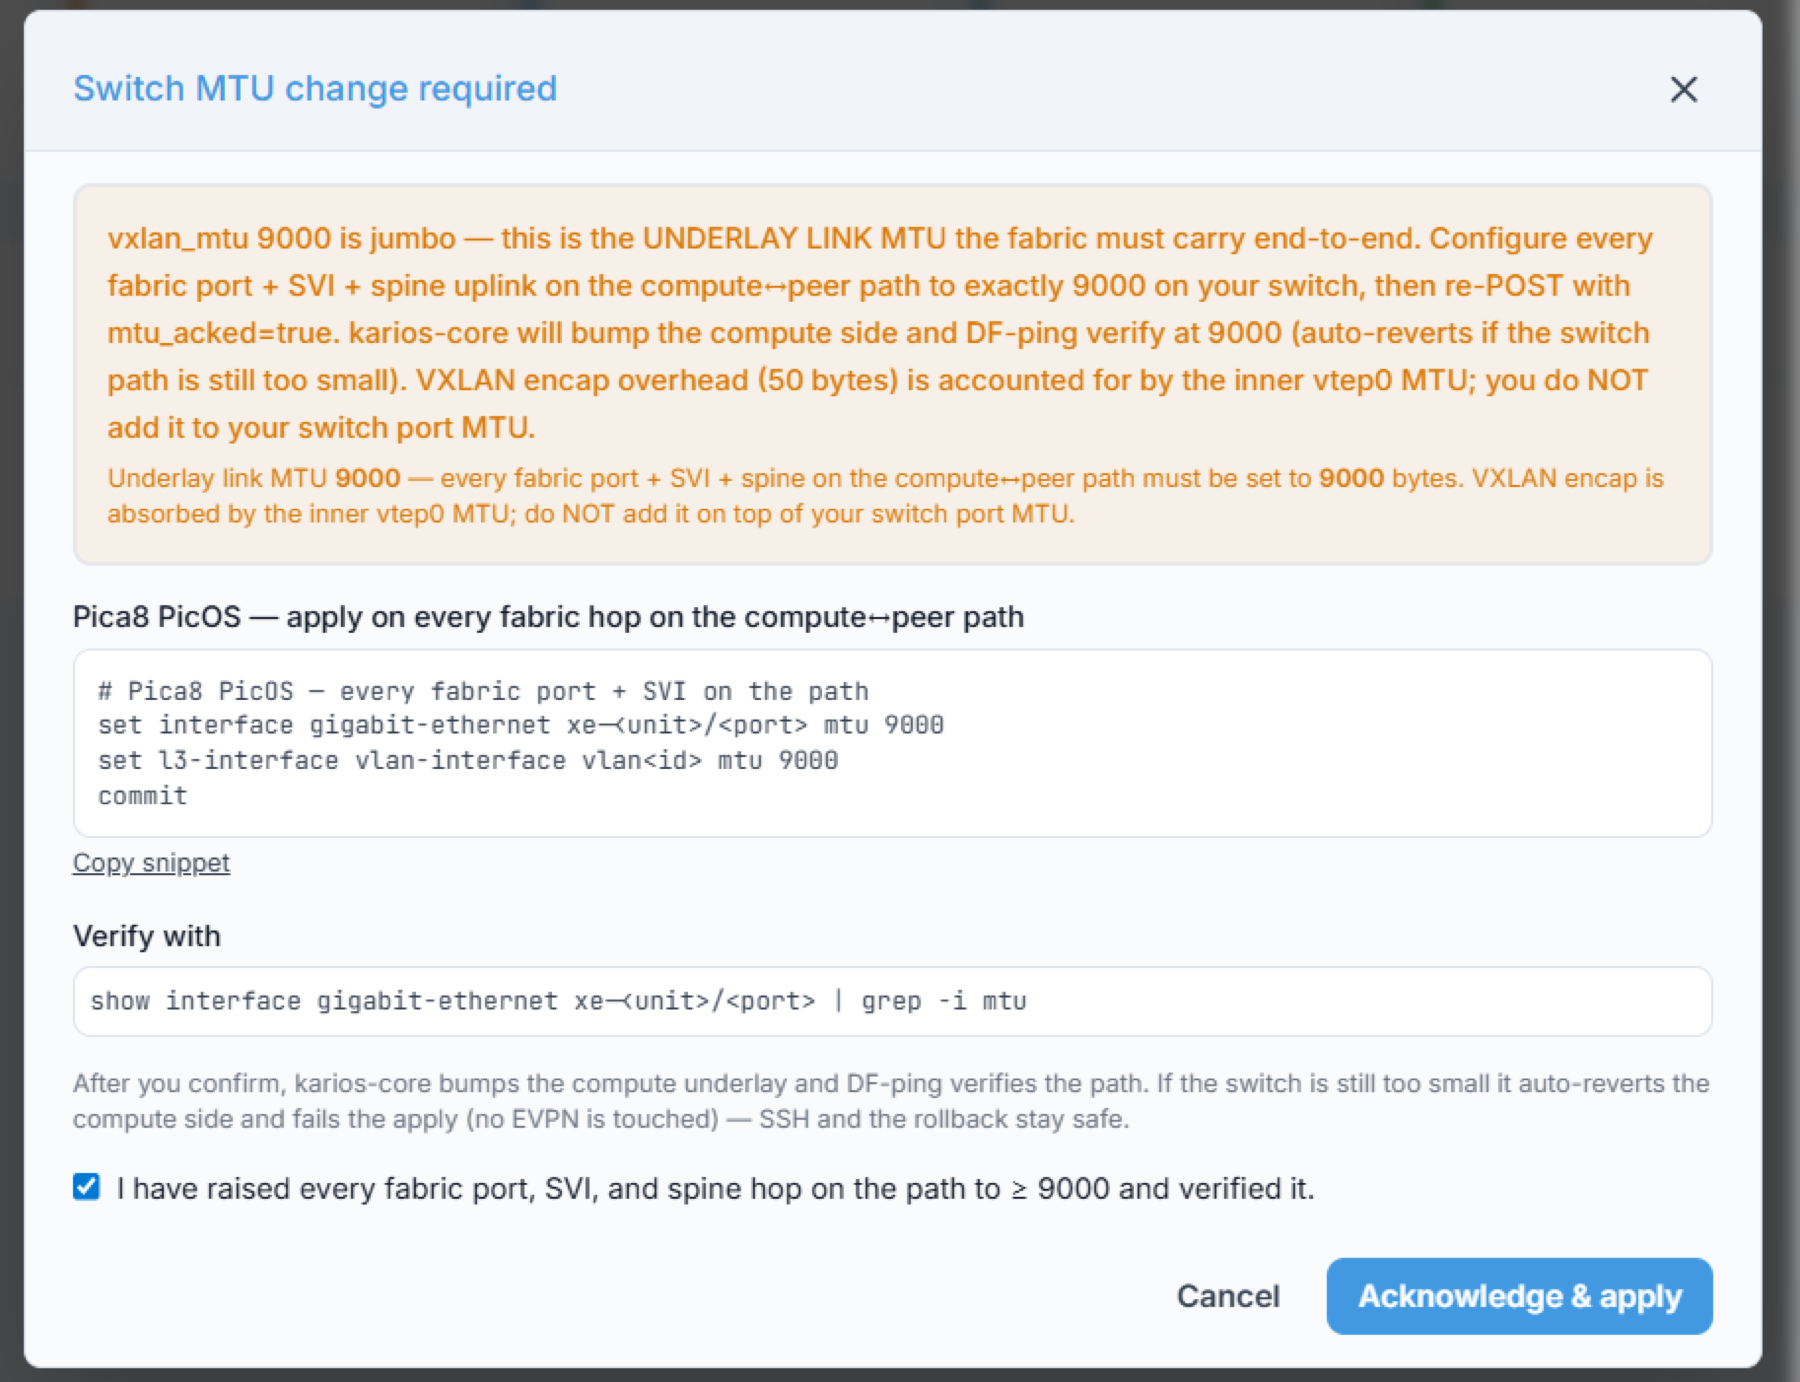
What it shows: the underlay link MTU must be 9000 on every fabric port, SVI, and spine
uplink along the compute-to-peer path. Apply the per-switch commands shown (use Copy
snippet), verify with the given show interface command, then tick the confirmation
box and click Acknowledge & apply. Karios then bumps the compute underlay and
DF-pings to verify before continuing.
4.2.3. Enter the Plan Inputs
Purpose:
Provide the switch identity, addressing, MTUs, and BGP details, then generate the plan.
This form opens right after you click Continue to fabric details in the preflight
step. Fill in the fields below, then click Generate plan to move to the review stage
(4.2.4).
Field |
What it is |
Example |
|---|---|---|
|
Name of the fabric switch being configured. |
|
|
|
|
|
The switch network OS. |
|
|
The BGP peer (route reflector / spine) address. Validated as a real IP. |
|
|
The switch BGP AS number. Must equal the Local AS — Karios is iBGP. |
|
|
The fabric AS used by the nodes. |
|
|
CIDR the per-node VTEP loopbacks are derived from. |
|
|
Locked to the cluster underlay set at install time. Not editable here. |
|
|
MTU for the data-center interconnect / public path. |
|
|
The cloud bridge OSPF runs on (the bridge confirmed by preflight). |
|
|
Optional TCP-MD5 BGP authentication. Leave blank for none. |
(blank) |
|
Underlay authentication: |
|
Warning
iBGP rule: the Fabric switch AS and Local AS must be the same. Karios shares
one loopback for both BGP peering and the VXLAN tunnel endpoint, so eBGP would not
propagate EVPN routes. The form rejects mismatched ASNs.
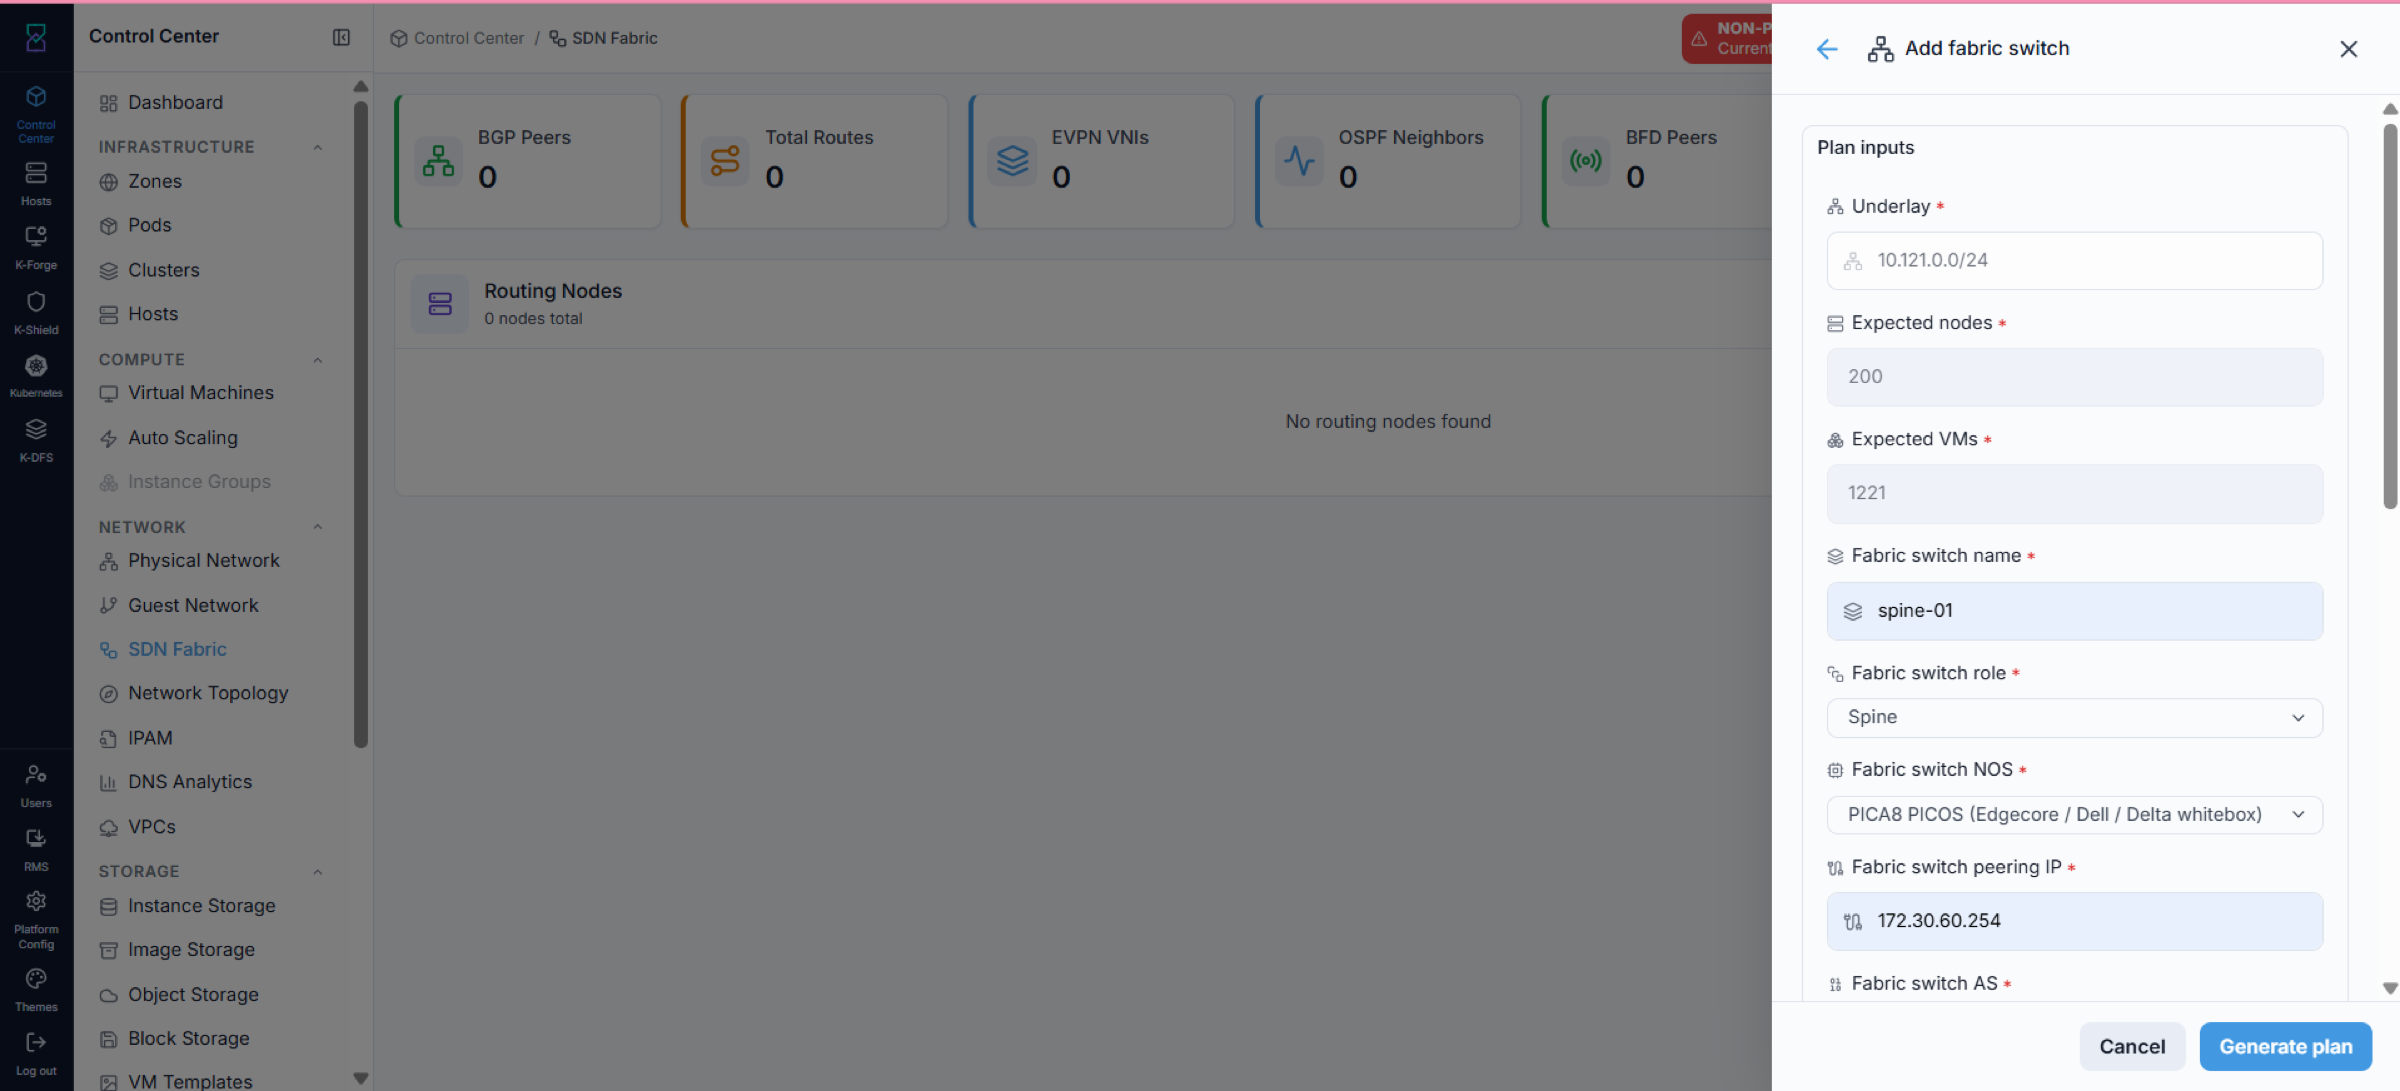
What it shows: identity and addressing — Underlay, Expected nodes / Expected
VMs (carried from 4.2.1), Fabric switch name, role, NOS, and peering IP.
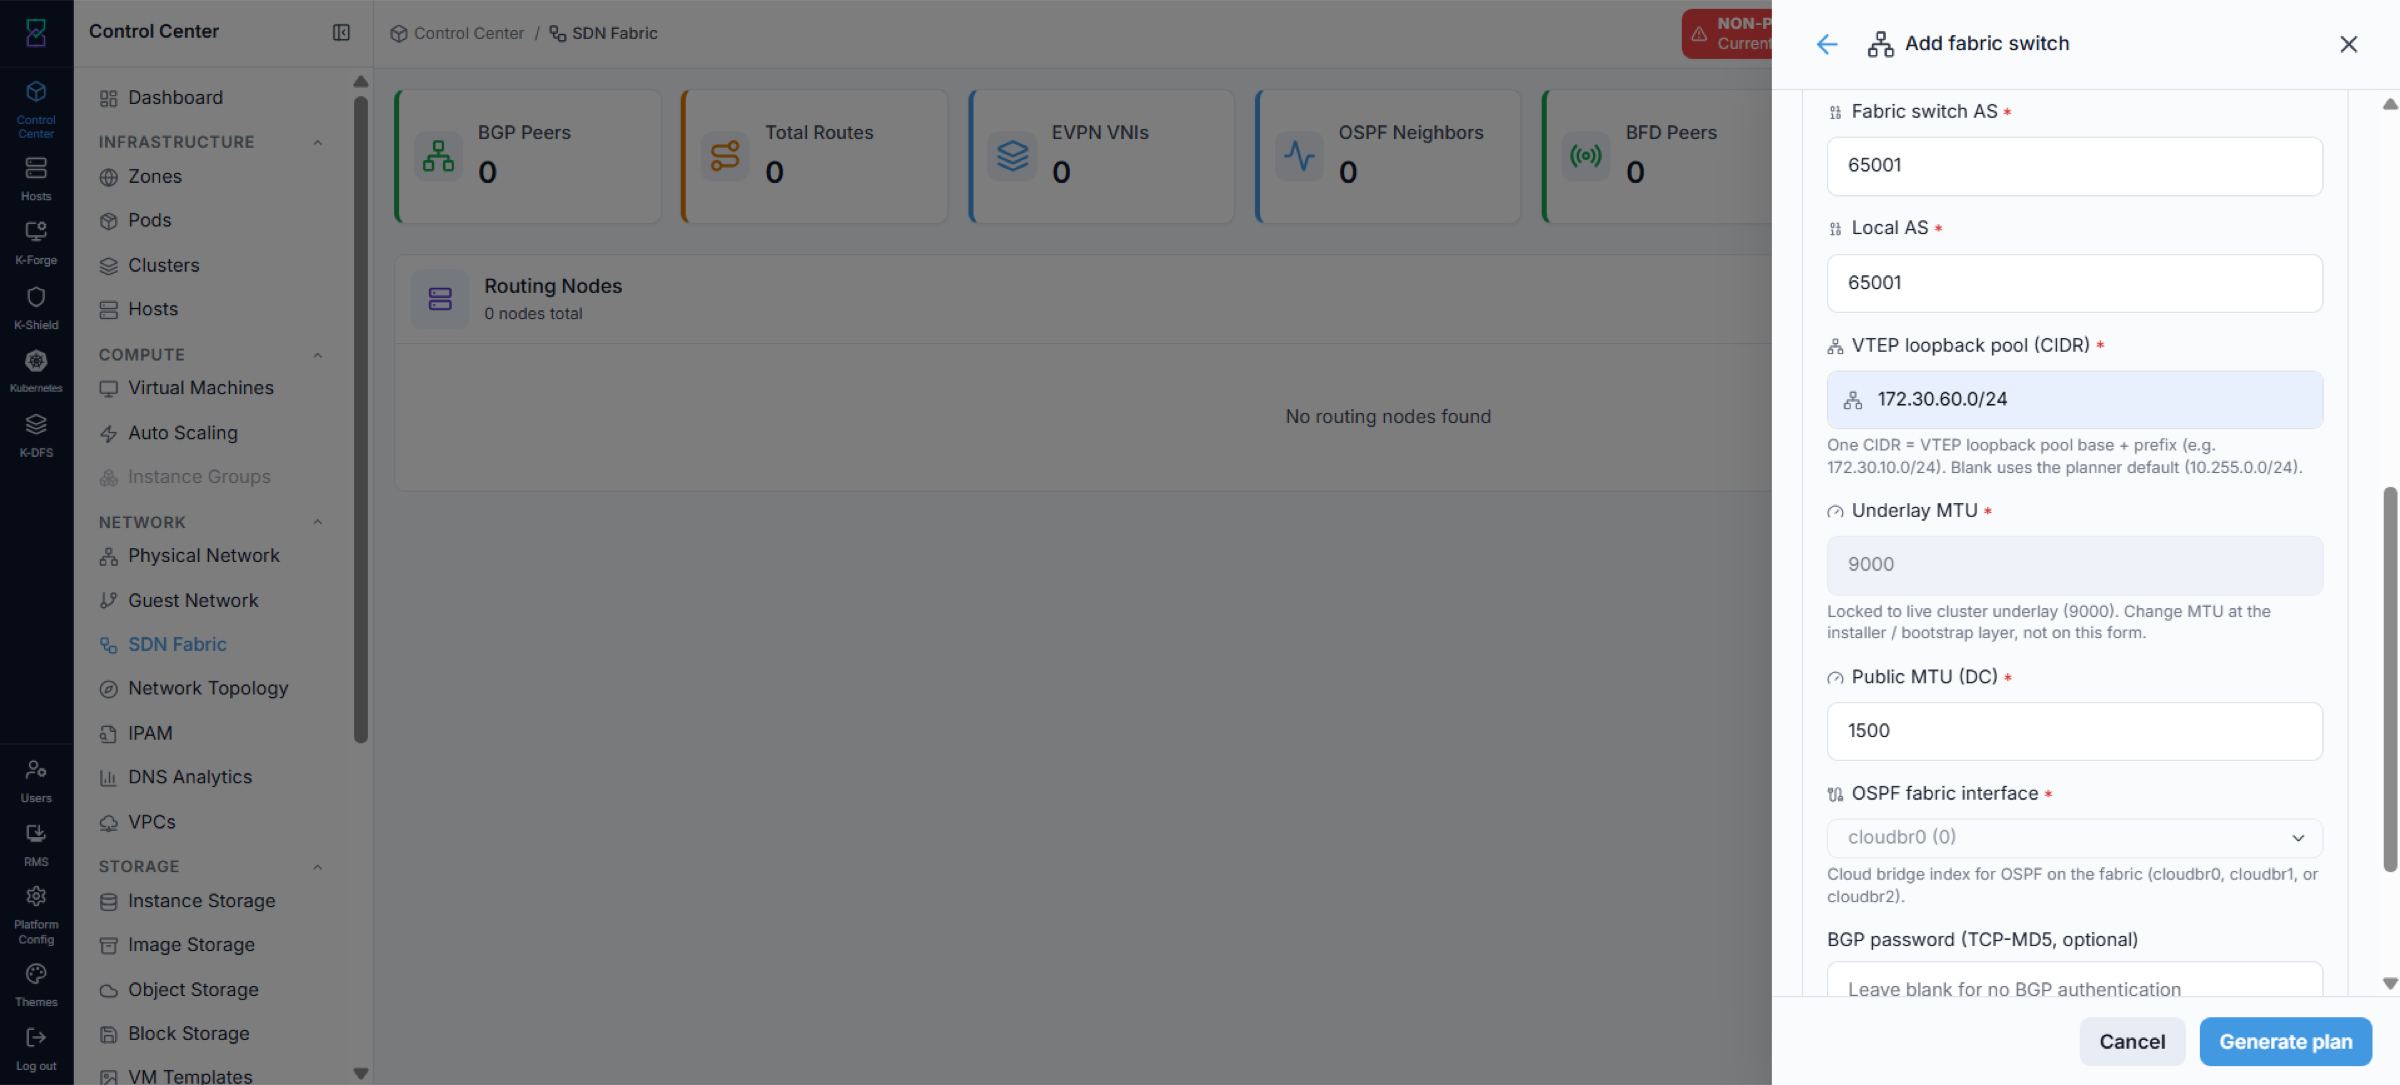
What it shows: Fabric switch AS and Local AS, the VTEP loopback pool,
Underlay MTU (locked), Public MTU (DCI), the OSPF fabric interface, and the
optional BGP password.
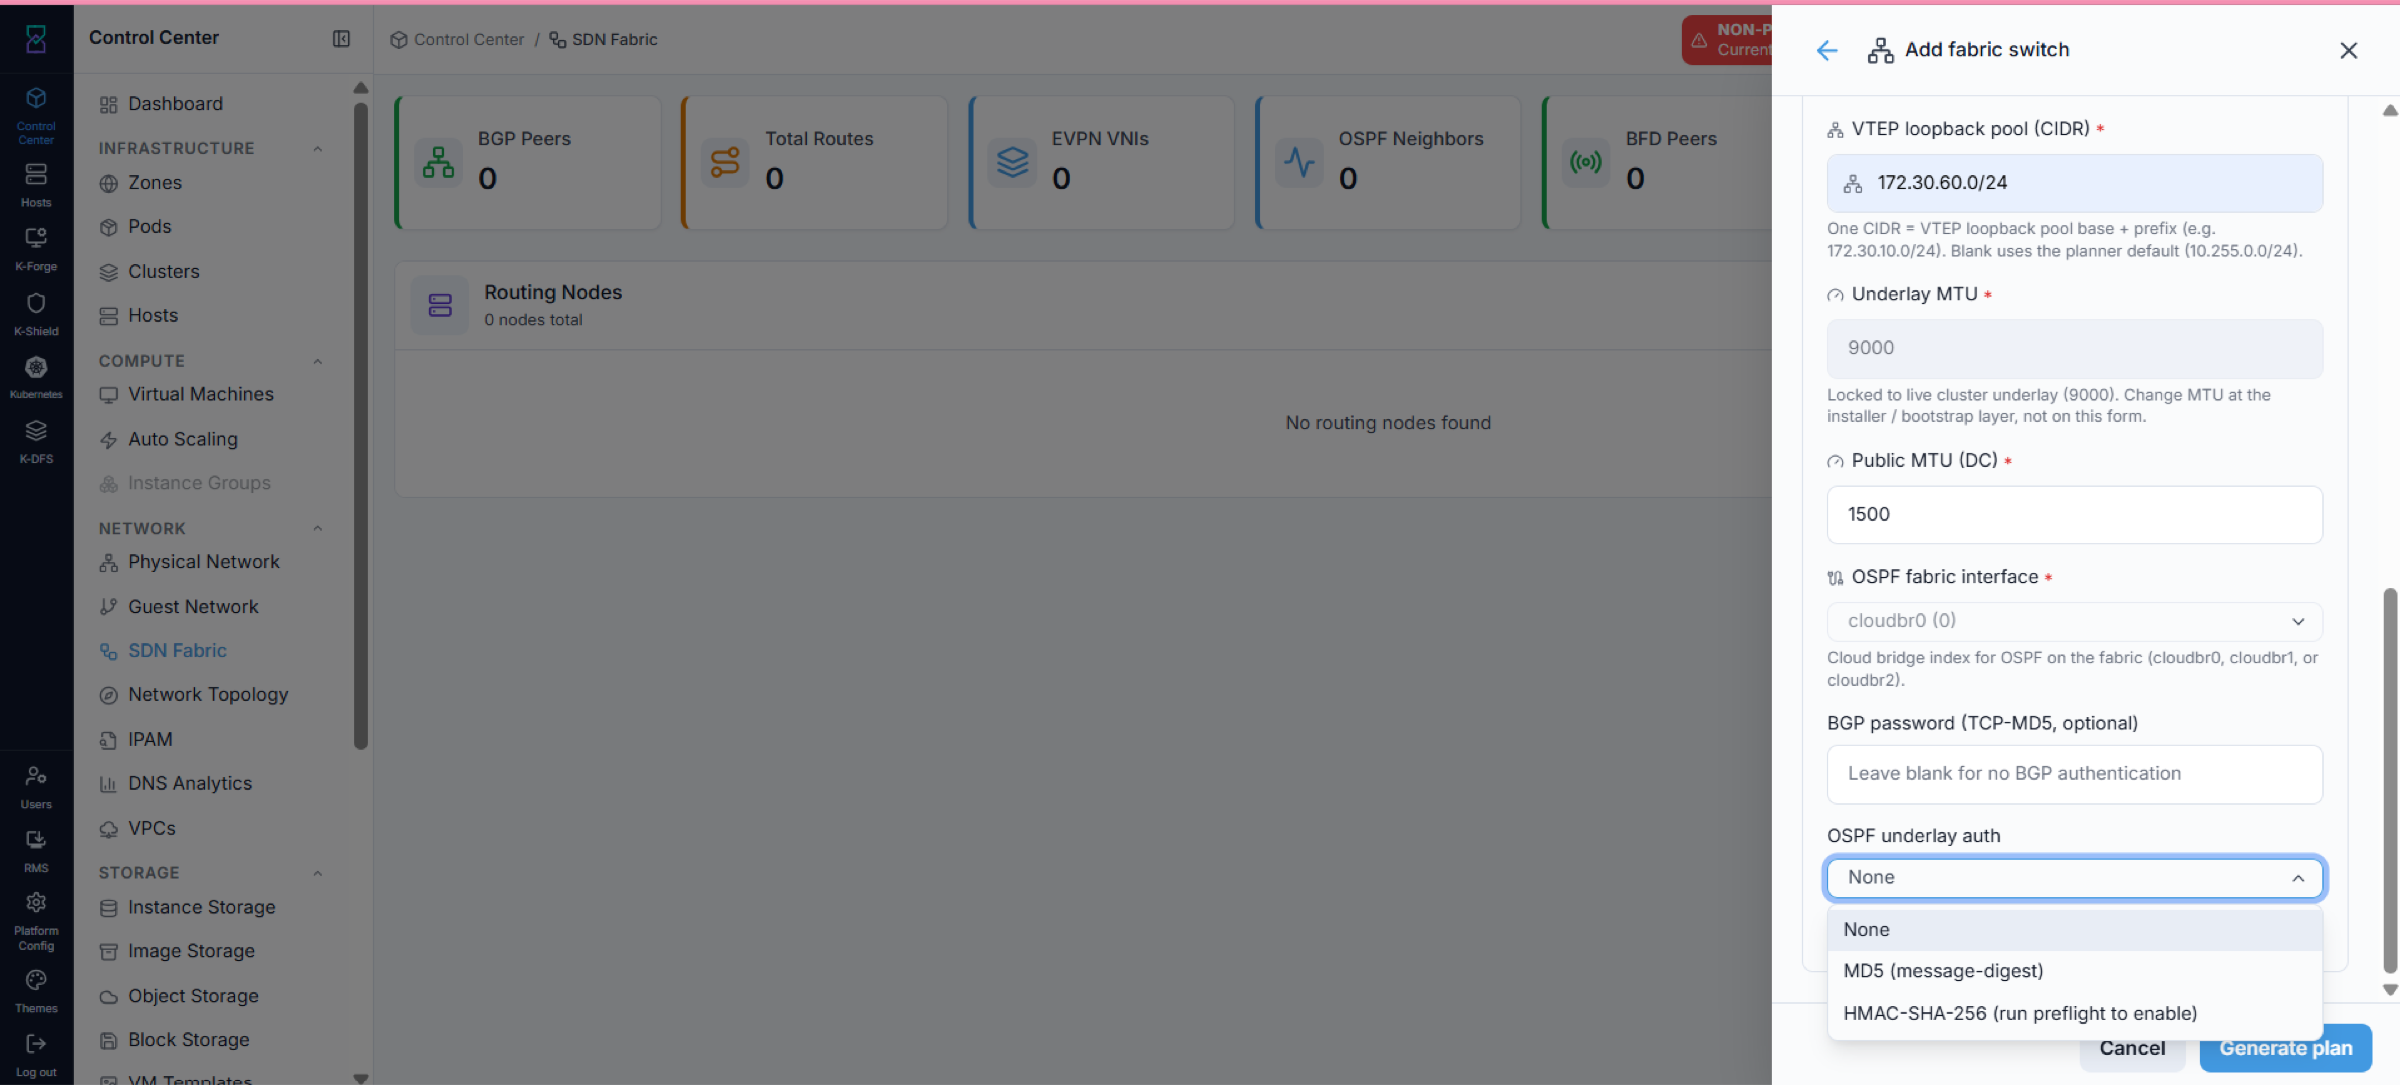
What it shows: the OSPF underlay auth choice (None / MD5 / HMAC-SHA-256).
When the fields are complete, click Generate plan.
4.2.4. Review the Plan and Confirm Prerequisites
Purpose:
Review the derived plan, its embedded preflight, the generated switch config, and accept the L3/BGP prerequisite before applying.
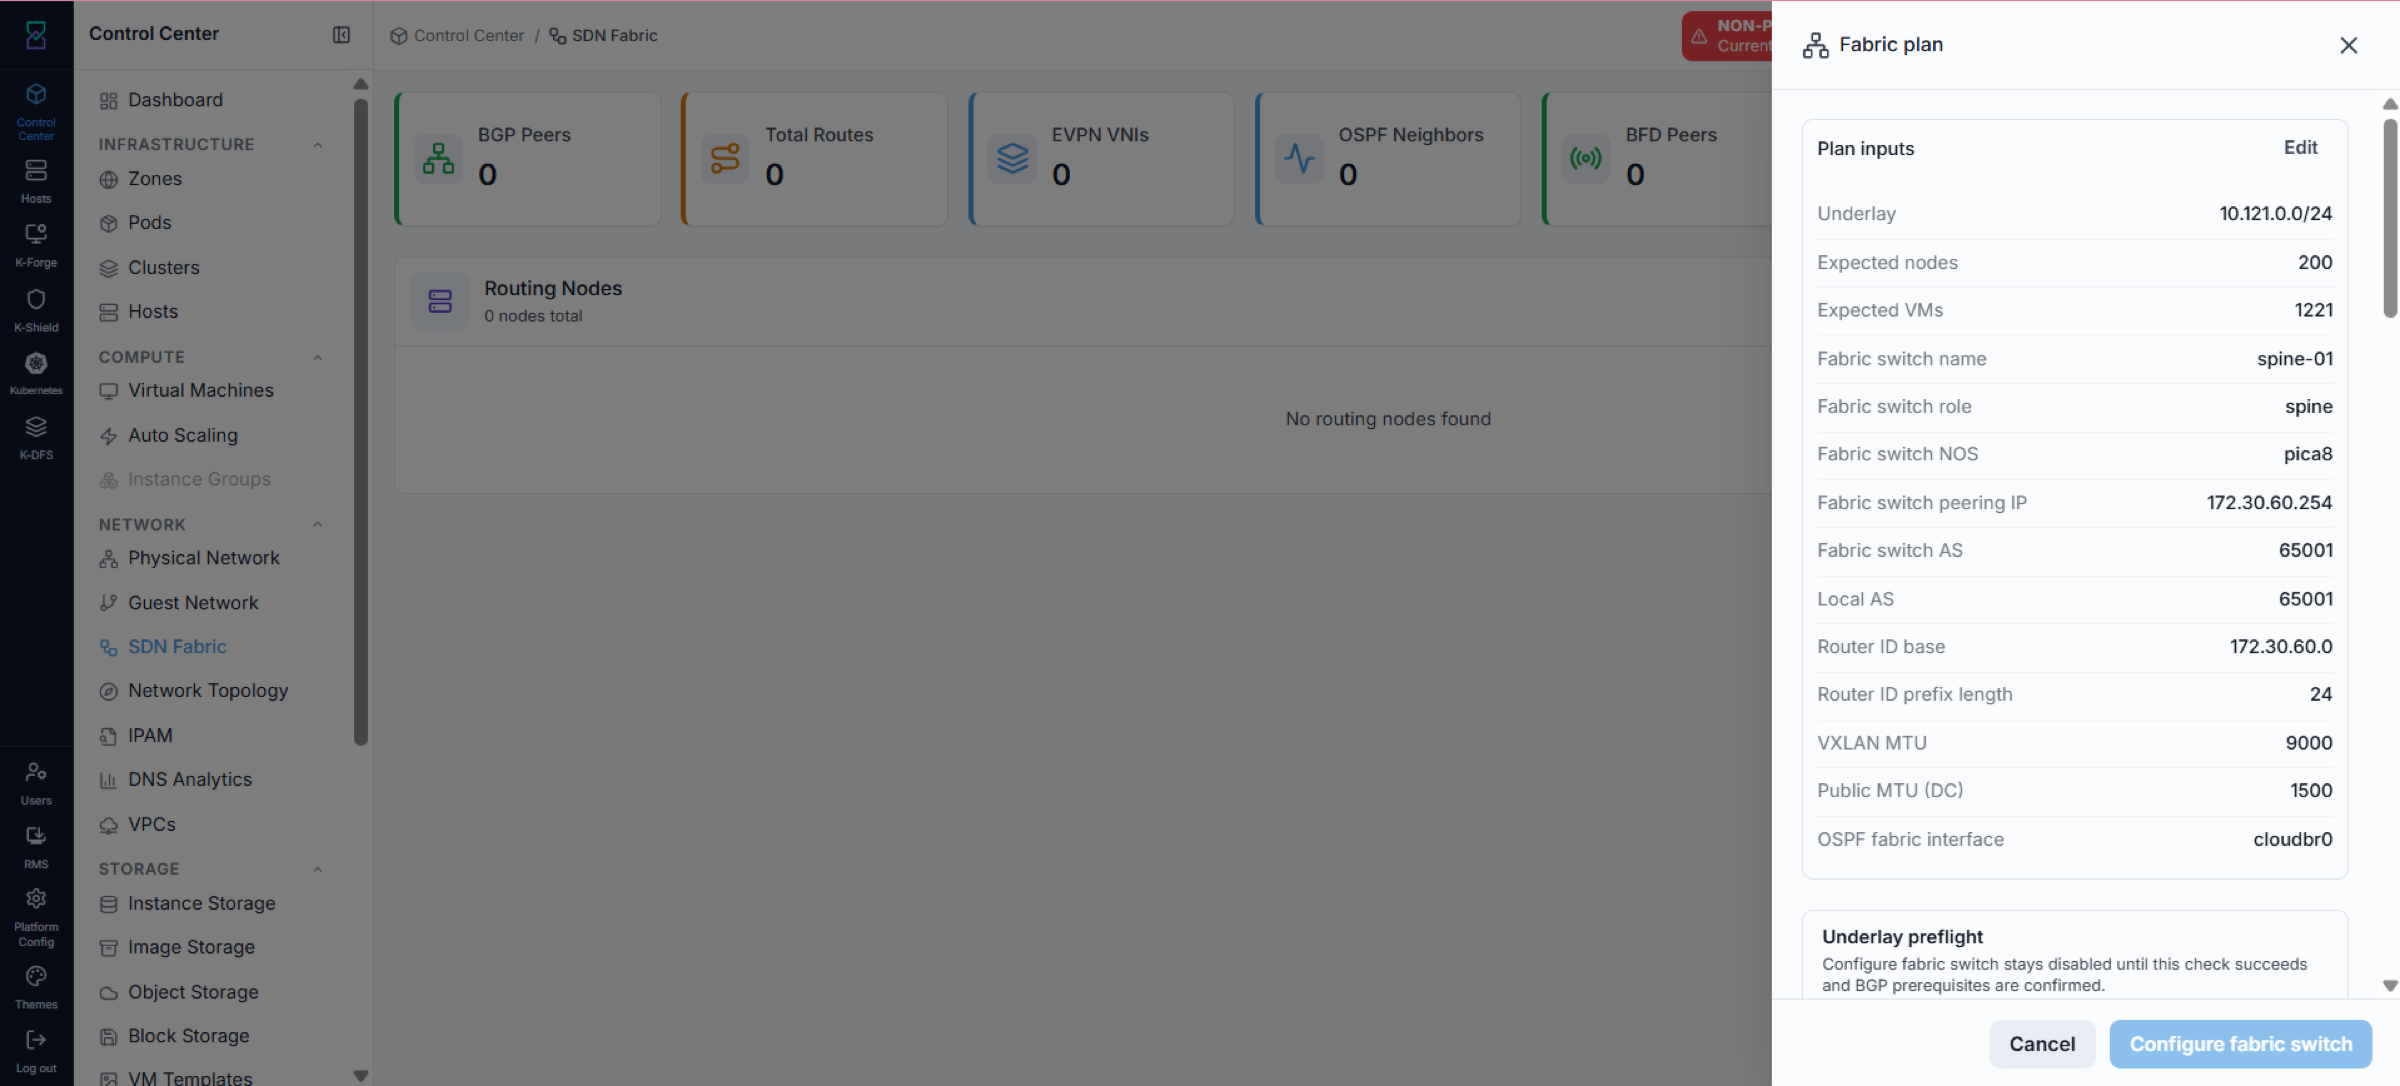
What it shows: the derived plan (names, AS, router-id base/prefix, MTUs, OSPF interface).
Use Edit to change any input. Configure fabric switch stays disabled until the
underlay preflight succeeds.
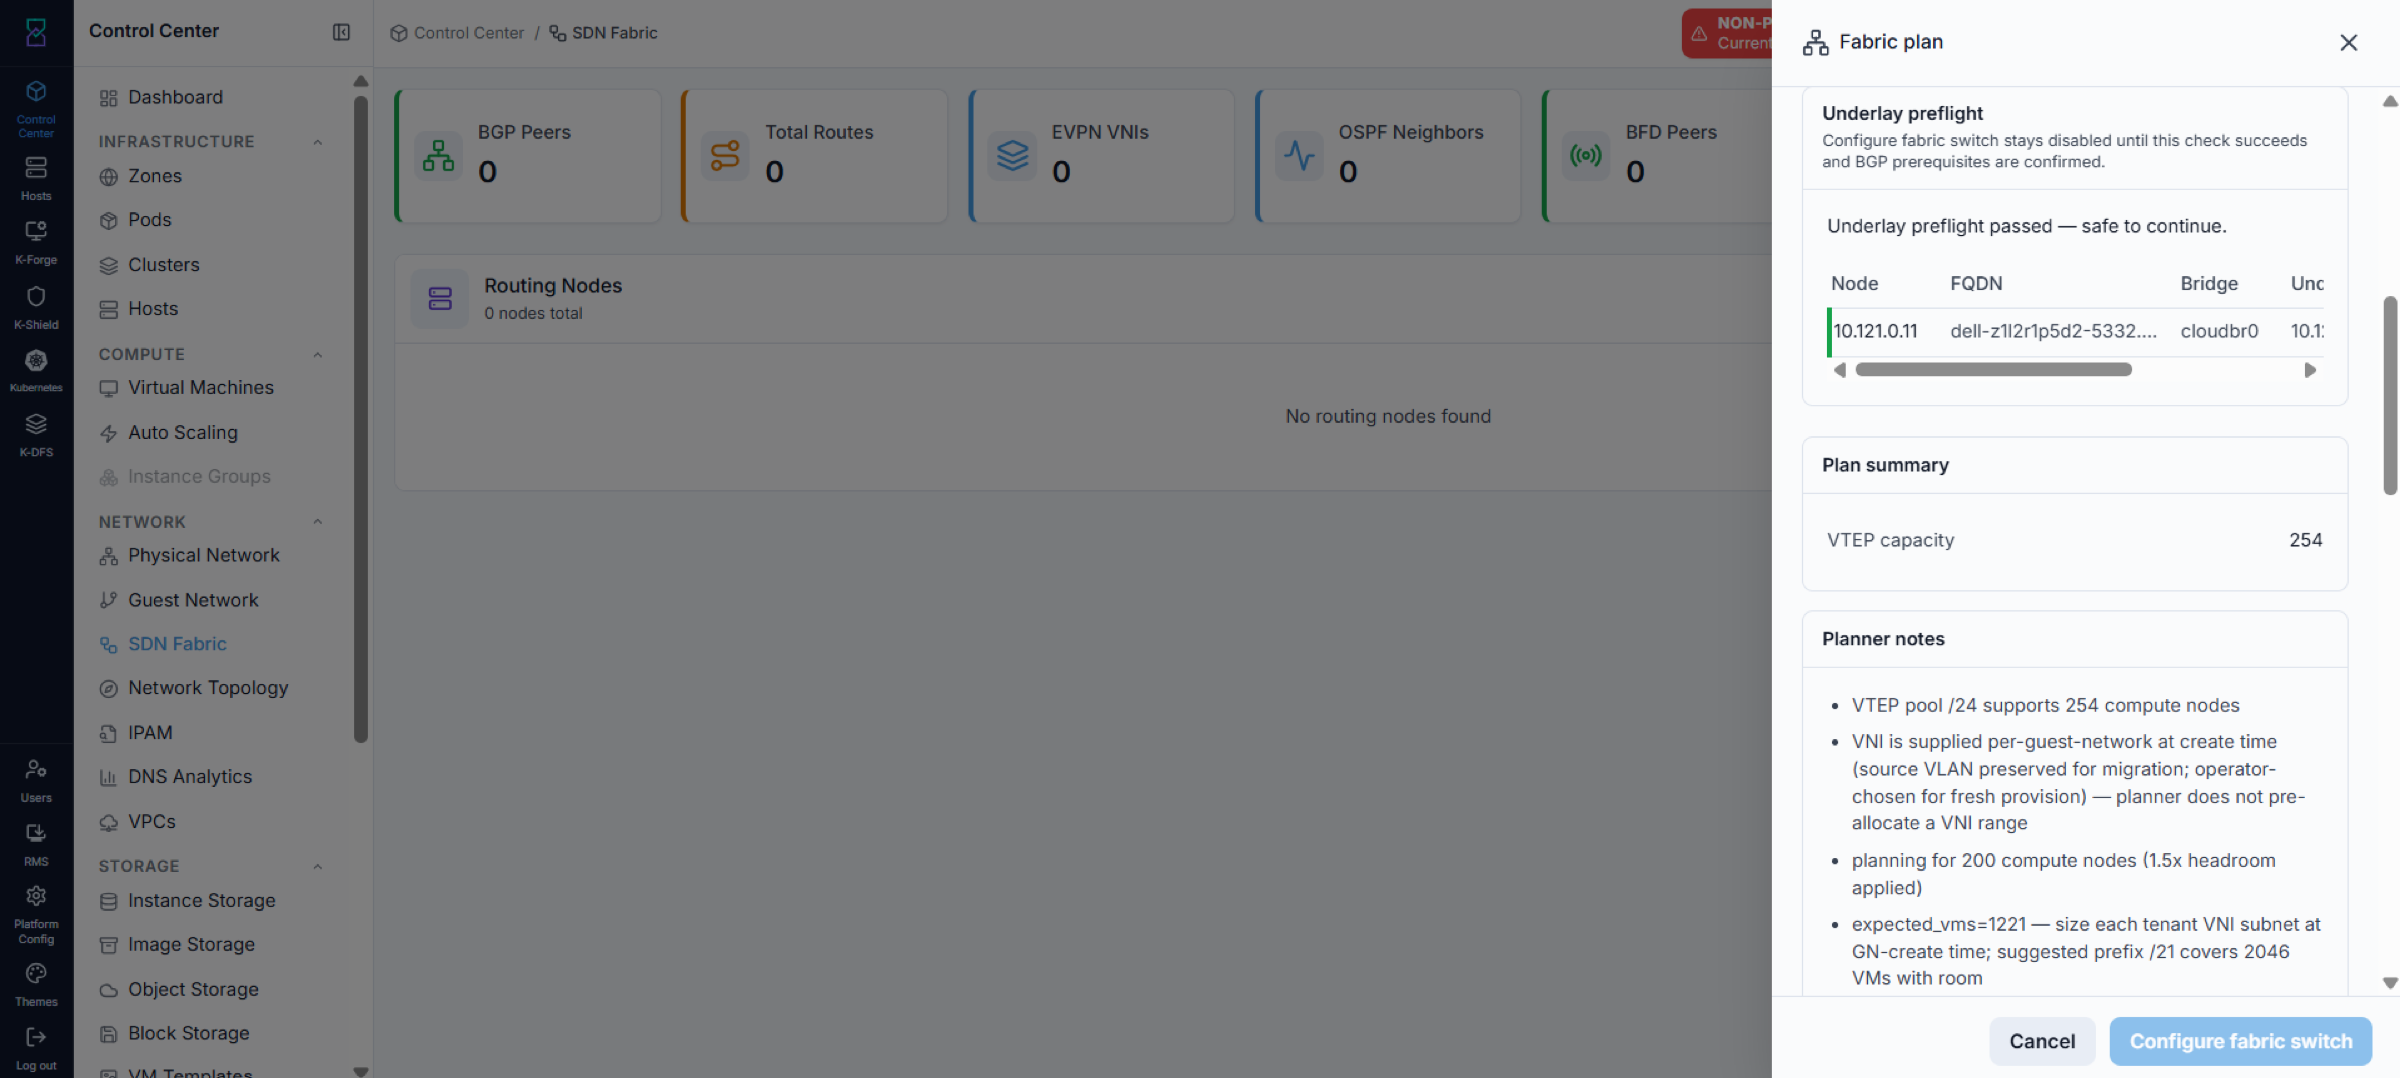
What it shows: the underlay preflight result, the plan summary (for example VTEP capacity), and planner notes.
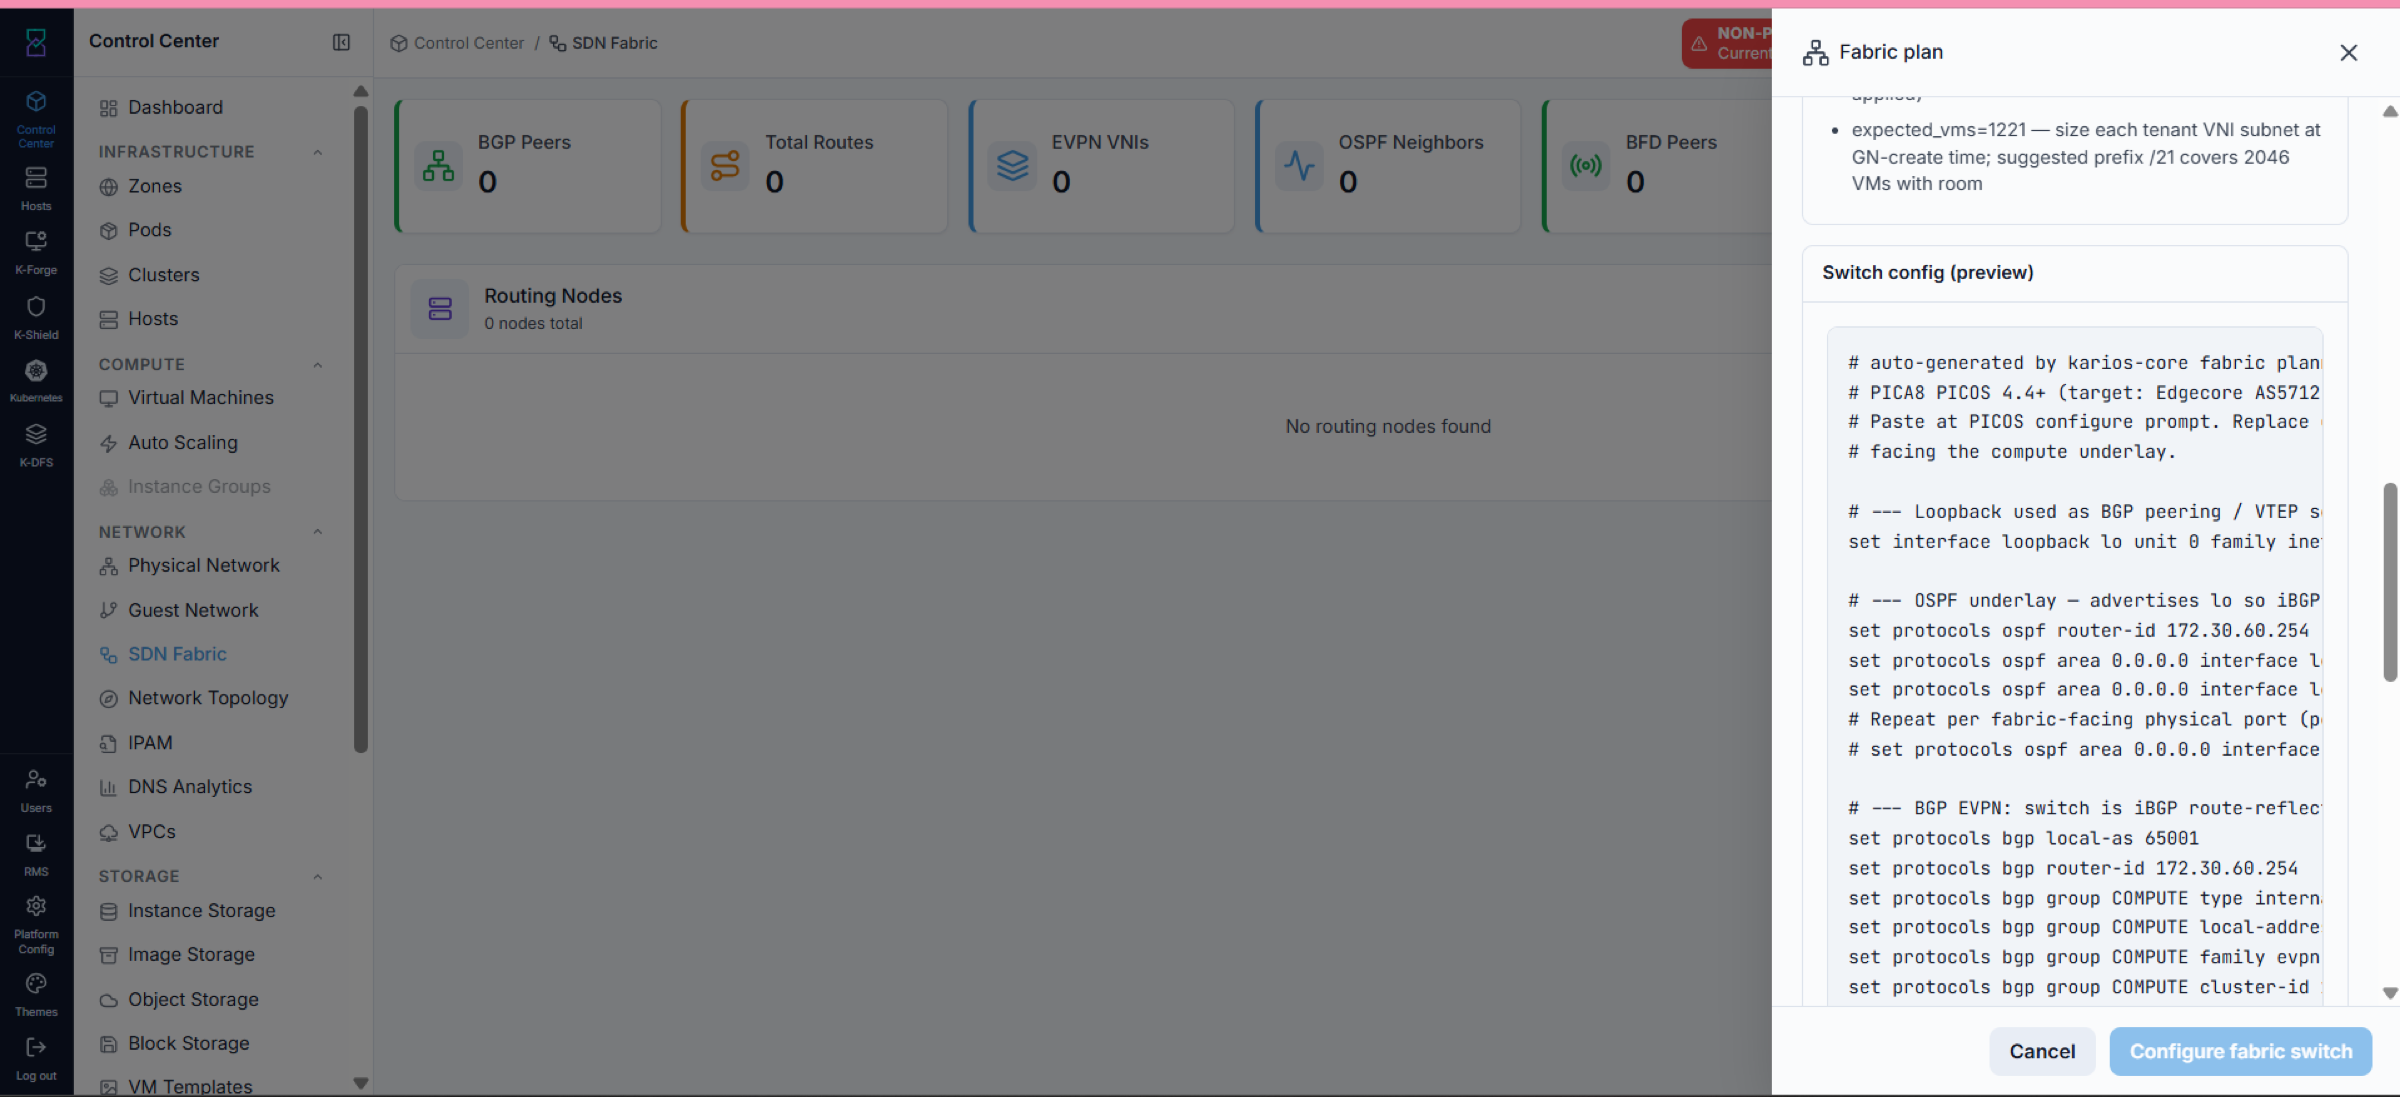
What it shows: the auto-generated FRR switch config — a read-only preview of what will be applied.
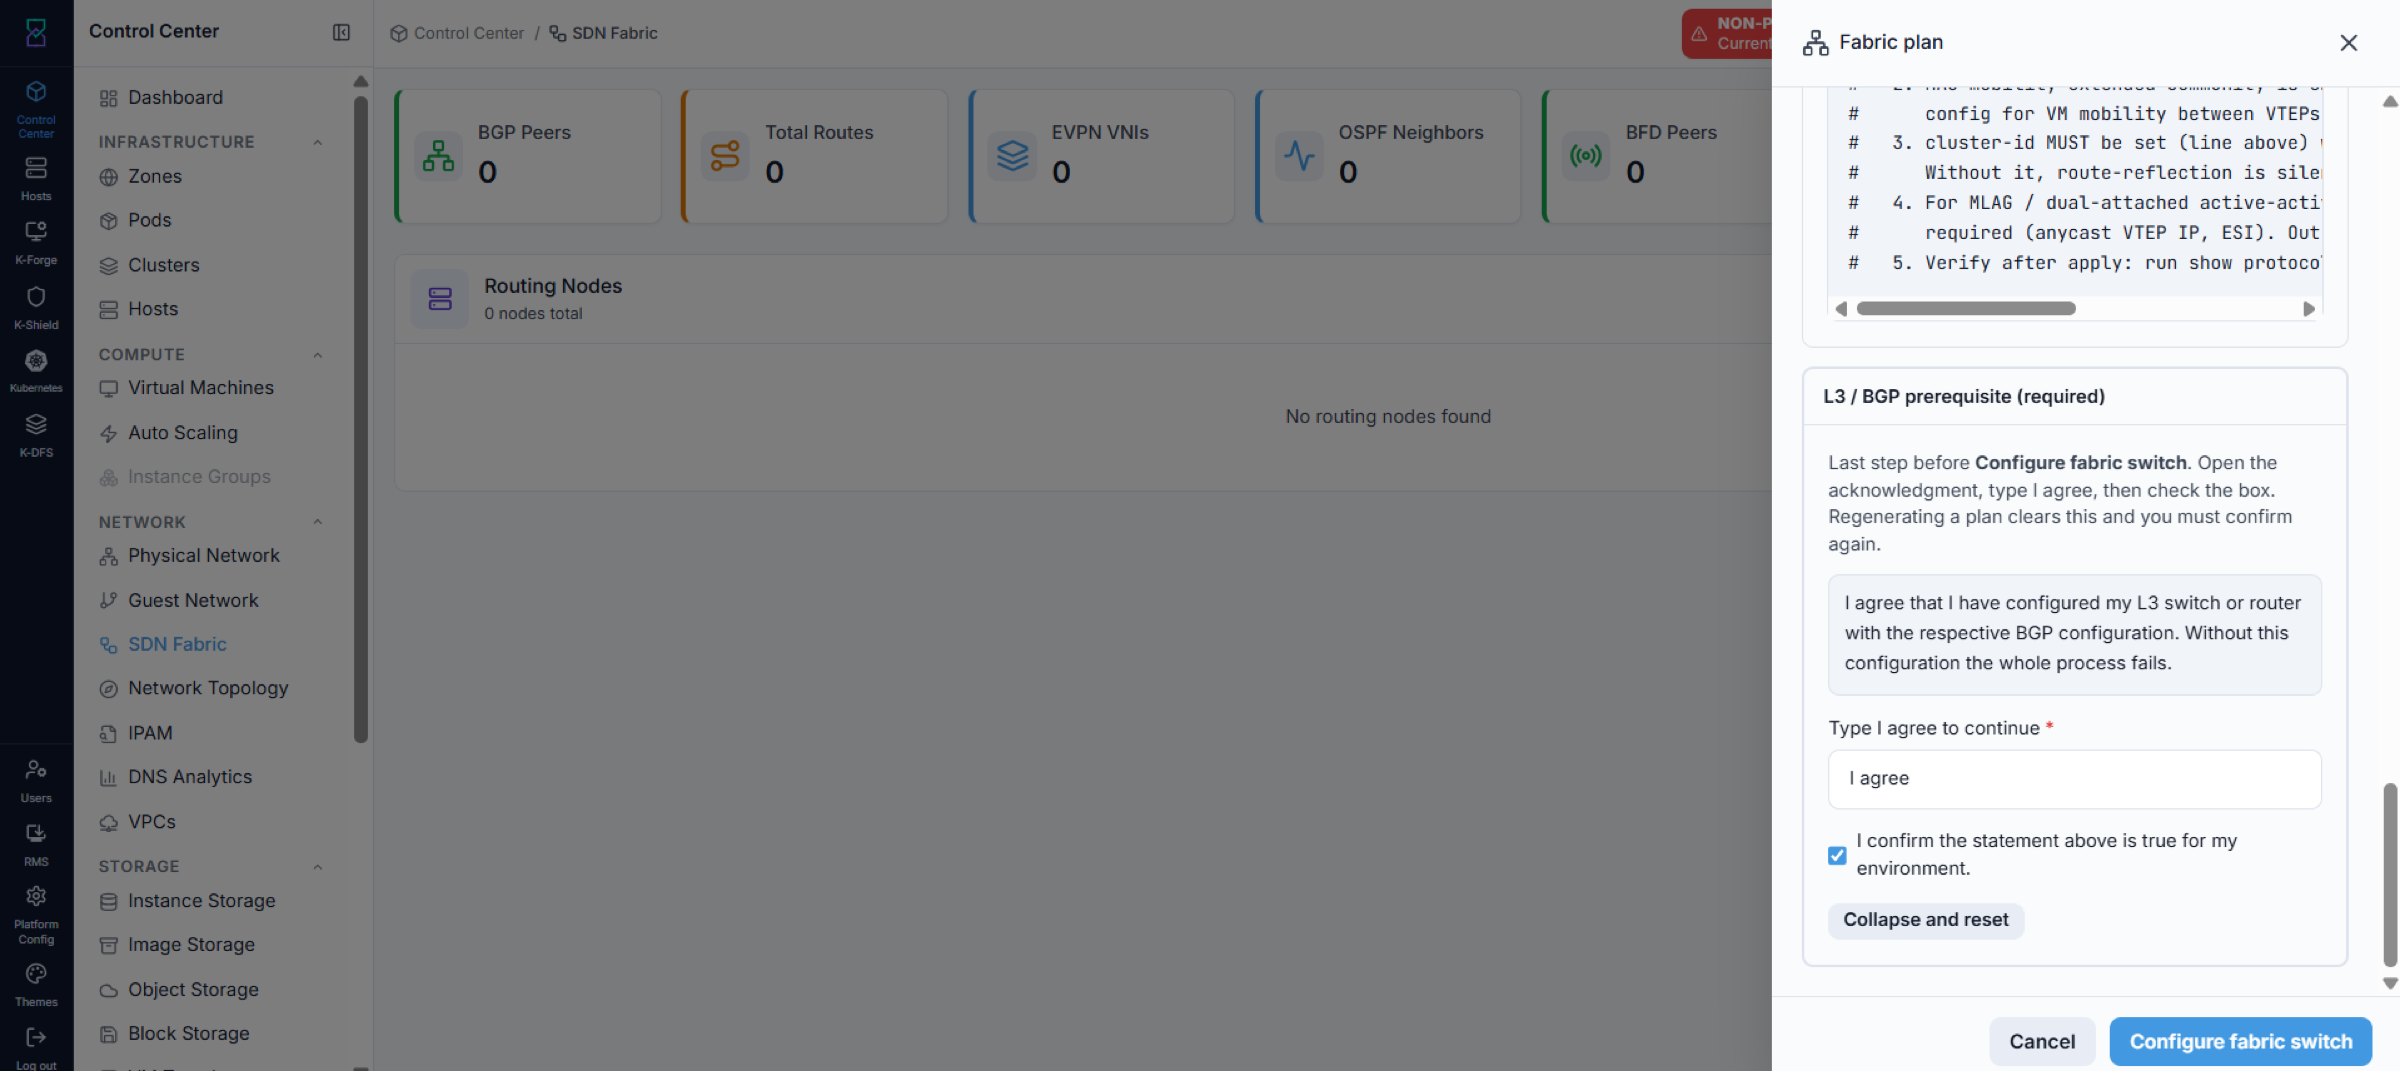
What it shows: the required acknowledgement that your L3 switch/router already has the
matching BGP configuration. Type I agree, tick the confirmation box, then click
Configure fabric switch.
4.2.5. Apply and Watch the Rollout
Steps:
Click
Configure fabric switchto start the rollout.Watch each node’s progress stream live in the rollout panel.
When every participating node finishes, the fabric is ready.
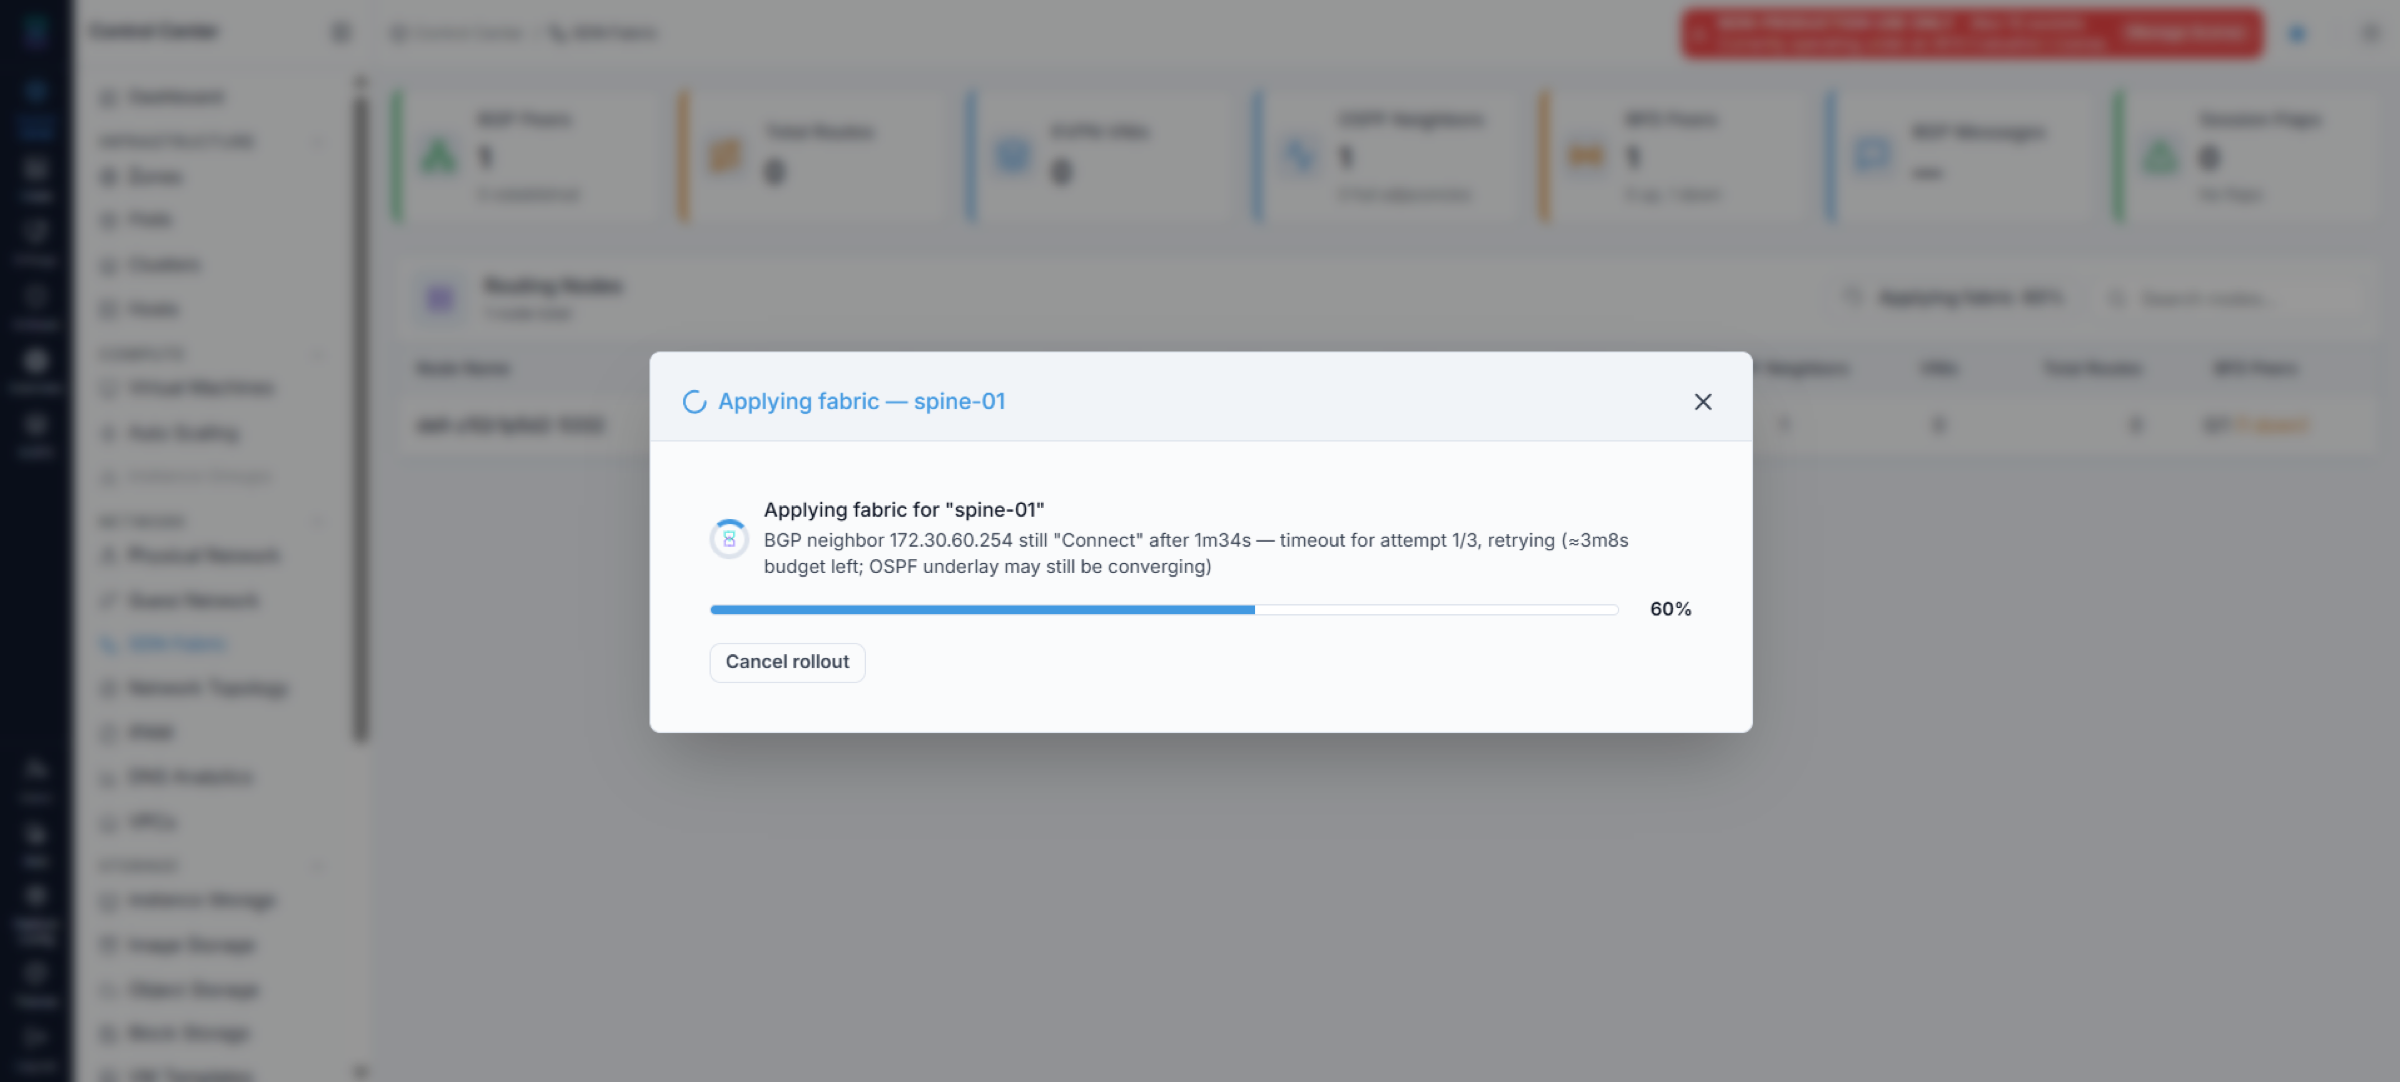
What it shows: the live apply for a node, including BGP/OSPF convergence (a peer may sit
in Connect and retry while the underlay converges). Use Cancel rollout to stop.
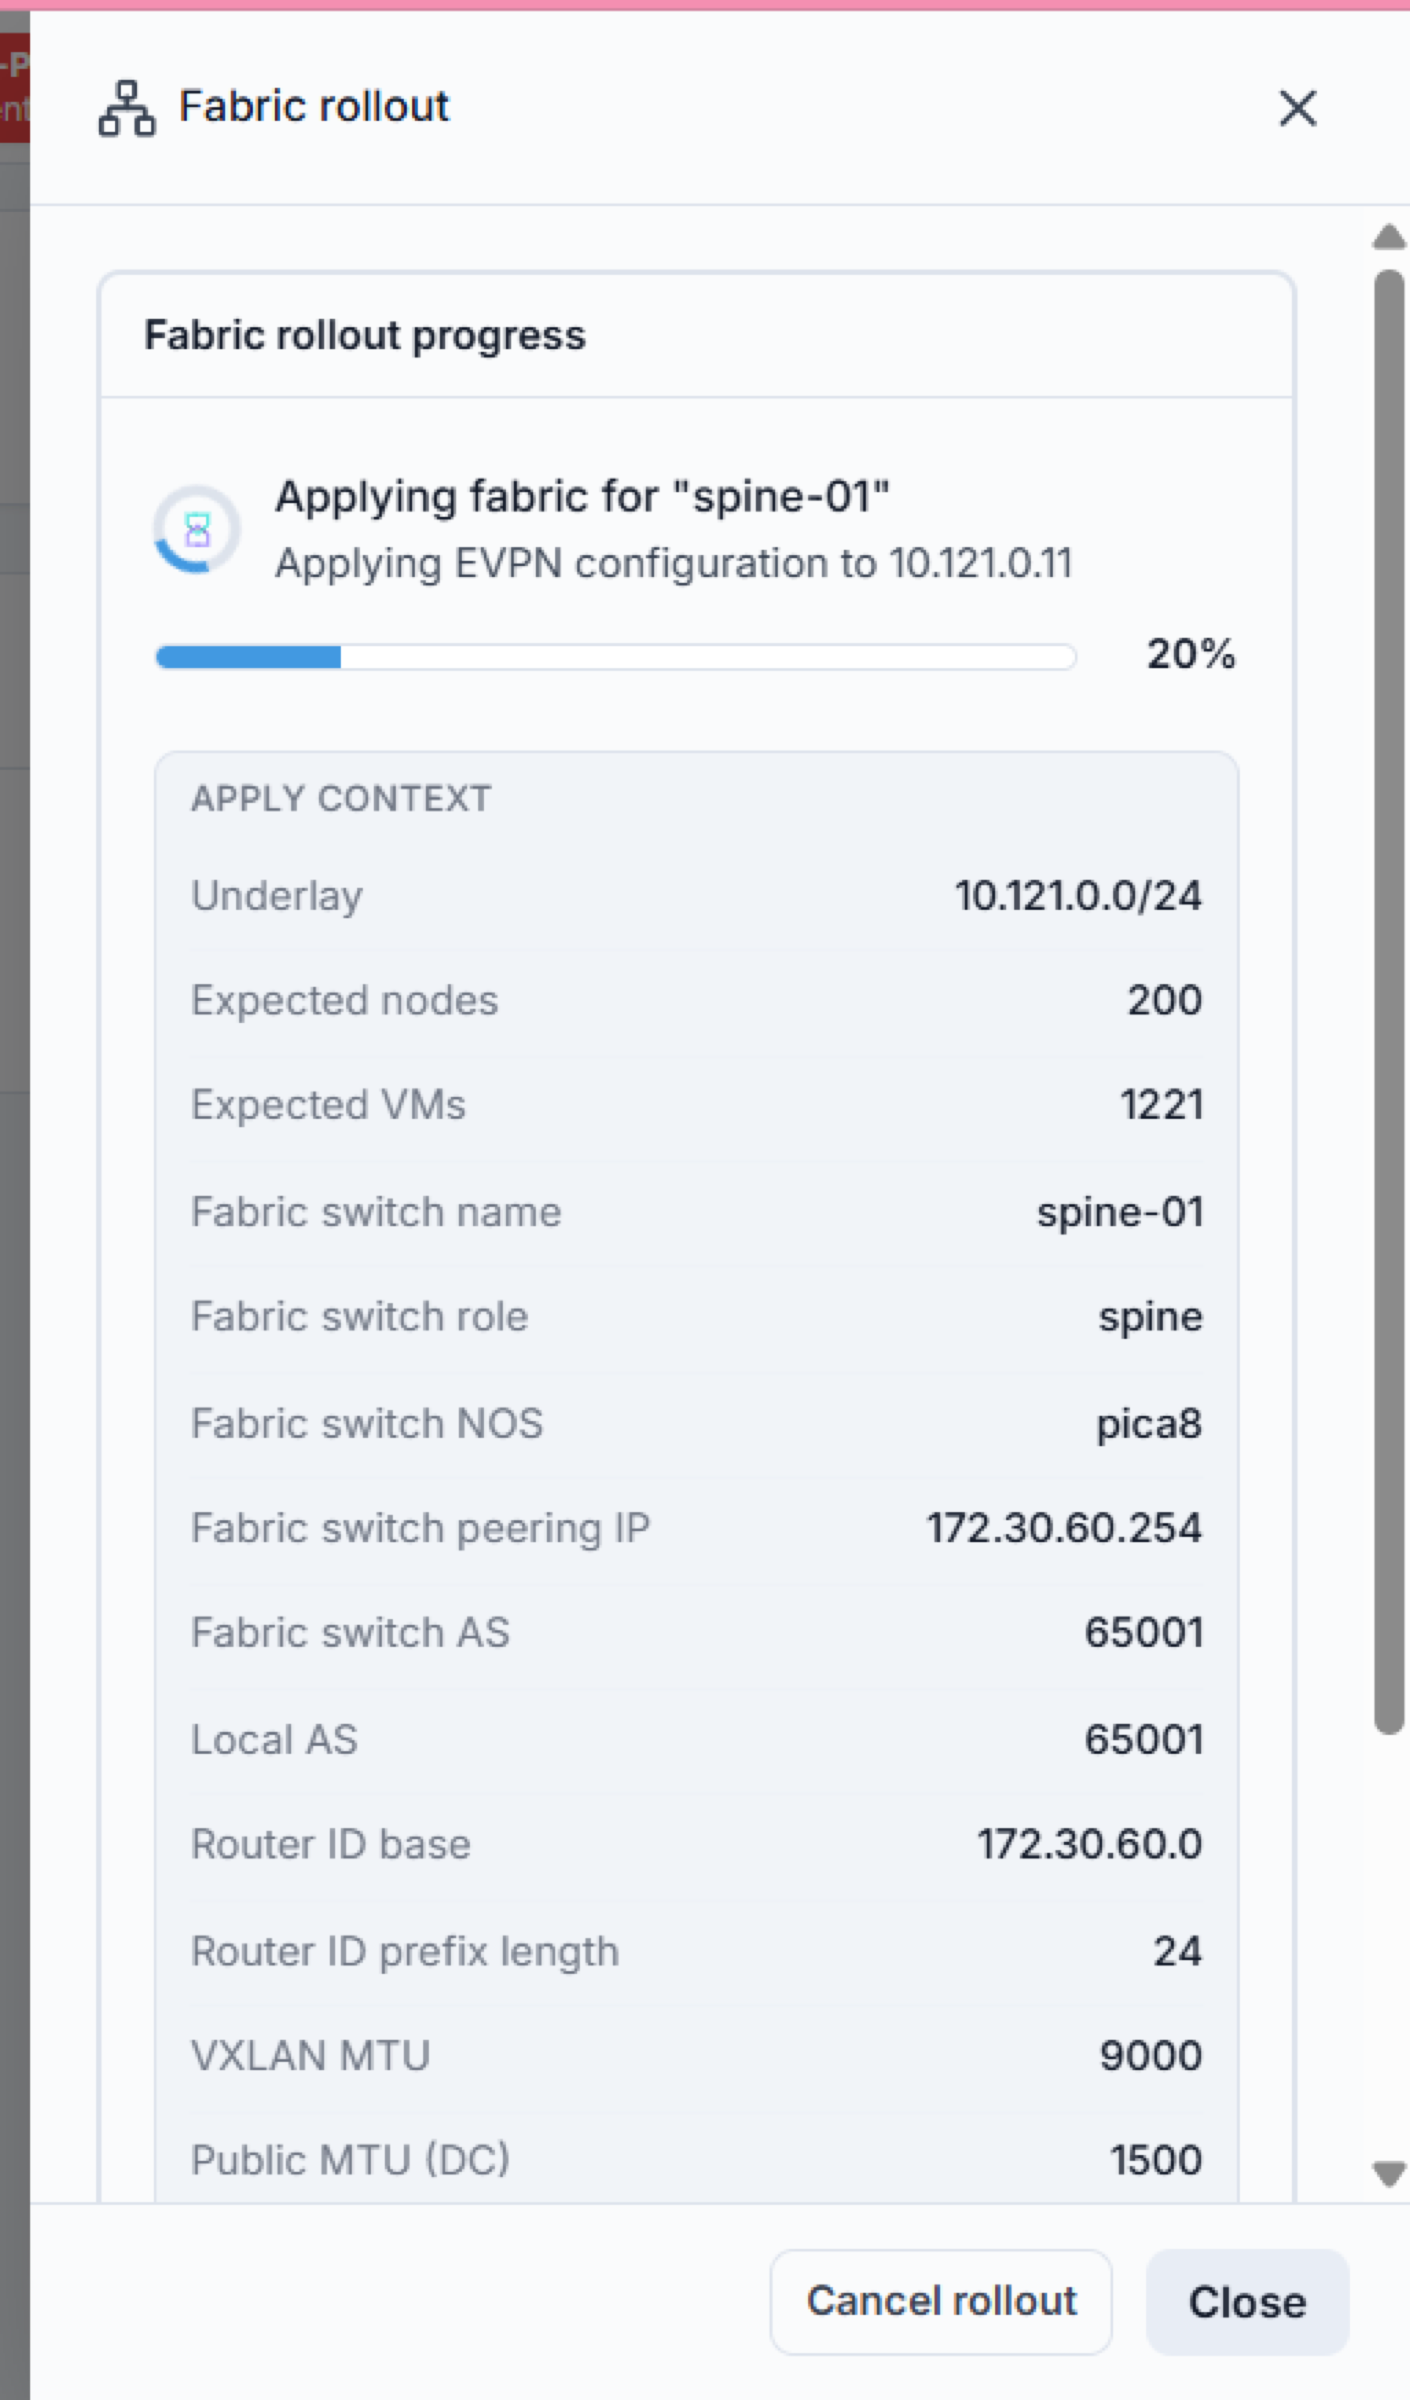
What it shows: per-node EVPN apply progress and the full apply context (underlay, AS,
router-id base, MTUs). Use Close when it completes.
4.2.6. Review and Manage the Configuration
After the rollout completes, the Fabric configuration view (also reachable from the
Fabric config button on the dashboard) summarises the applied fabric.
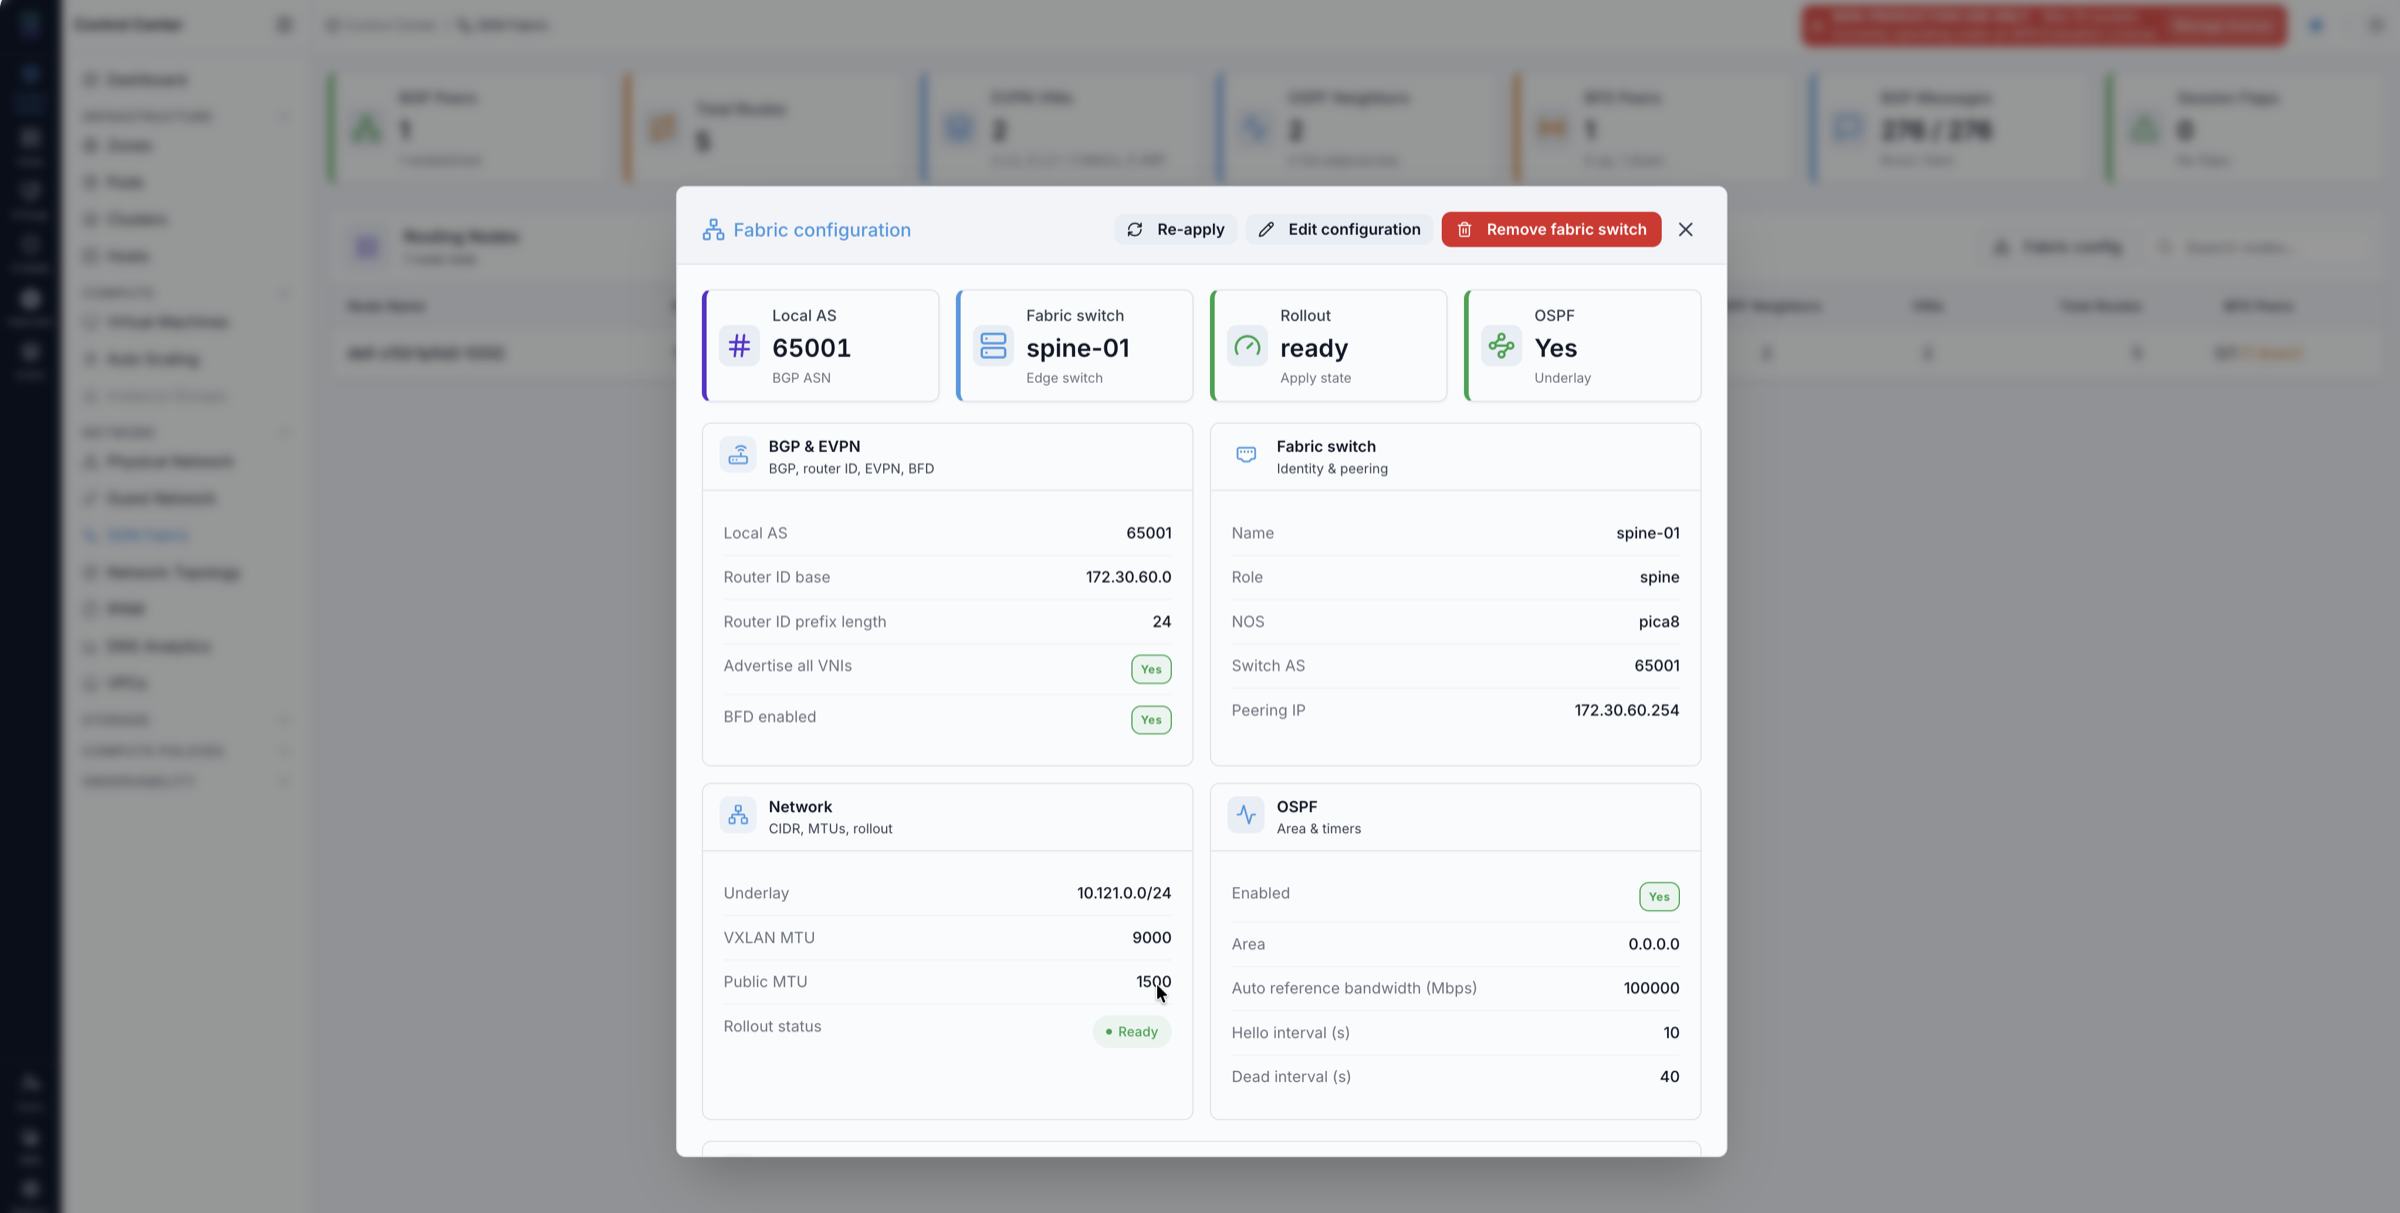
What it shows: Local AS, the fabric switch, Rollout: ready, OSPF: Yes, and the
BGP/EVPN, network, and OSPF details. Use Re-apply, Edit configuration, or
Remove fabric switch to manage it.
You can also confirm an onboarded host joined the fabric from its Hosts detail page:
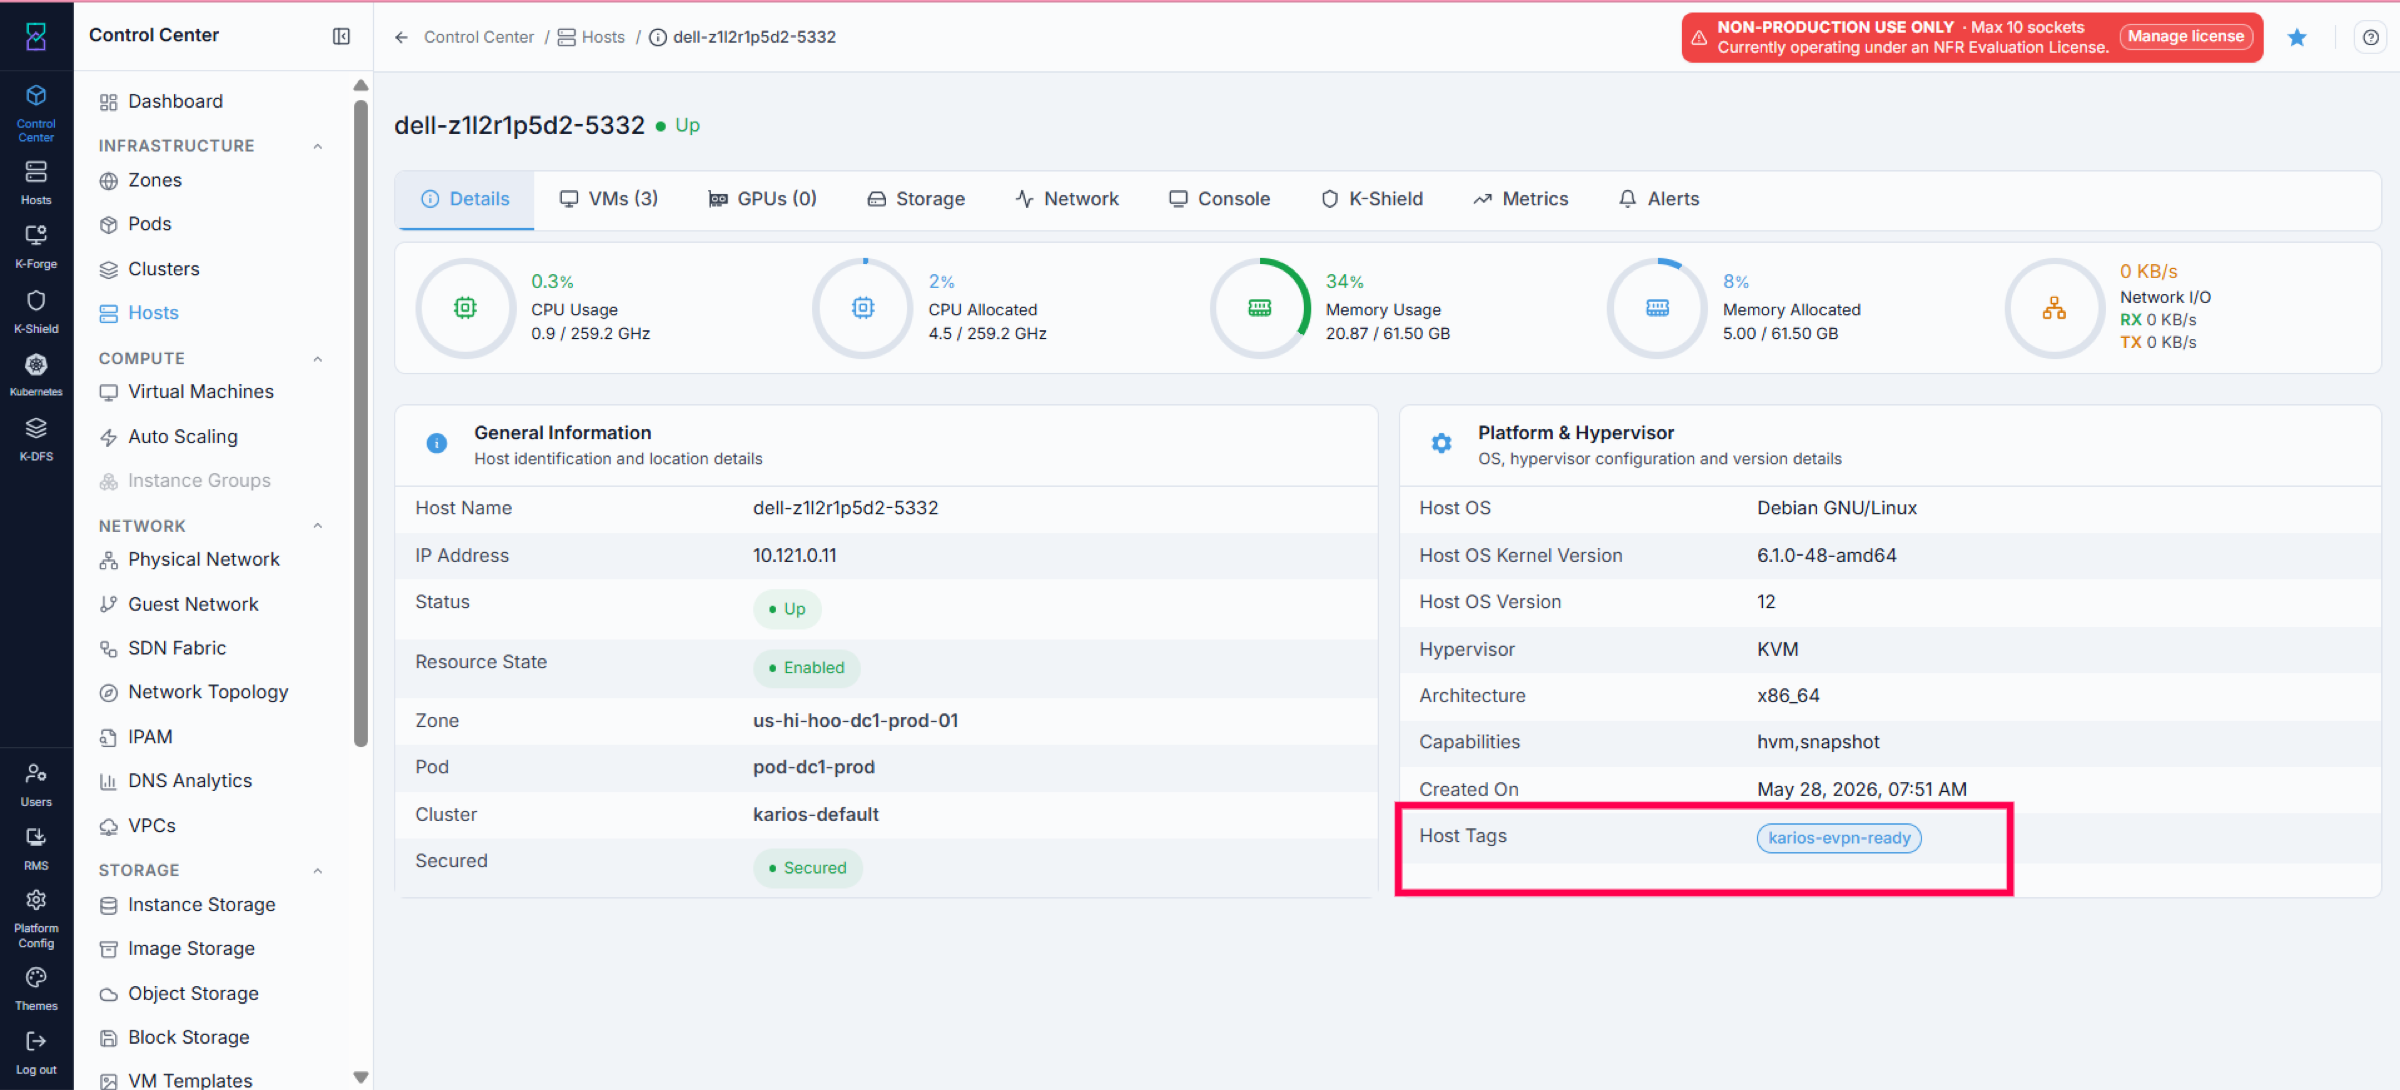
What it shows: Control Center -> Infrastructure -> Hosts -> <host>. A fabric-ready
host carries the karios-dcn-ready host tag.
Done criteria — the fabric is ready when:
The
Fabric configurationview showsRollout: readyandOSPF: Yes.On the dashboard (4.3), the node’s
StatusisonlineandEVPN Healthisready.BGP Peersshows the peerEstablishedandOSPF Neighborsis non-zero.EVPN VNIsandTotal Routesmay still be0— that is expected until you create your first VXLAN network (see 4.8).
4.3. SDN Fabric Dashboard
When to Use:
Use this first for SDN health checks and before opening BGP, OSPF, EVPN, or RIB on a node.
Use this when VMs on different hosts cannot communicate and you need a baseline.
Purpose:
Provide a single landing view of fabric health and entry points to node-level checks.
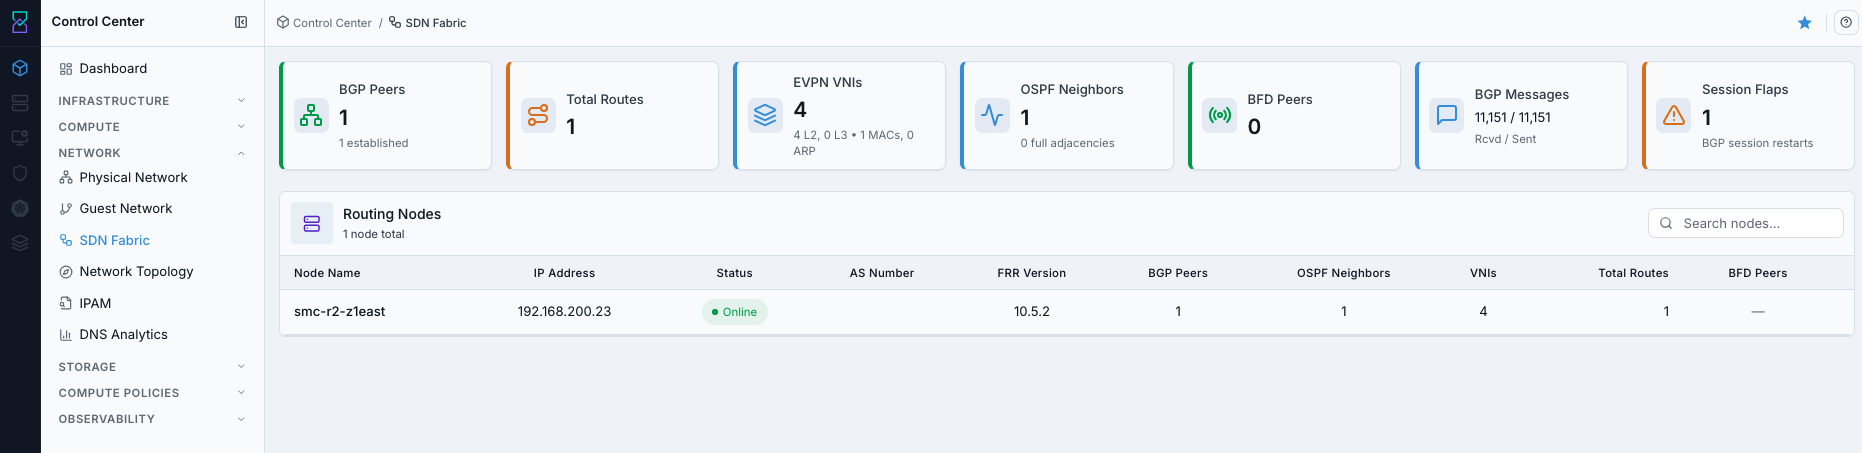
Summary stat cards (top of the page). Read the subtitles — they tell you when a “0” is normal:
Card |
Healthy reading |
When 0 is expected (not a bug) |
|---|---|---|
|
N peers, subtitle “N established” |
— |
|
N neighbors |
— |
|
grows as you add networks |
0 VNIs is normal until you create your first VXLAN guest network. |
|
grows as VMs run |
0 routes is normal until a VXLAN guest network exists. Type-3 (IMET) appears when a VTEP joins a VNI; Type-2 (MAC/IP) once VMs run on it. |
|
up count |
— |
|
received / sent counts |
— |
|
“No flaps” |
A non-zero value means BGP sessions have restarted — investigate (see 4.5). |
Note
The most common support question this answers: “BGP is Established and OSPF is Full, but Total Routes = 0 — is it broken?” No. Routes stay at 0 until a VXLAN guest network is created and VMs run on it. This is by design.
The Routing Nodes table lists every node in the cluster:
Column |
Meaning |
|---|---|
|
Hostname of the compute node. |
|
Node’s management/OS IP. |
|
|
|
Drift state: |
|
The node’s BGP AS. |
|
Routing-engine version. |
|
Peer count. |
|
Neighbor count. |
|
Overlay networks this node knows. |
|
Routes this node has. |
|
Up/down fast-failure-detection peers (for example, “3 (1 down)”). |
Steps:
Open
Control Center -> Network -> SDN Fabric.Review top summary cards for immediate routing health signals.
Review the
Routing Nodestable and identify the node to inspect.Optional: use
Search nodes...to find a specific node quickly.Click an online node name to drill into its BGP/OSPF/EVPN/RIB tabs.

If this fails:
Refresh the page and reopen
SDN Fabric.Verify your account can access Network observability pages.
If
Routing Nodesis empty, verify node discovery/registration in your environment.
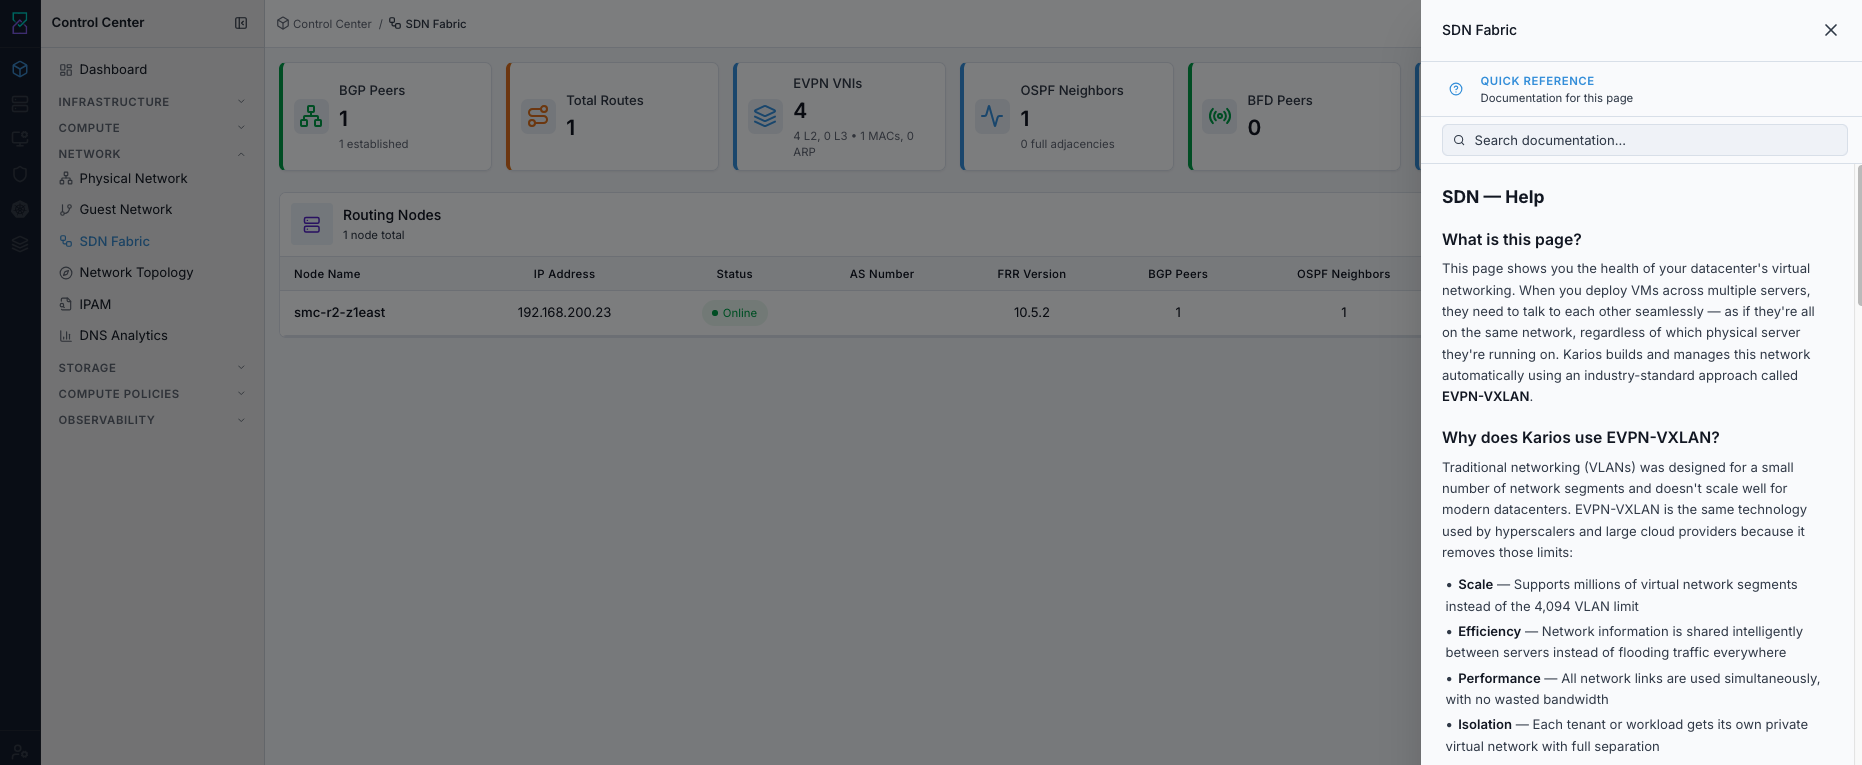
4.3.1. Open the SDN Fabric Help Panel
When to Use:
Use this when you need BGP/OSPF/EVPN/RIB and card definitions in-product.
Steps:
Open
Control Center -> Network -> SDN Fabric.Click the top-right help icon.
Review and search the SDN help panel content.
If this fails:
Refresh the page and click the help icon again.
Verify pop-up/panel rendering is not blocked by browser extensions.
Confirm access permissions for in-product help content.
4.3.2. Open a Node’s Detail Page
Steps:
Open
Control Center -> Network -> SDN Fabric.Optional: use
Search nodes...to find the node by name or IP.In the
Routing Nodestable, click the target (online) node name.
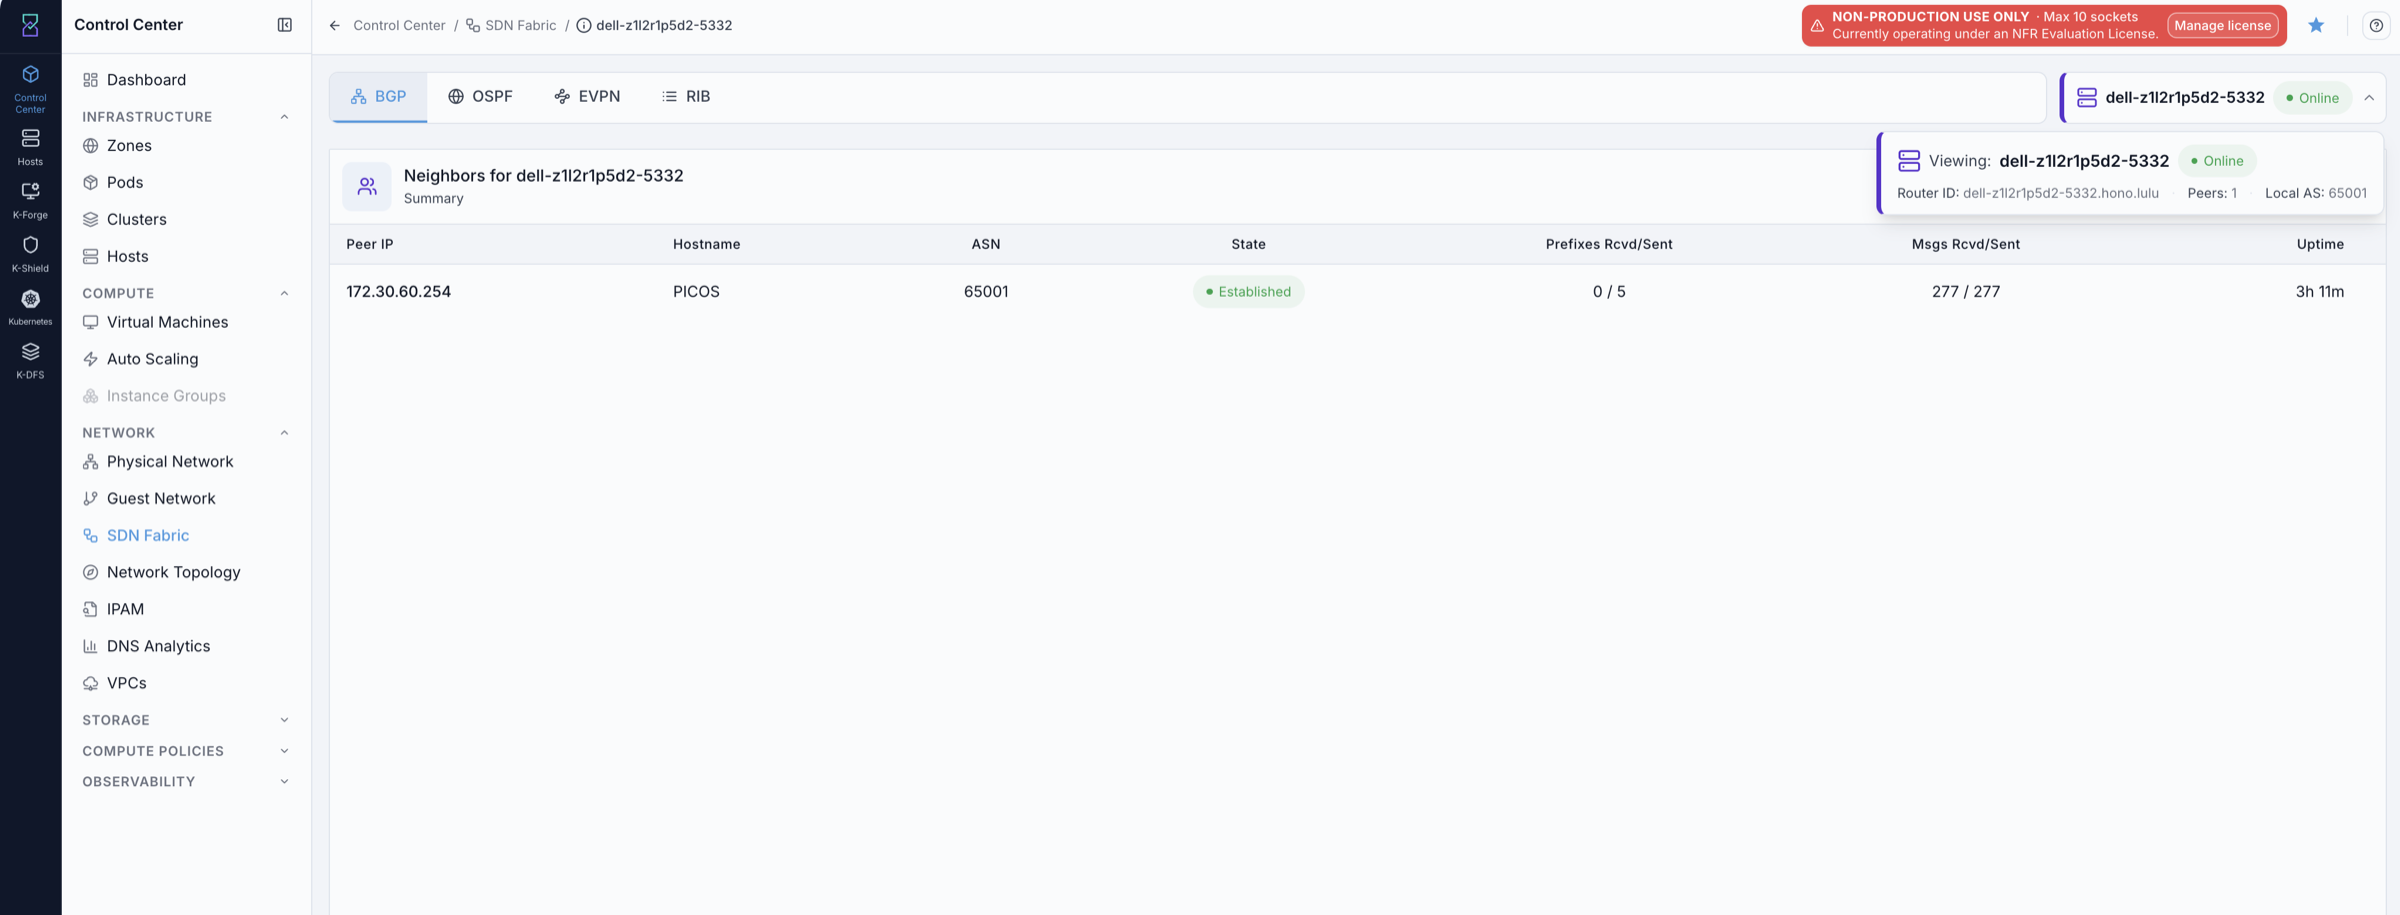
What it shows: the selected node’s detail page (the BGP tab opens by default). Use the
node selector at the top right to switch between nodes without returning to the dashboard.
Expected Outcome:
The node details page opens with the
BGPtab active by default.You can access the
OSPF,EVPN, andRIBtabs.
If this fails:
Clear the node search filter and retry from the full node list.
Verify the target node row is present and
onlineinRouting Nodes.Refresh the page and re-open the same node.
4.4. Node Detail Tabs: BGP, OSPF, EVPN, RIB
A node opens into tabs: BGP, OSPF, EVPN (VNIs + Routes), and RIB. Use
this quick reference before reviewing them:
Term |
What It Means |
Why It Matters Here |
|---|---|---|
|
Border Gateway Protocol for route exchange between SDN nodes. |
Determines whether nodes are exchanging reachability information. |
|
Open Shortest Path First underlay routing service. |
Confirms node-to-node path reachability in the fabric underlay. |
|
Ethernet VPN control-plane for MAC/IP endpoint advertisement. |
Confirms overlay endpoint and segment membership across nodes. |
|
Routing Information Base (active route table view). |
Shows which routes are selected and installed for forwarding. |
4.4.1. BGP
When to Use:
Use this when validating BGP adjacency and route exchange for one SDN node.
Steps:
Open
Control Center -> Network -> SDN Fabric.Click a node in
Routing Nodes.Confirm the
BGPtab is active (it is the default landing tab).
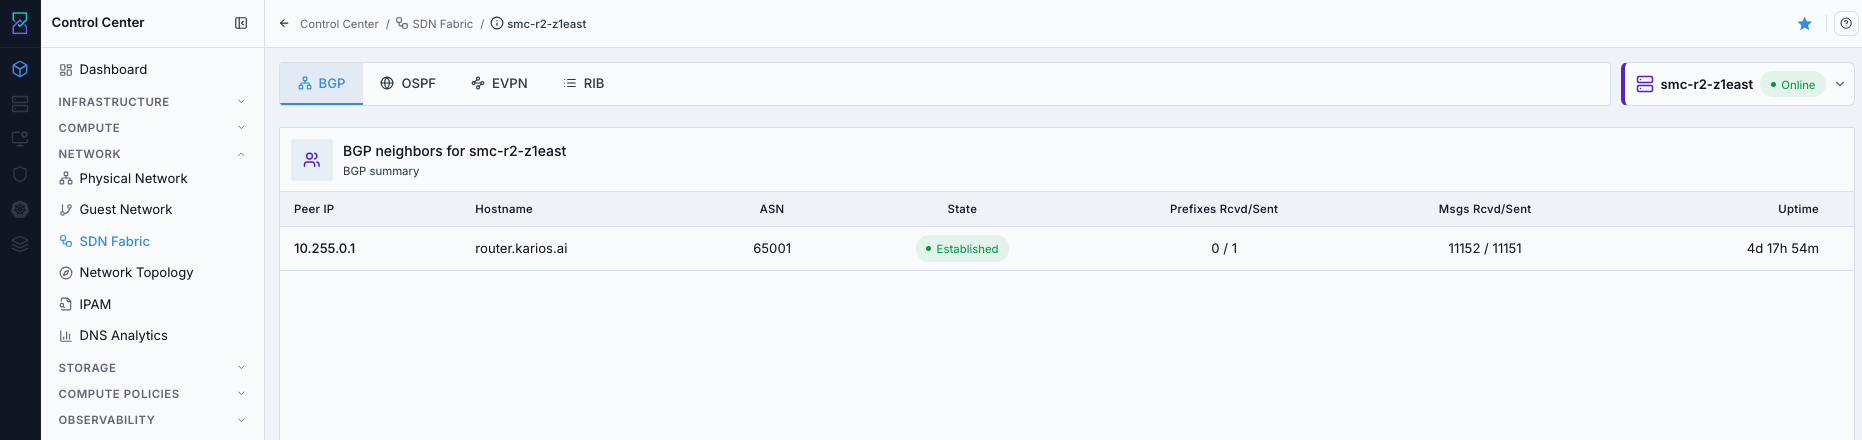
The tab lists the node’s BGP neighbors with columns Peer IP, Hostname, ASN
(equals ours — iBGP), State, Prefixes Rcvd/Sent, Msgs Rcvd/Sent, and
Uptime.
BGP states:
State |
Meaning |
Action |
|---|---|---|
|
Healthy — session up, EVPN exchanging. |
None. |
|
Trying but not up. The console flags EVPN unhealthy. |
Go to the |
(blank) |
No session seen. |
Confirm the node was applied to the fabric. |
If this fails:
Confirm the selected node is online in
Routing Nodes.Reopen node details and retry
BGP.Refresh the page and re-check session visibility.
4.4.2. OSPF — Neighbors and Link-State Database
When to Use:
Use this when BGP is stuck in
Connector when validating underlay reachability.
Steps:
Open
Control Center -> Network -> SDN Fabric.Click a node in
Routing Nodes.Click
OSPFand reviewNeighborsand theLink State Database.
The OSPF tab opens with summary cards (Router ID, Total LSAs, Neighbors,
Areas) and three sub-tabs: Areas, Neighbors, and Link State Database.
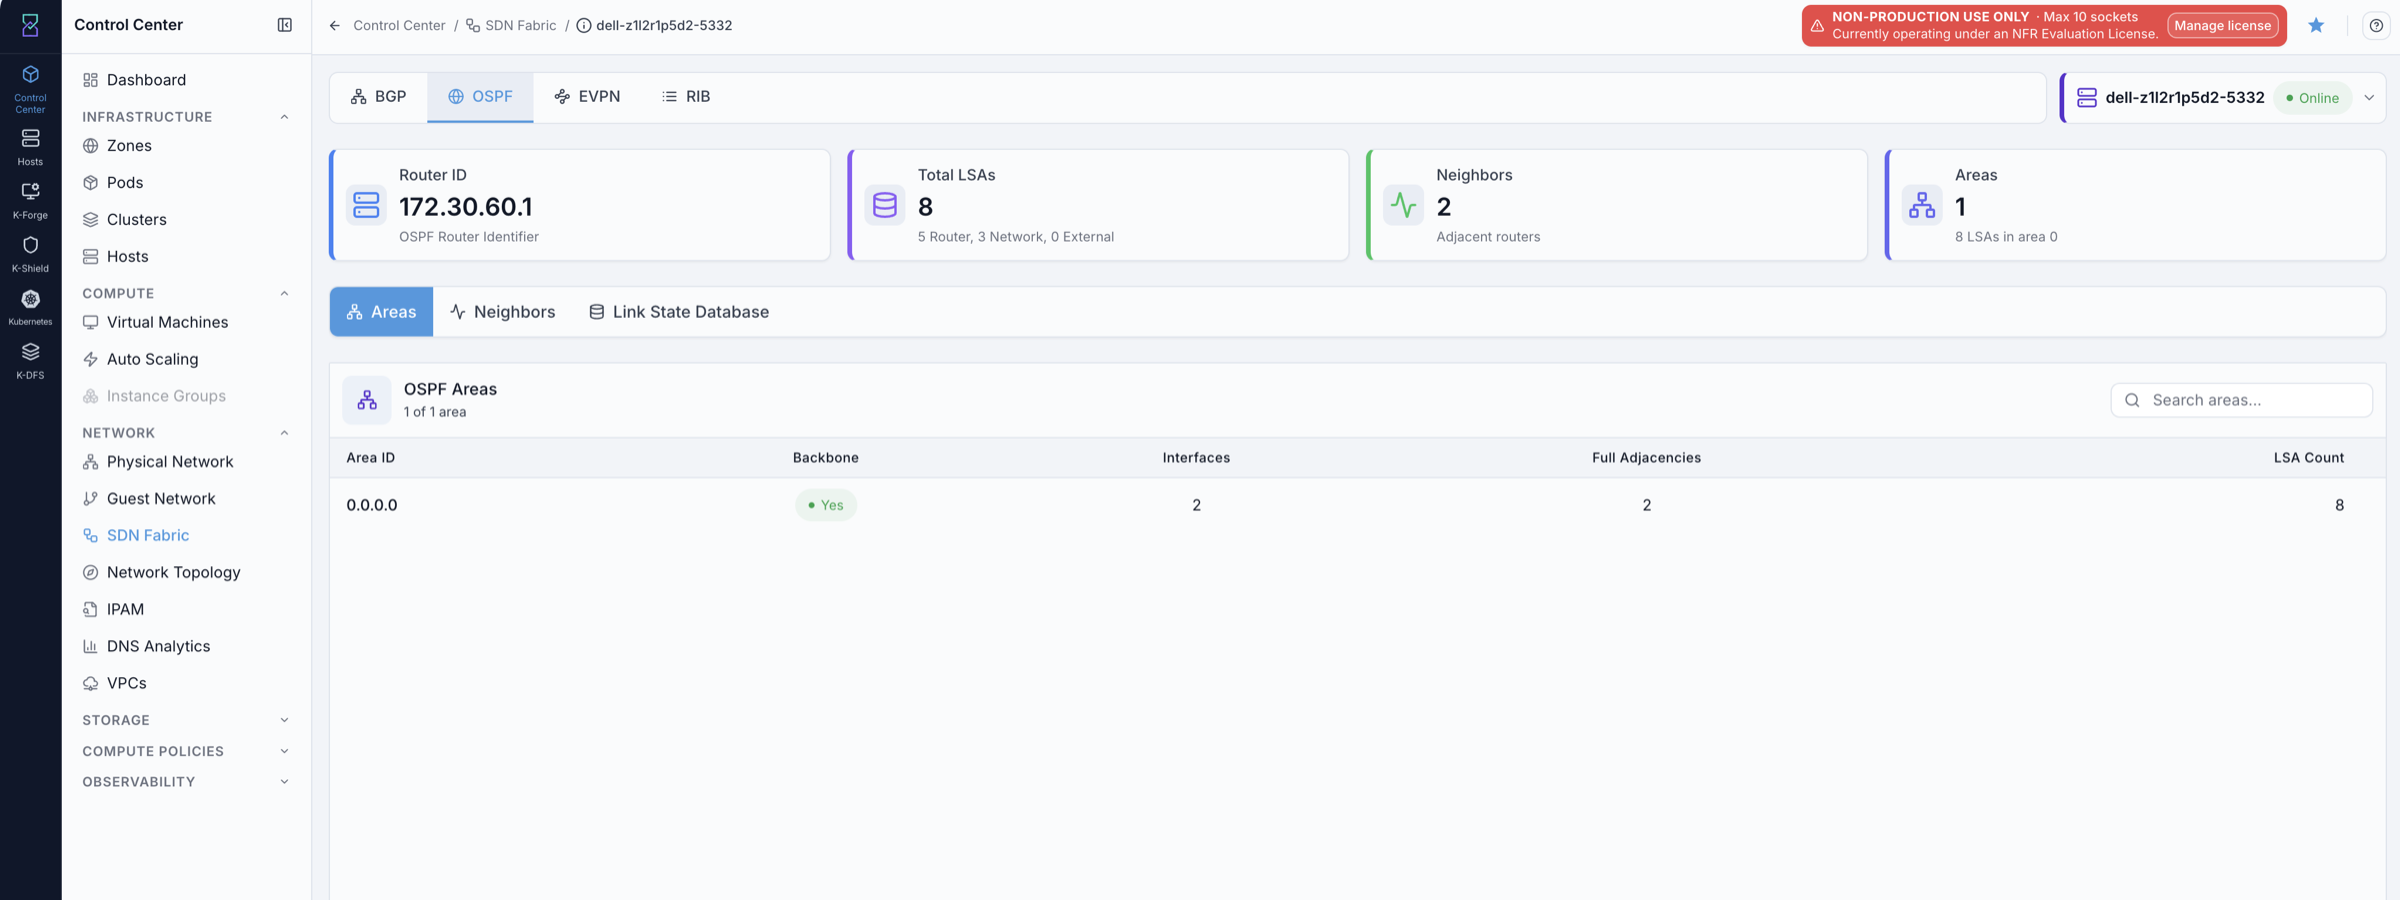
What it shows: the OSPF summary cards and the Areas sub-tab. The Areas table lists
each area with Backbone, Interfaces, Full Adjacencies, and LSA Count — for
a healthy backbone area 0.0.0.0, Full Adjacencies should match the neighbor count.
Neighbors columns: Neighbor ID, State, Address, Interface,
Priority, Dead Time. Look for the interface cloudbr0 tied to the node’s
router IP — that is the OSPF-speaking interface.
OSPF neighbor states:
State |
Meaning |
Action |
|---|---|---|
|
Healthy adjacency. |
None. |
|
OSPF is stuck — not forming. Top causes: MTU mismatch, wrong peering, hello/dead-timer mismatch. |
Check MTU on the fabric interface ( |
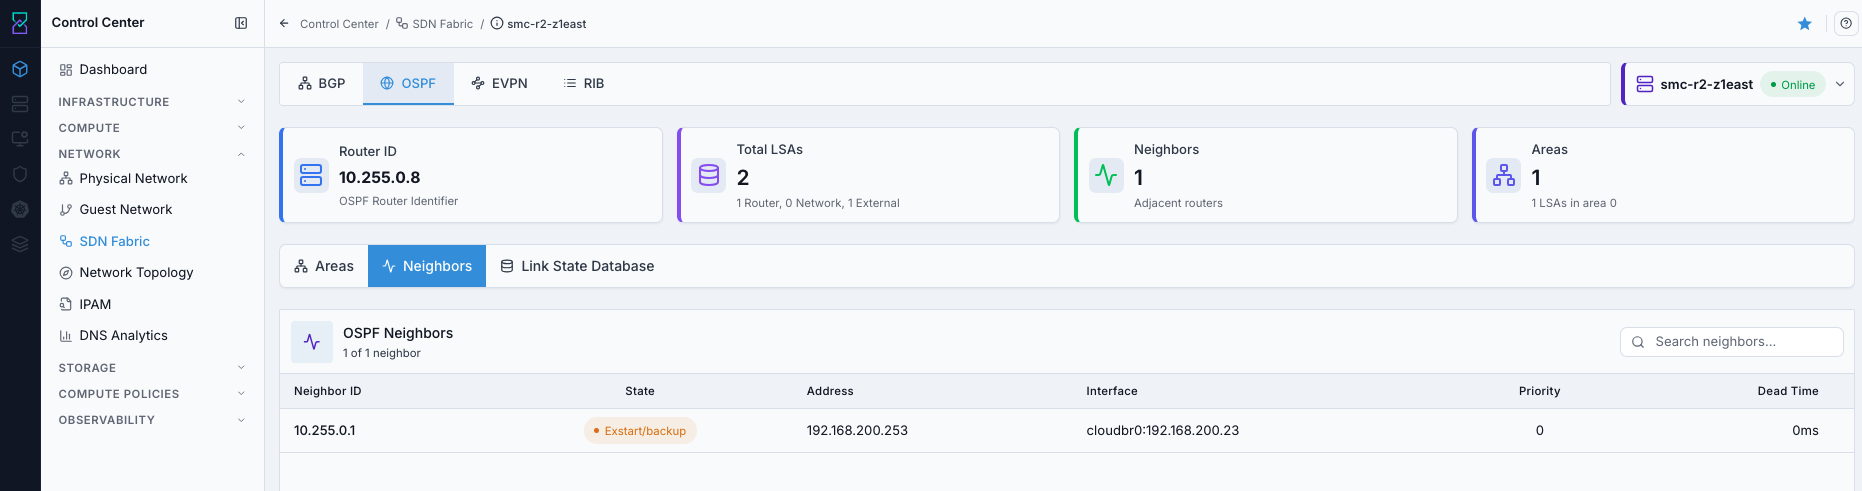
A neighbor stuck in ExStart almost always means the path MTU is too small. The fabric
raises the Switch MTU change required action during setup — fix the switch MTU there
(see 4.2.2) and re-run, rather than from this read-only tab.
Important
The Link-State Database lists every route OSPF discovered, including the external BGP
peering IP you entered when creating the fabric. The moment that peering IP appears in
the LSDB, BGP can find its peer and the BGP tab flips Connect -> Established.
This is the hinge of the entire fabric: if BGP is stuck in Connect, check whether the
peering IP is in the LSDB here.
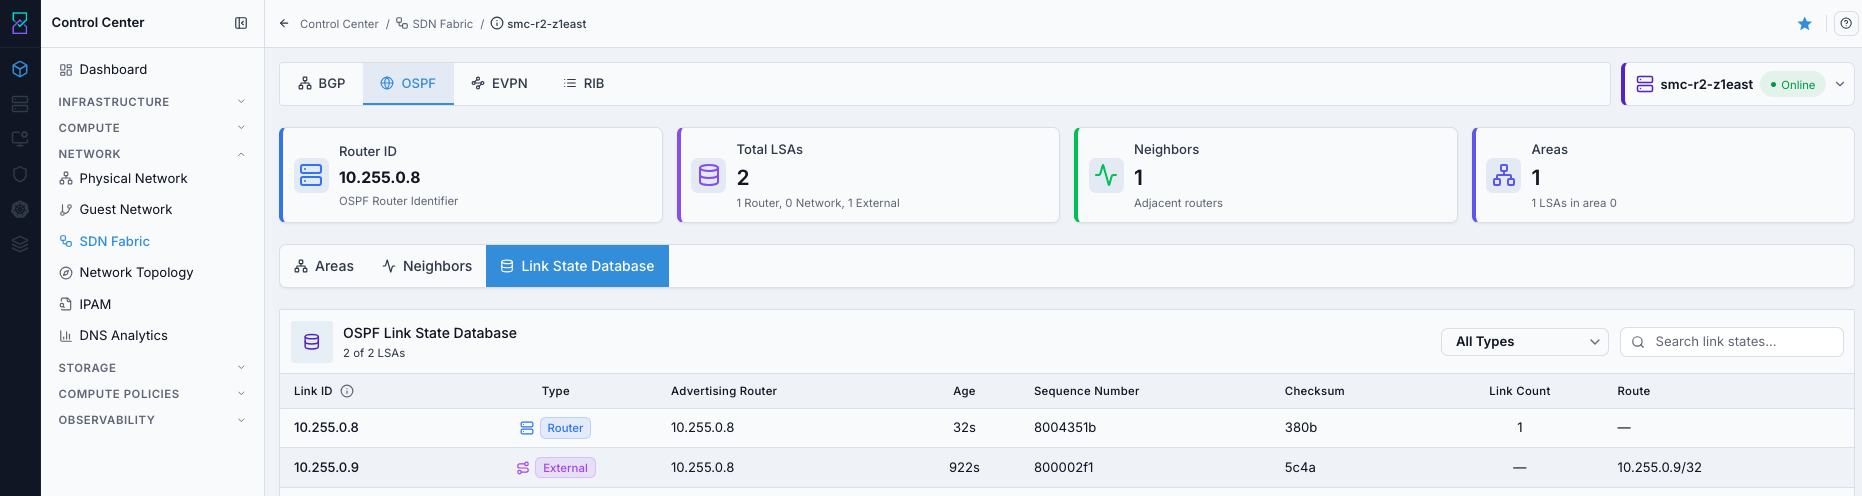
What it shows: the Link State Database sub-tab. Each row is an LSA with Link ID,
Type (Router / Network), Advertising Router, Age, Sequence
Number, Checksum, and Link Count; use All Types and the search box to
filter. Confirm the peering IP appears here.
If this fails:
Compare
Neighborsstate with the LSDB to find adjacency-driven gaps.For
ExStart, validate MTU consistency between peers first.Confirm the peering IP is present in the LSDB; if missing, OSPF has not converged.
4.4.3. EVPN — VNIs and Routes
When to Use:
Use this when checking overlay membership and endpoint advertisement.
Steps:
Open
Control Center -> Network -> SDN Fabric.Click a node in
Routing Nodes.Click
EVPNand review theVNIsandRoutesviews.
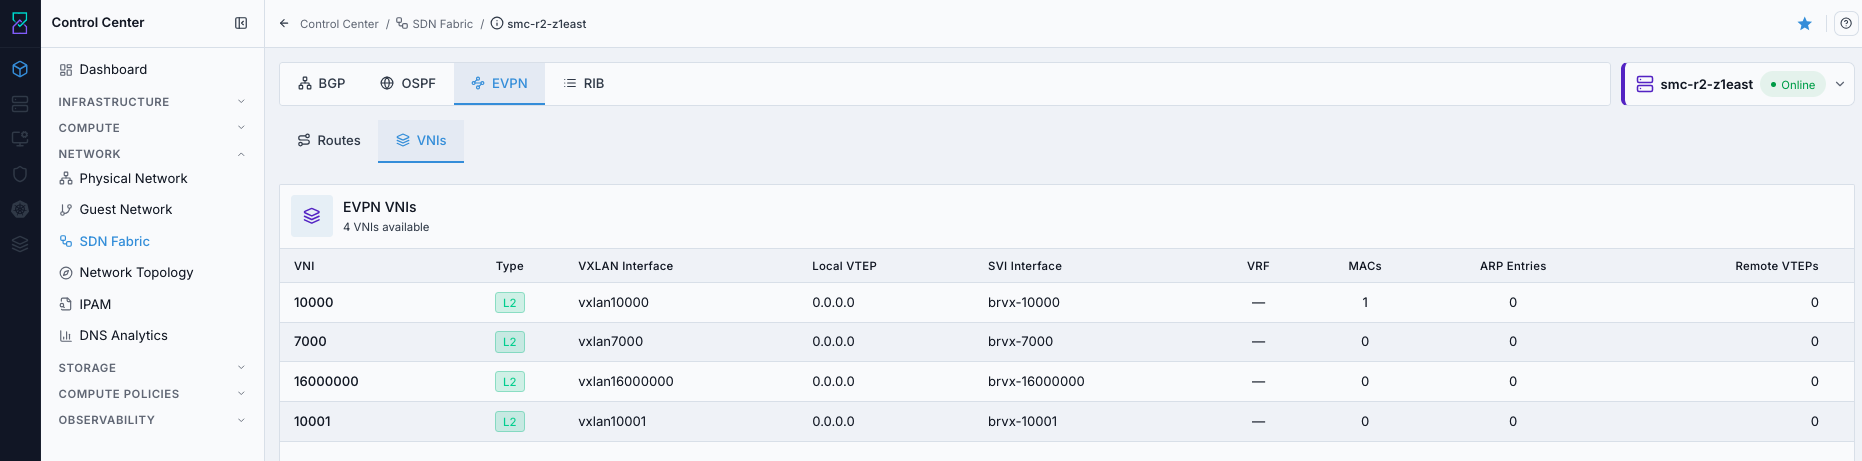
Each VNI row shows VNI, Type (L2/L3), VXLAN interface (vxlan_if),
Local VTEP, MACs / ARP entries, Remote VTEPs, and SVI / VRF.
Num Remote VTEPs should be non-zero when the segment spans hosts.
EVPN route types:
Type |
What it carries |
Appears when |
|---|---|---|
|
“I have this VNI” — VTEP membership. |
A VTEP joins a VNI (a VXLAN guest network exists). |
|
Endpoint MAC/IP bindings. |
VMs actually run on the VNI. |
|
External IP prefixes, from the route reflector. |
External routes are advertised. |
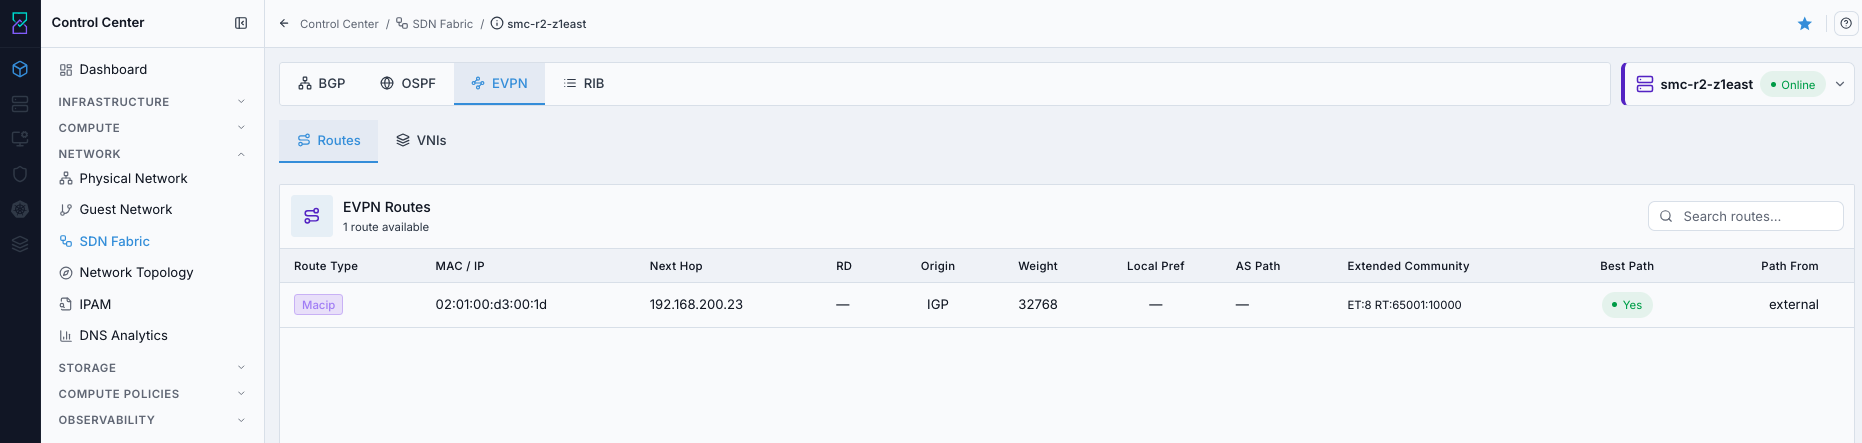
Warning
If EVPN routes are missing, cross-host VM communication can fail. If the view reports
No EVPN routes found, verify that target VNIs/guest networks exist and that BGP
peering is established.
4.4.4. RIB
When to Use:
Use this when verifying final route selection and forwarding installation state.
Steps:
Open
Control Center -> Network -> SDN Fabric.Click a node in
Routing Nodes.Click
RIB.
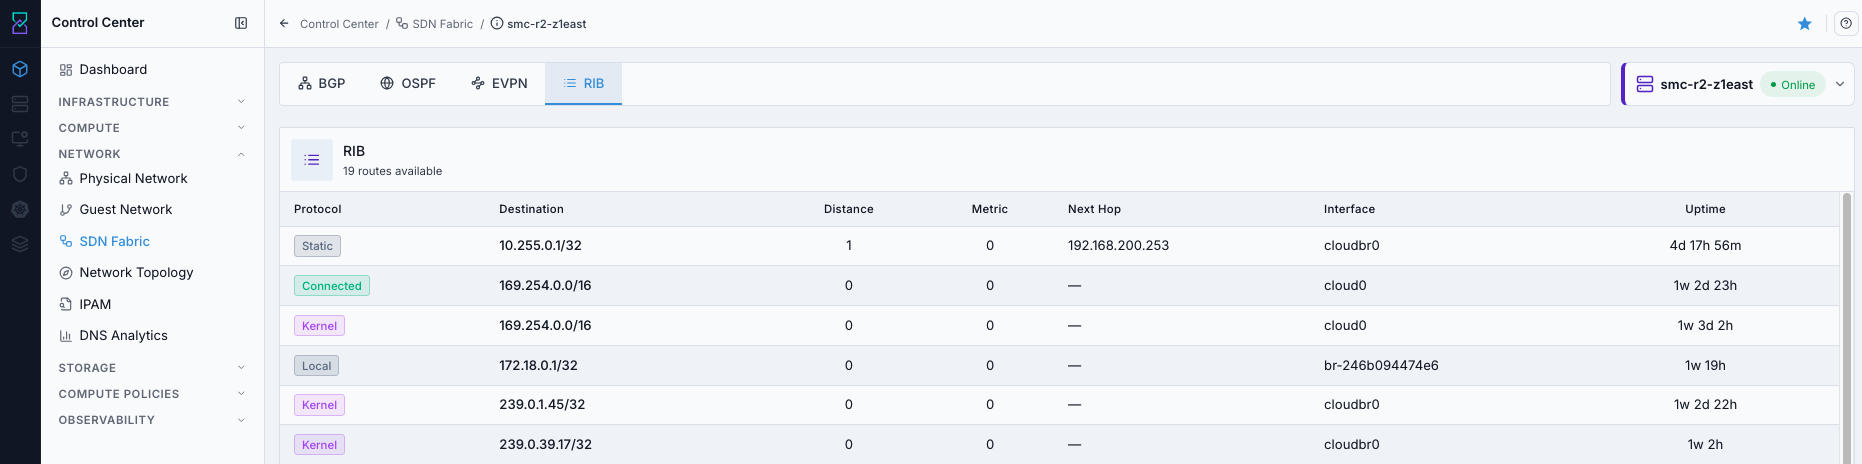
The RIB is the node’s end-to-end routing table. Visible columns are Protocol,
Destination, Distance, Metric, Next Hop, Interface, and Uptime.
Where the table exposes Selected / Installed flags, Installed = true means the
route is imprinted into the host’s Linux kernel table — that is, it is live in the
dataplane.
Protocol (route source) interpretation:
Source |
What It Is |
Trust Level |
|---|---|---|
|
Local route created by the operating system on the node |
Highest |
|
Directly attached network route |
Highest |
|
Route learned from OSPF neighbors |
Medium |
|
Route learned through BGP |
Varies |
Install-state checks (where Selected / Installed are shown):
Selected = YesandInstalled = Yes: active forwarding route.Selected = NoandInstalled = No: alternate or backup route.Selected = YesandInstalled = No: unresolved next hop or install issue.OSPF-learned routes to remote tunnel-endpoint
/32destinations should be present and installed.
4.5. Monitoring and Health Signals
Two independent signals tell you a fabric is degrading.
Node EVPN Health. The per-node fabric health shown as EVPN Health on the
dashboard. It is re-checked roughly every 30 seconds and needs two consecutive bad
checks before it flips state, so a single blip will not trip it. States: ready /
failed / unreachable. An unhealthy node shows offline / “EVPN not ready”.
Session flaps (early warning). On the dashboard, watch BGP Msgs Rcvd/Sent. When
they drift out of sync — for example 9 / 10, one side sent a message the other did
not process — the router eventually triggers a session flap (a BGP session restart).
Every flap weakens connectivity. A climbing Session Flaps card is an early symptom,
usually MTU or an unstable link, that shows up before the session fully drops. Treat a
rising flap count as “go look now.”
4.6. When the Fabric Blocks Creation
If any participating node’s SDN is unhealthy (the fabric is not fully converged), Karios blocks operations that would silently fail:
Action |
Result |
Why |
|---|---|---|
Provision a VM on a VXLAN network |
Blocked (error) |
The VM would land on a fabric that cannot carry its traffic. |
Create a new VXLAN guest network |
Blocked (error) |
The SDN fabric cluster is not complete/ready. |
Create a VPC tier, or a VM in a VXLAN VPC |
Blocked (error) |
Tiers are VXLAN networks; they need full BGP convergence. |
Already-running VMs are not touched. They keep running and recover on their own once the fabric heals (BGP re-establishes, routes re-propagate). The block applies only to new VXLAN resource creation.
Note
The block is protecting you. Without it, you could create a VXLAN network or VM on a broken fabric, everything would look successful, and a tenant would later report that VMs cannot reach each other. Instead, Karios stops you at click-time and points at the exact unhealthy node.
4.7. Troubleshooting Flow
When to Use:
Use this when VMs on different hosts cannot communicate, or when a create is blocked.
Purpose:
Provide a fixed troubleshooting order so control-plane faults are isolated quickly.
Steps:
SDN Fabric— find the node(s) whoseEVPN Healthis red.Open the node —
BGPtab.Establishedmeans that node is fine (check the others);Connectmeans go to step 3.OSPFtab —Neighbors.ExStart/Initmeans check the MTU oncloudbr0first, then verify peering and hello/dead timers.Fullmeans go to step 4.OSPFtab —Link State Database. Confirm the peering IP is listed. If missing, OSPF has not converged and BGP will stay inConnectuntil it appears.Once
OSPF = FullandBGP = Established, the node’sEVPN Healthreturns toready(within ~60s) and creation is unblocked. Retry your VM / network / VPC action.
If this fails:
Reopen the affected node and repeat checks in the same order.
Confirm node status is online and BGP/OSPF/EVPN/RIB tabs are populated.
Escalate with captured BGP/OSPF/EVPN/RIB evidence for the failing node.
4.8. Using the Fabric: Networks, VMs, and VPCs
Once the fabric is healthy, the fabric-dependent workflows are documented in their own sections — use these rather than configuring overlay networks from the SDN page:
Create an isolated VXLAN network — Guest Networks. Pick the VXLAN encapsulation and supply the VNI. In the list, VXLAN networks show a broadcast URI of
vxlan://<VNI>.VMs and per-network routers — Compute – Virtual Machines. Each isolated network also gets its own Virtual Router at
Control Center -> Compute -> Virtual Routers.VPCs — VPCs. A VXLAN VPC is built from tiers, and each tier is a VXLAN network that depends on a healthy fabric exactly like a standalone VXLAN network.
Note
When the first VXLAN guest network is created, the EVPN VNIs and Total Routes
cards on the SDN dashboard (see 4.3) start populating — this is when “0” becomes a
real number.
5. Network Topology
Use Network Topology for real-time visibility into physical and virtual network health across compute nodes.
This page combines host-level and fabric-level networking views in one place:
Dashboard summary cards for overall health and capacity indicators
Nodestab for per-node quick statusAlertstab for active network issuesNode detail tabs for
Bridges,Interfaces, andVXLANs
Term Definitions:
MTU: Maximum Transmission Unit, the largest packet size sent without fragmentation.Carrier: whether a network link is physically/operationally up.RX/TX: received/transmitted traffic counters.CRC: Cyclic Redundancy Check error indicator for link/data corruption.
Step: Open Network Topology
When to Use: Use this for initial network-fabric triage and node-level drilldown.
Purpose: Open Network Topology and establish a baseline before reviewing nodes or alerts.
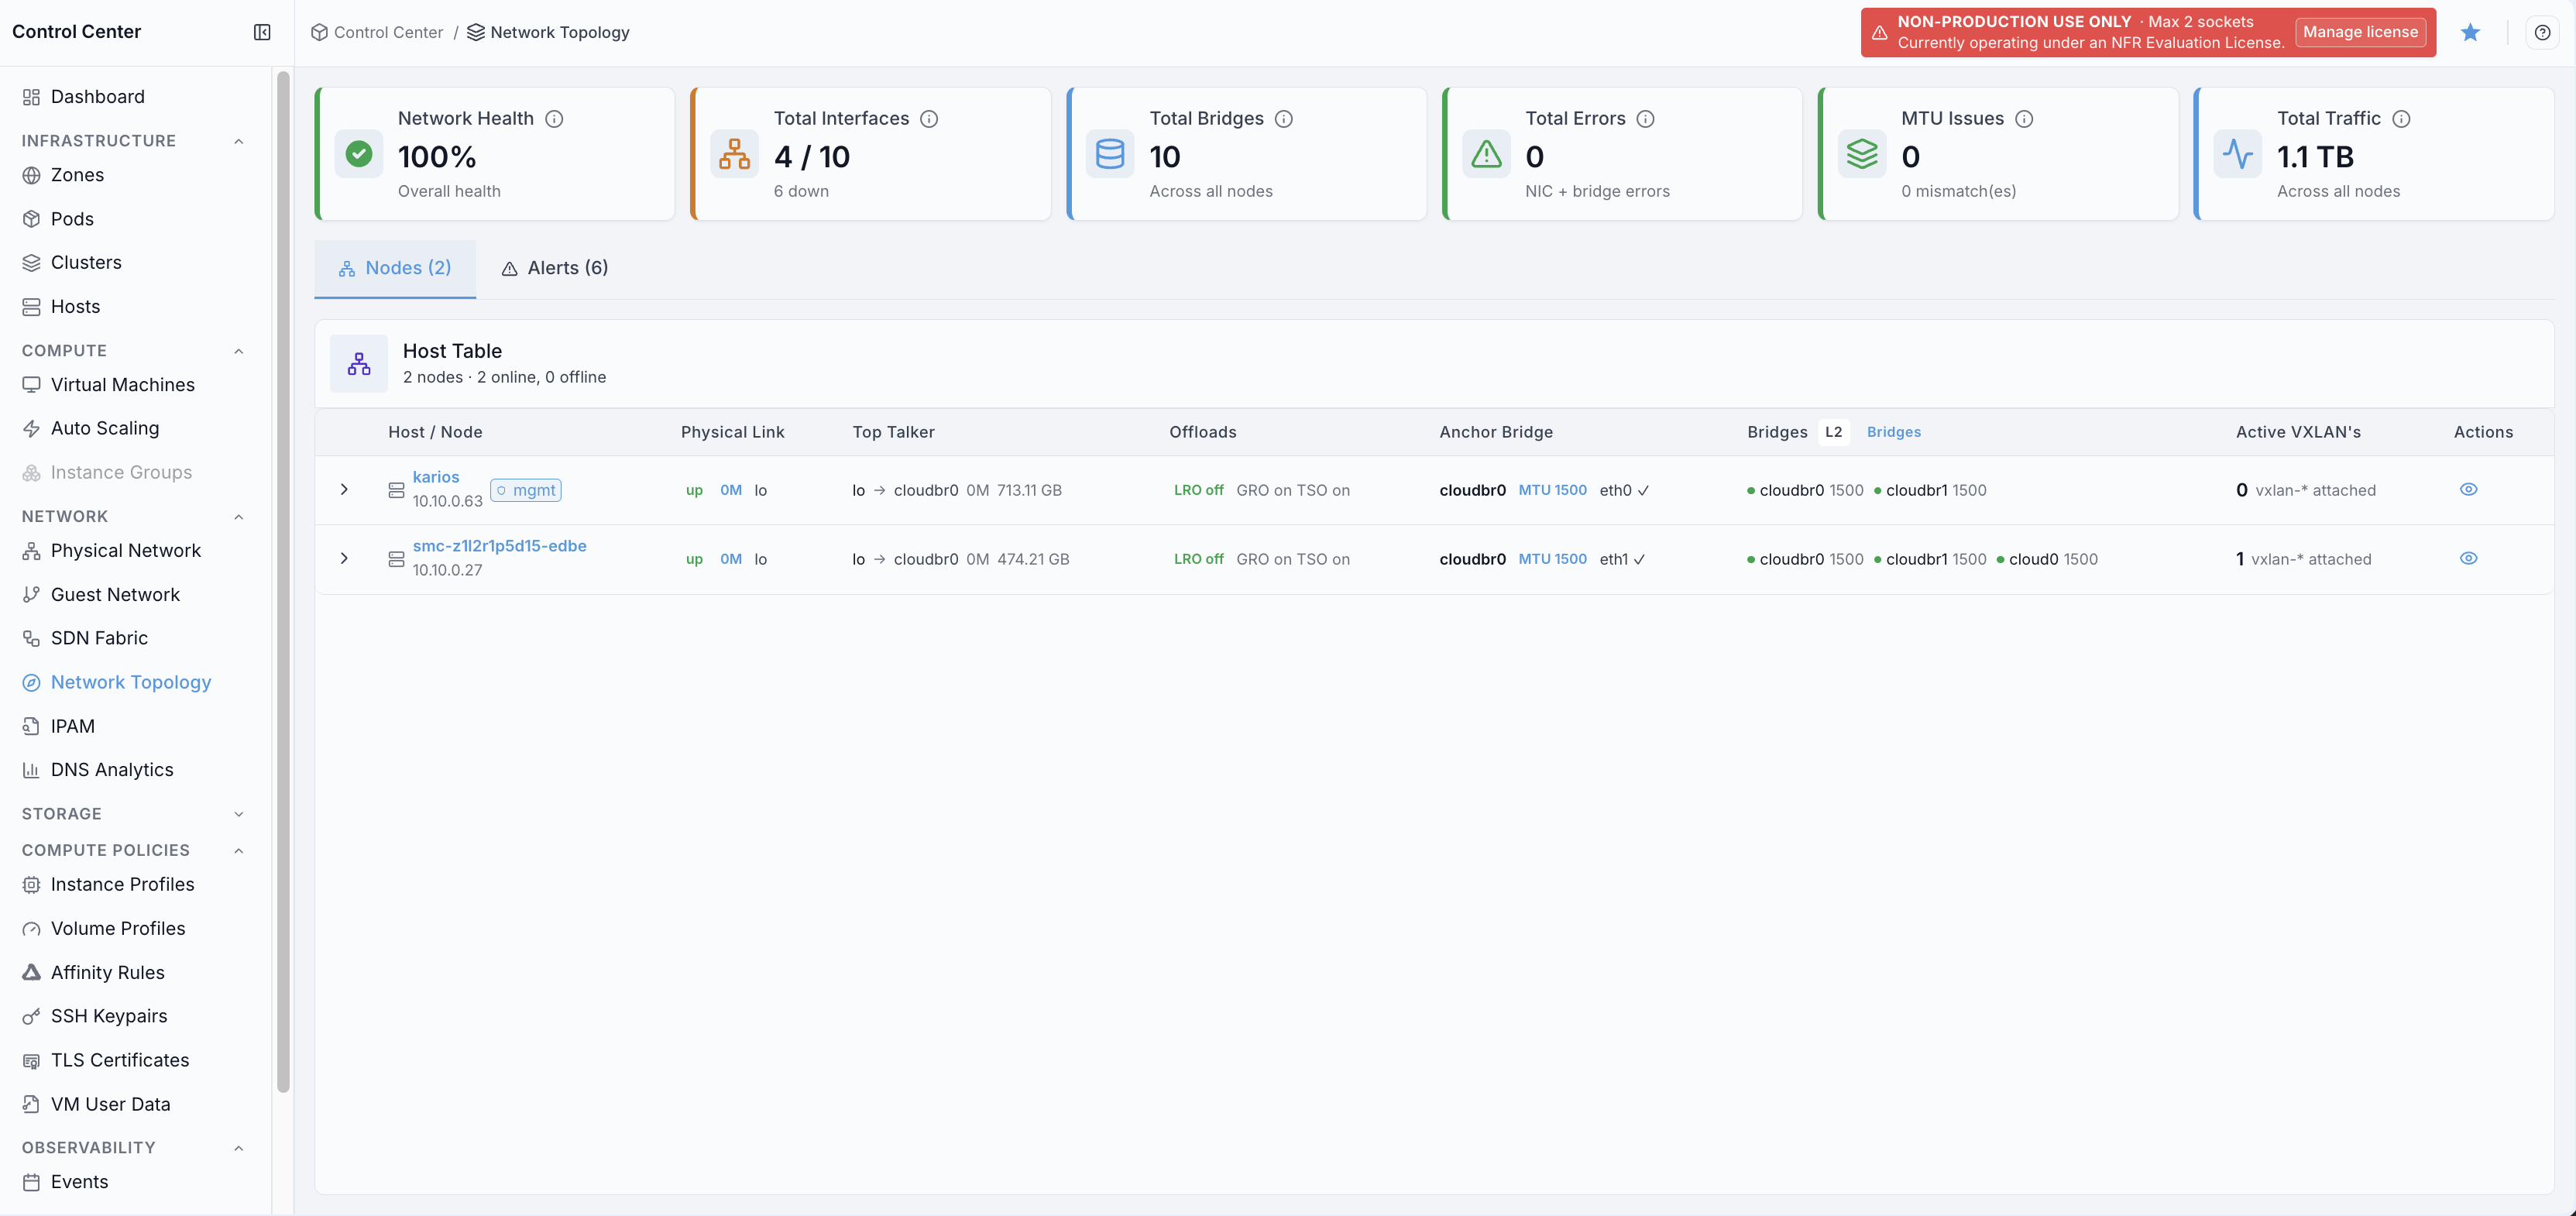
Dashboard shows:
Summary cards for network health, total interfaces, total bridges, total errors, MTU issues, and total traffic.
NodesandAlertstabs for host-level and issue-level troubleshooting entry points.Nodesis the default first view and shows the Host Table immediately on page load.Node rows show physical link state, top talker, offloads, anchor bridge, bridge inventory, active VXLAN count, and an action to open details.
What you can do from this screen:
Start triage from high-level health indicators.
Switch to
Alertsfor active issues.Open node details for bridges, interfaces, and VXLAN analysis.
Steps:
Open
Control Center -> Network -> Network Topology.Confirm
Nodesis selected (default first view).Review dashboard summary cards.
Review the node list shown in the first view.
Use
NodesandAlertstabs for triage.Click a node to open detail tabs.
Expected Outcome:
You get the Nodes-first dashboard view with summary cards and node list visible.
You get direct entry points for alert review and node-level troubleshooting.
If this fails:
Reload
Network Topologyand clear any active node search/filter before retrying.Confirm your account can access
Network Topology.Confirm networking telemetry is available for your environment.
Step: Open Network Topology Help Panel
When to Use: Use this after opening the Network Topology dashboard when you need definitions for cards, tabs, and alerts.
Purpose: Open page help as a separate step from dashboard review.
Steps:
Open
Control Center -> Network -> Network Topology.Click the top-right help icon.
Review the help panel guidance.
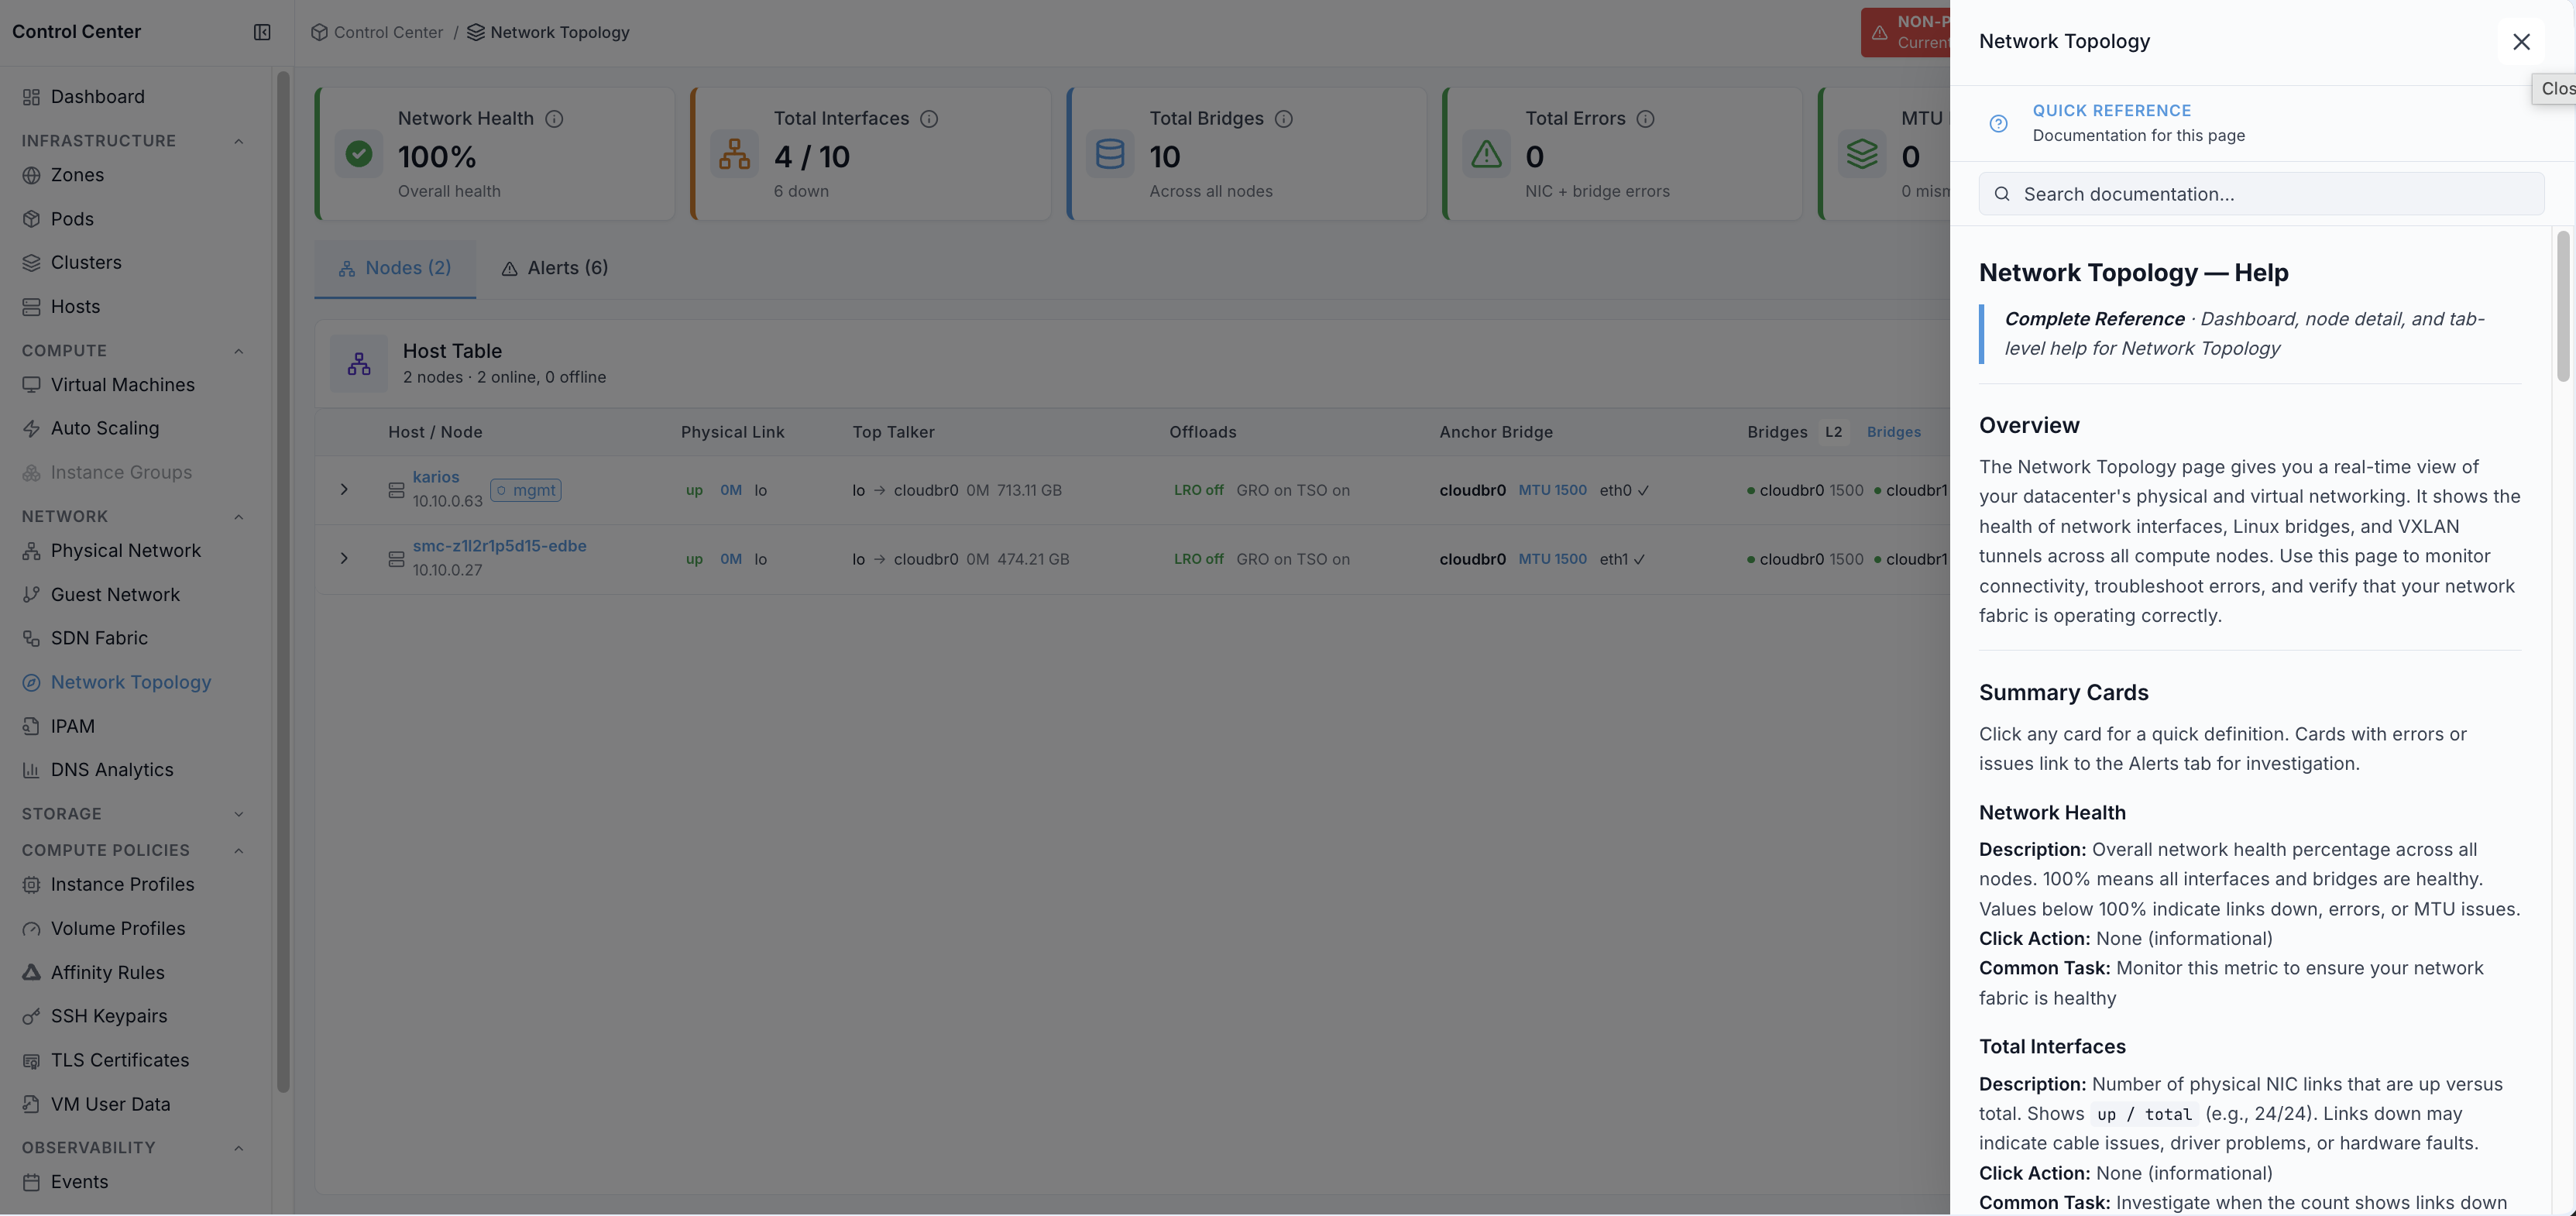
Expected Outcome:
Network Topology help opens in the right-side panel.
You can review the complete reference for dashboard cards, node details, and tab-level troubleshooting.
You can continue dashboard triage with clear context.
If this fails:
Refresh the page and click the help icon again.
Confirm your account can access in-product help content.
Retry after reopening
Network Topology.
Summary Cards
Card |
Description |
Click Action |
Common Task |
|---|---|---|---|
Network Health |
Overall health percentage across nodes and network objects. |
Informational |
Monitor overall networking baseline. |
Total Interfaces |
Count of links up versus total interfaces. |
Informational |
Investigate when links are down. |
Total Bridges |
Total Linux bridge count across nodes. |
Informational |
Validate bridge topology scale. |
Total Errors |
Cumulative NIC/bridge error count. |
Open |
Drill into active error conditions. |
MTU Issues |
Nodes with MTU mismatch/drift conditions. |
Informational |
Use |
Total Traffic |
Aggregate traffic volume across nodes. |
Informational |
Capacity and traffic trend review. |
Warning
MTU mismatches between bridges and interfaces can cause packet drops and unstable connectivity.
Step: Review Nodes View (Default)
When to Use: Use this to identify which host requires detailed bridge/interface/VXLAN investigation.
Purpose: Review node status and open a specific node for deeper network analysis.
Steps:
Open
Control Center -> Network -> Network Topology.Stay on the default
Nodesview.Review the host list.
Review physical link, top talker, offload, bridge, and VXLAN summary fields.
Use the row action to open node details.
Expected Outcome:
You can identify which node requires deeper bridge/interface/VXLAN inspection.
Nodes table:
Column |
Description |
|---|---|
Node |
Host IP or FQDN. Click to open node detail page. |
Physical Link |
Primary physical link state and interface name. |
Top Talker |
Highest-traffic interface or bridge on that node. |
Offloads |
LRO/GRO/TSO status summary. |
Anchor Bridge |
Primary bridge and MTU shown for the node. |
Bridges |
L2 bridge membership and MTU status. |
Active VXLANs |
Number of attached VXLAN interfaces. |
Actions |
Open node details. |
If this fails:
1. Refresh Nodes and clear any active filter.
2. Confirm node inventory is available in your environment.
3. Reopen Network Topology and retry node selection.
Step: Review Alerts Tab
When to Use: Use this when troubleshooting active network faults by severity and category.
Purpose: Review current network alerts and pivot to affected nodes for root-cause analysis.
Steps:
In Network Topology, click
Alerts.Filter by node when focusing investigation.
Open the affected node from the alert row.
Verify issue context in node detail tabs.
Expected Outcome:
You can isolate active network faults by severity/category and pivot directly to the affected node.
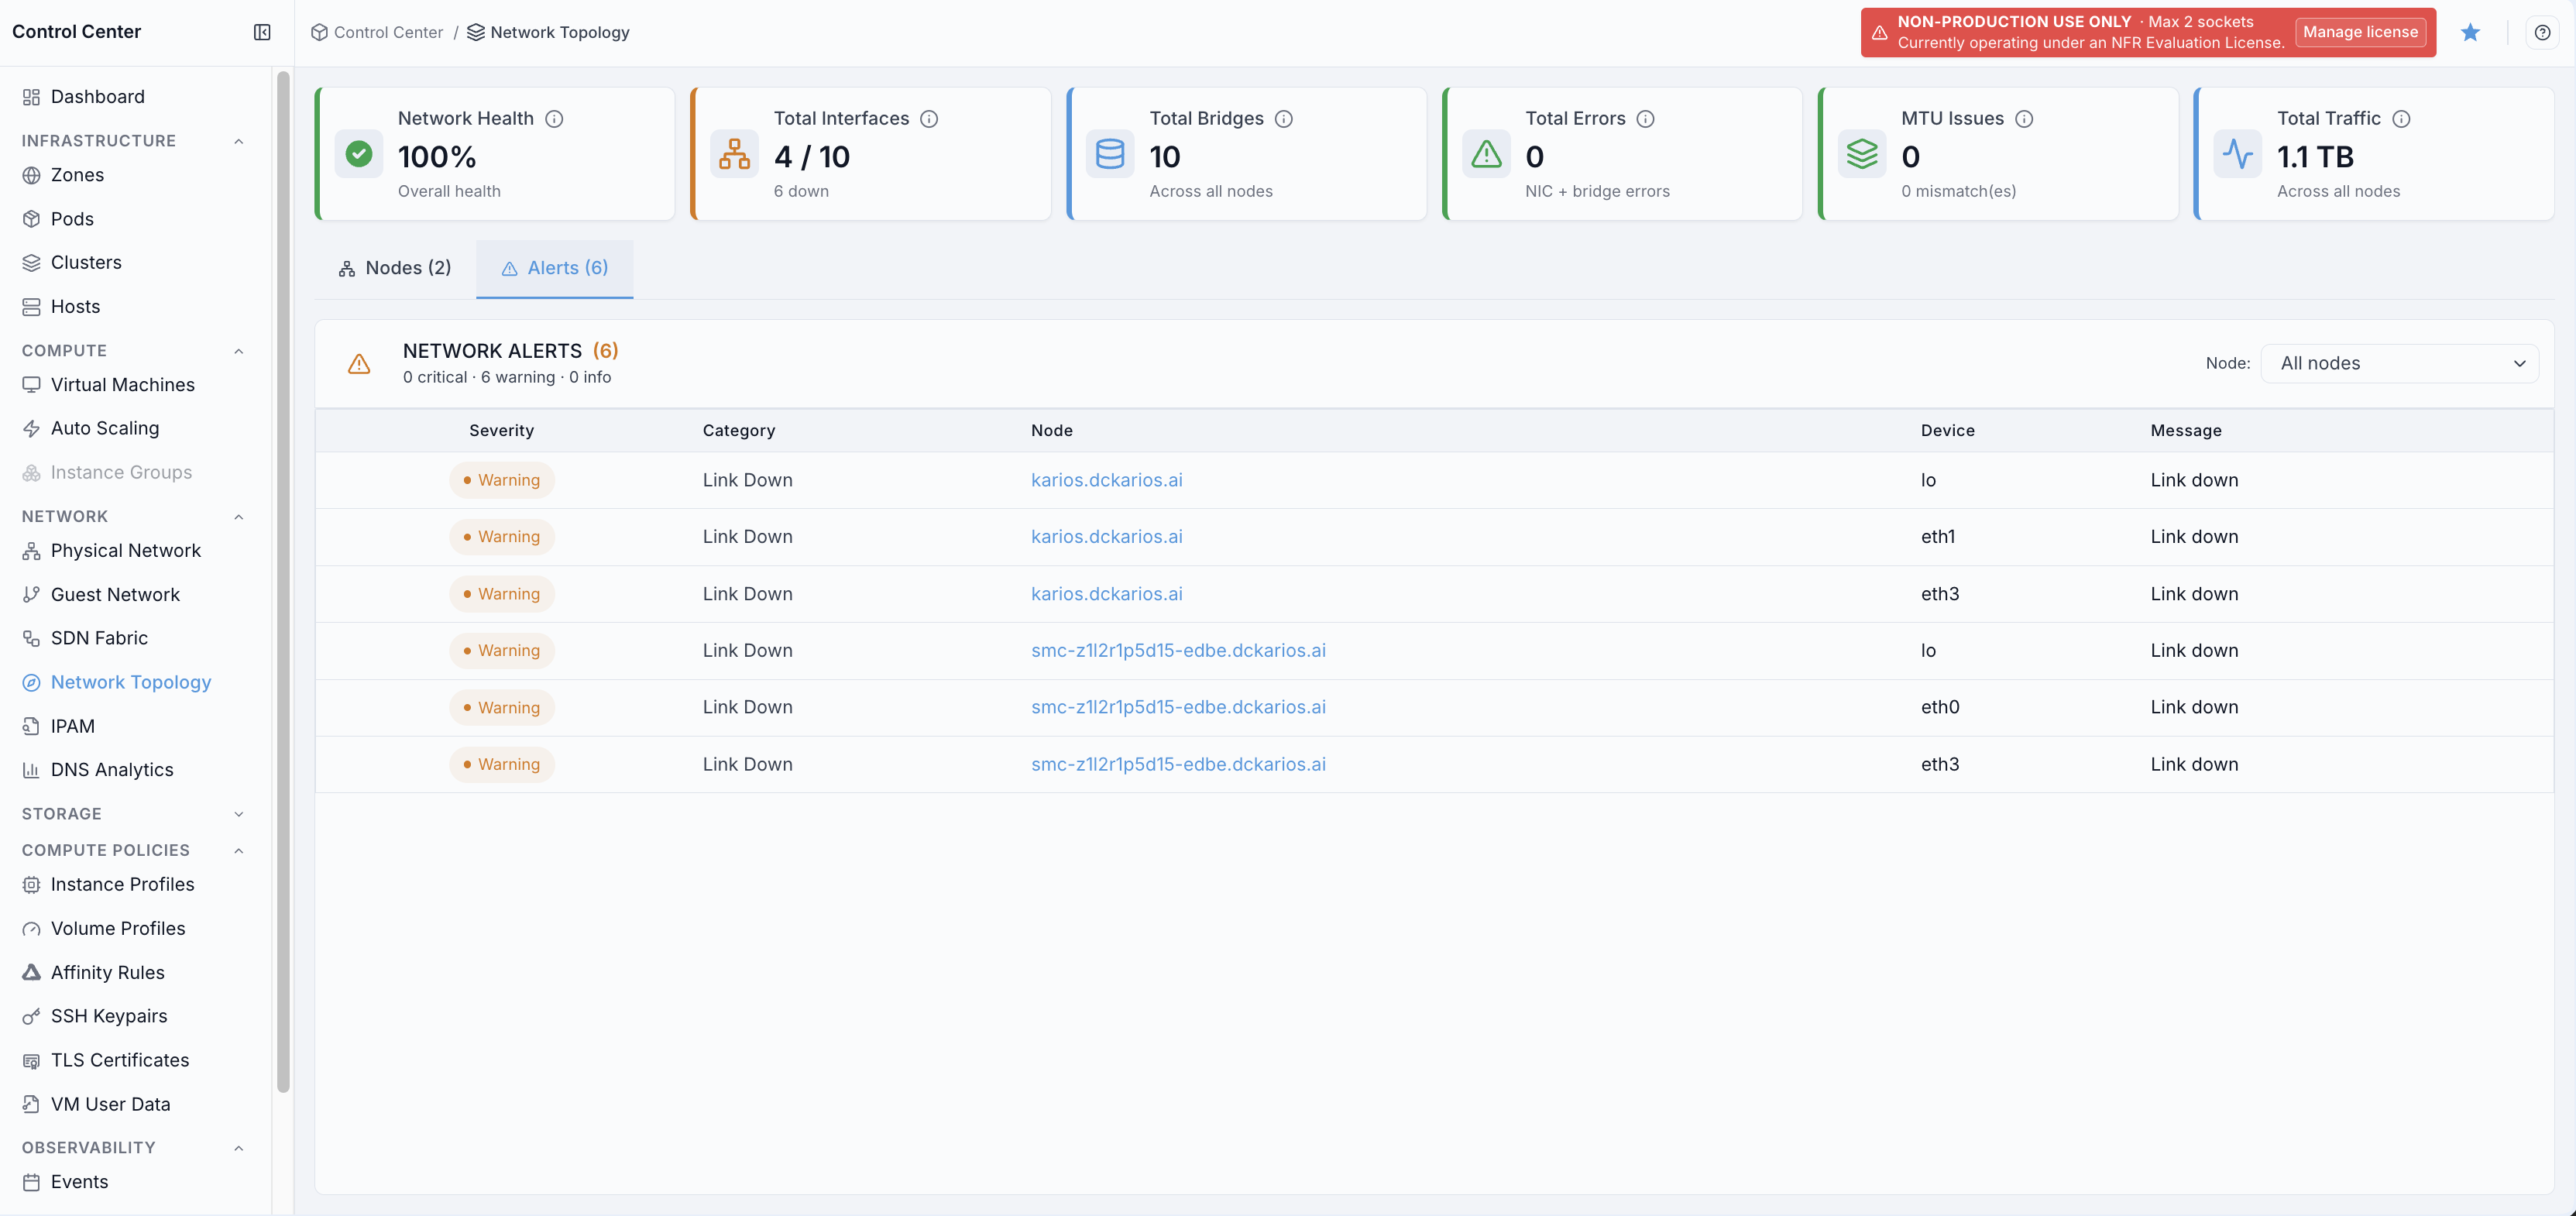
If this fails:
Reopen the
Alertstab and confirm alert stream data is loading.Confirm alert stream and node inventory are available.
Reopen
Network Topologyand retryAlertstab.
Network Alerts table:
Severity |
Category |
Node |
Device |
Message |
|---|---|---|---|---|
Critical/Warning/Info |
Link Down, Errors, MTU, MTU Drift |
Host where alert occurred |
Interface/bridge name |
Human-readable issue description |
Common alert categories:
Link Down: interface operational/admin downErrors: elevated RX/TX/CRC errorsMTU: MTU mismatch between connected componentsMTU Drift: inconsistent MTU values on the same node
Node Detail Page
Click any node from Nodes or Alerts to open node details.
The node detail view includes three operational tabs:
BridgesInterfacesVXLANs
Bridges Tab
When to Use:
Use this when network issues point to bridge state, bridge membership, carrier loss, or bridge-level errors.
Purpose:
Validate Linux bridge health and identify which bridge/member is causing impact.
Steps:
Open
Control Center -> Network -> Network Topology.In
Nodes, click the target node to open node details.Open the
Bridgestab.Review cards and bridge rows for state, MTU, members, carrier, and error indicators.
Expected Outcome:
You can confirm whether bridge-layer connectivity is healthy.
You can identify the affected bridge/member for follow-up action.
If this fails:
Refresh node details and reopen
Bridges.Confirm the node is online in
Nodes.Retry from the related
Alertsrow for the same node.
Use this tab to inspect Linux bridge state, membership, and error counters.
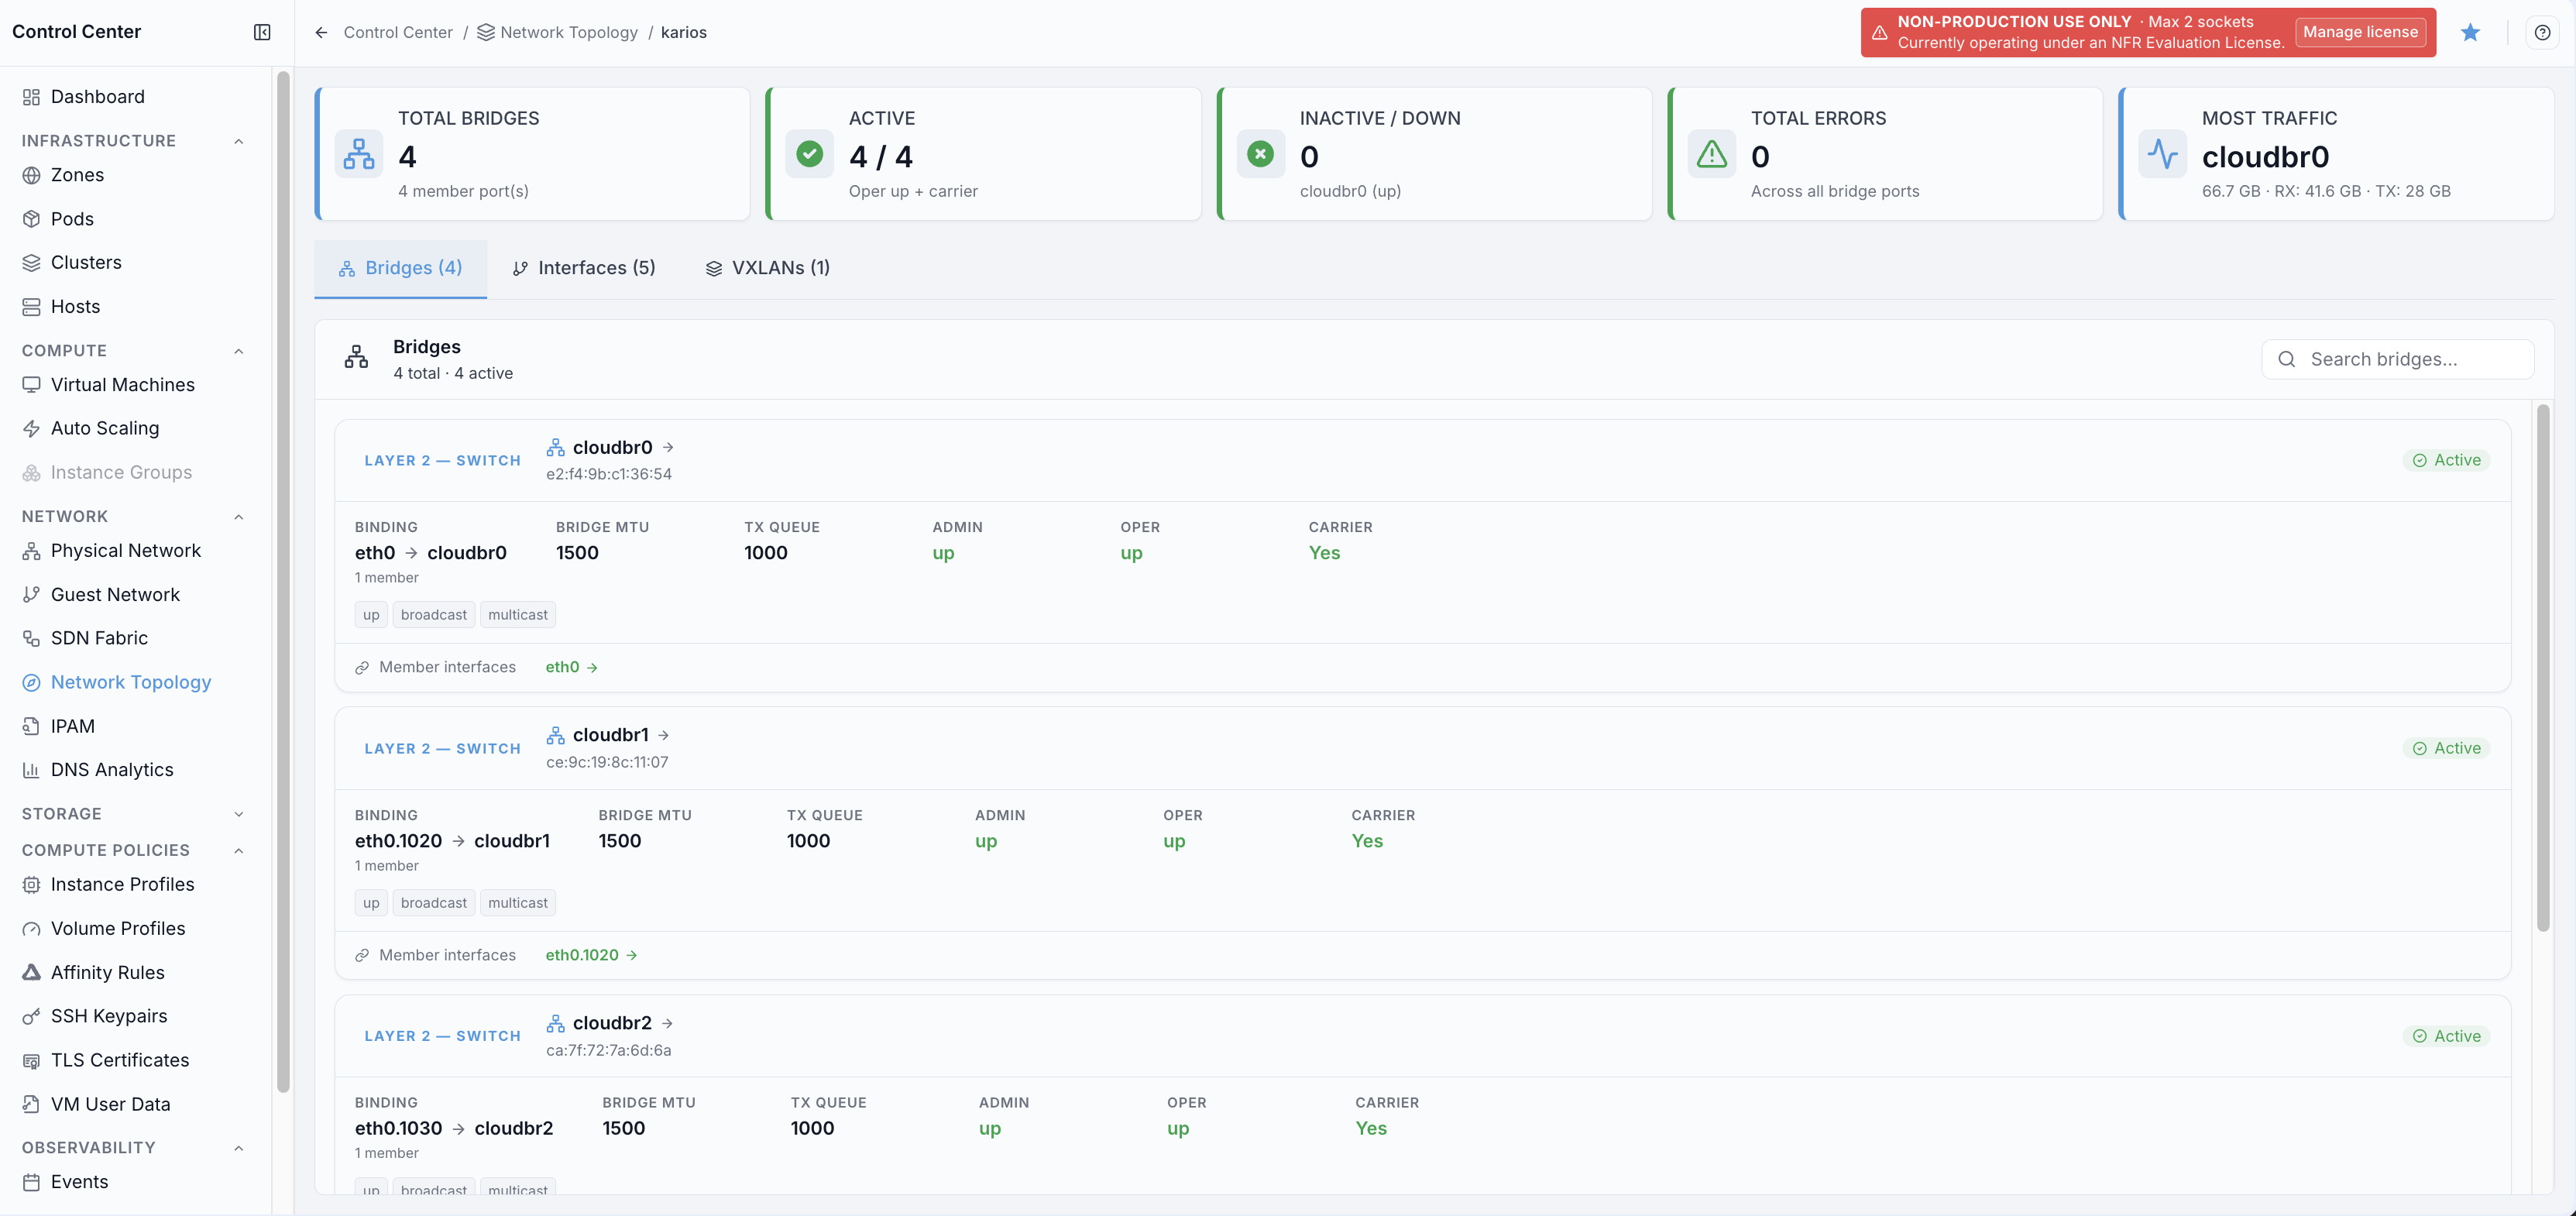
Bridge details page:
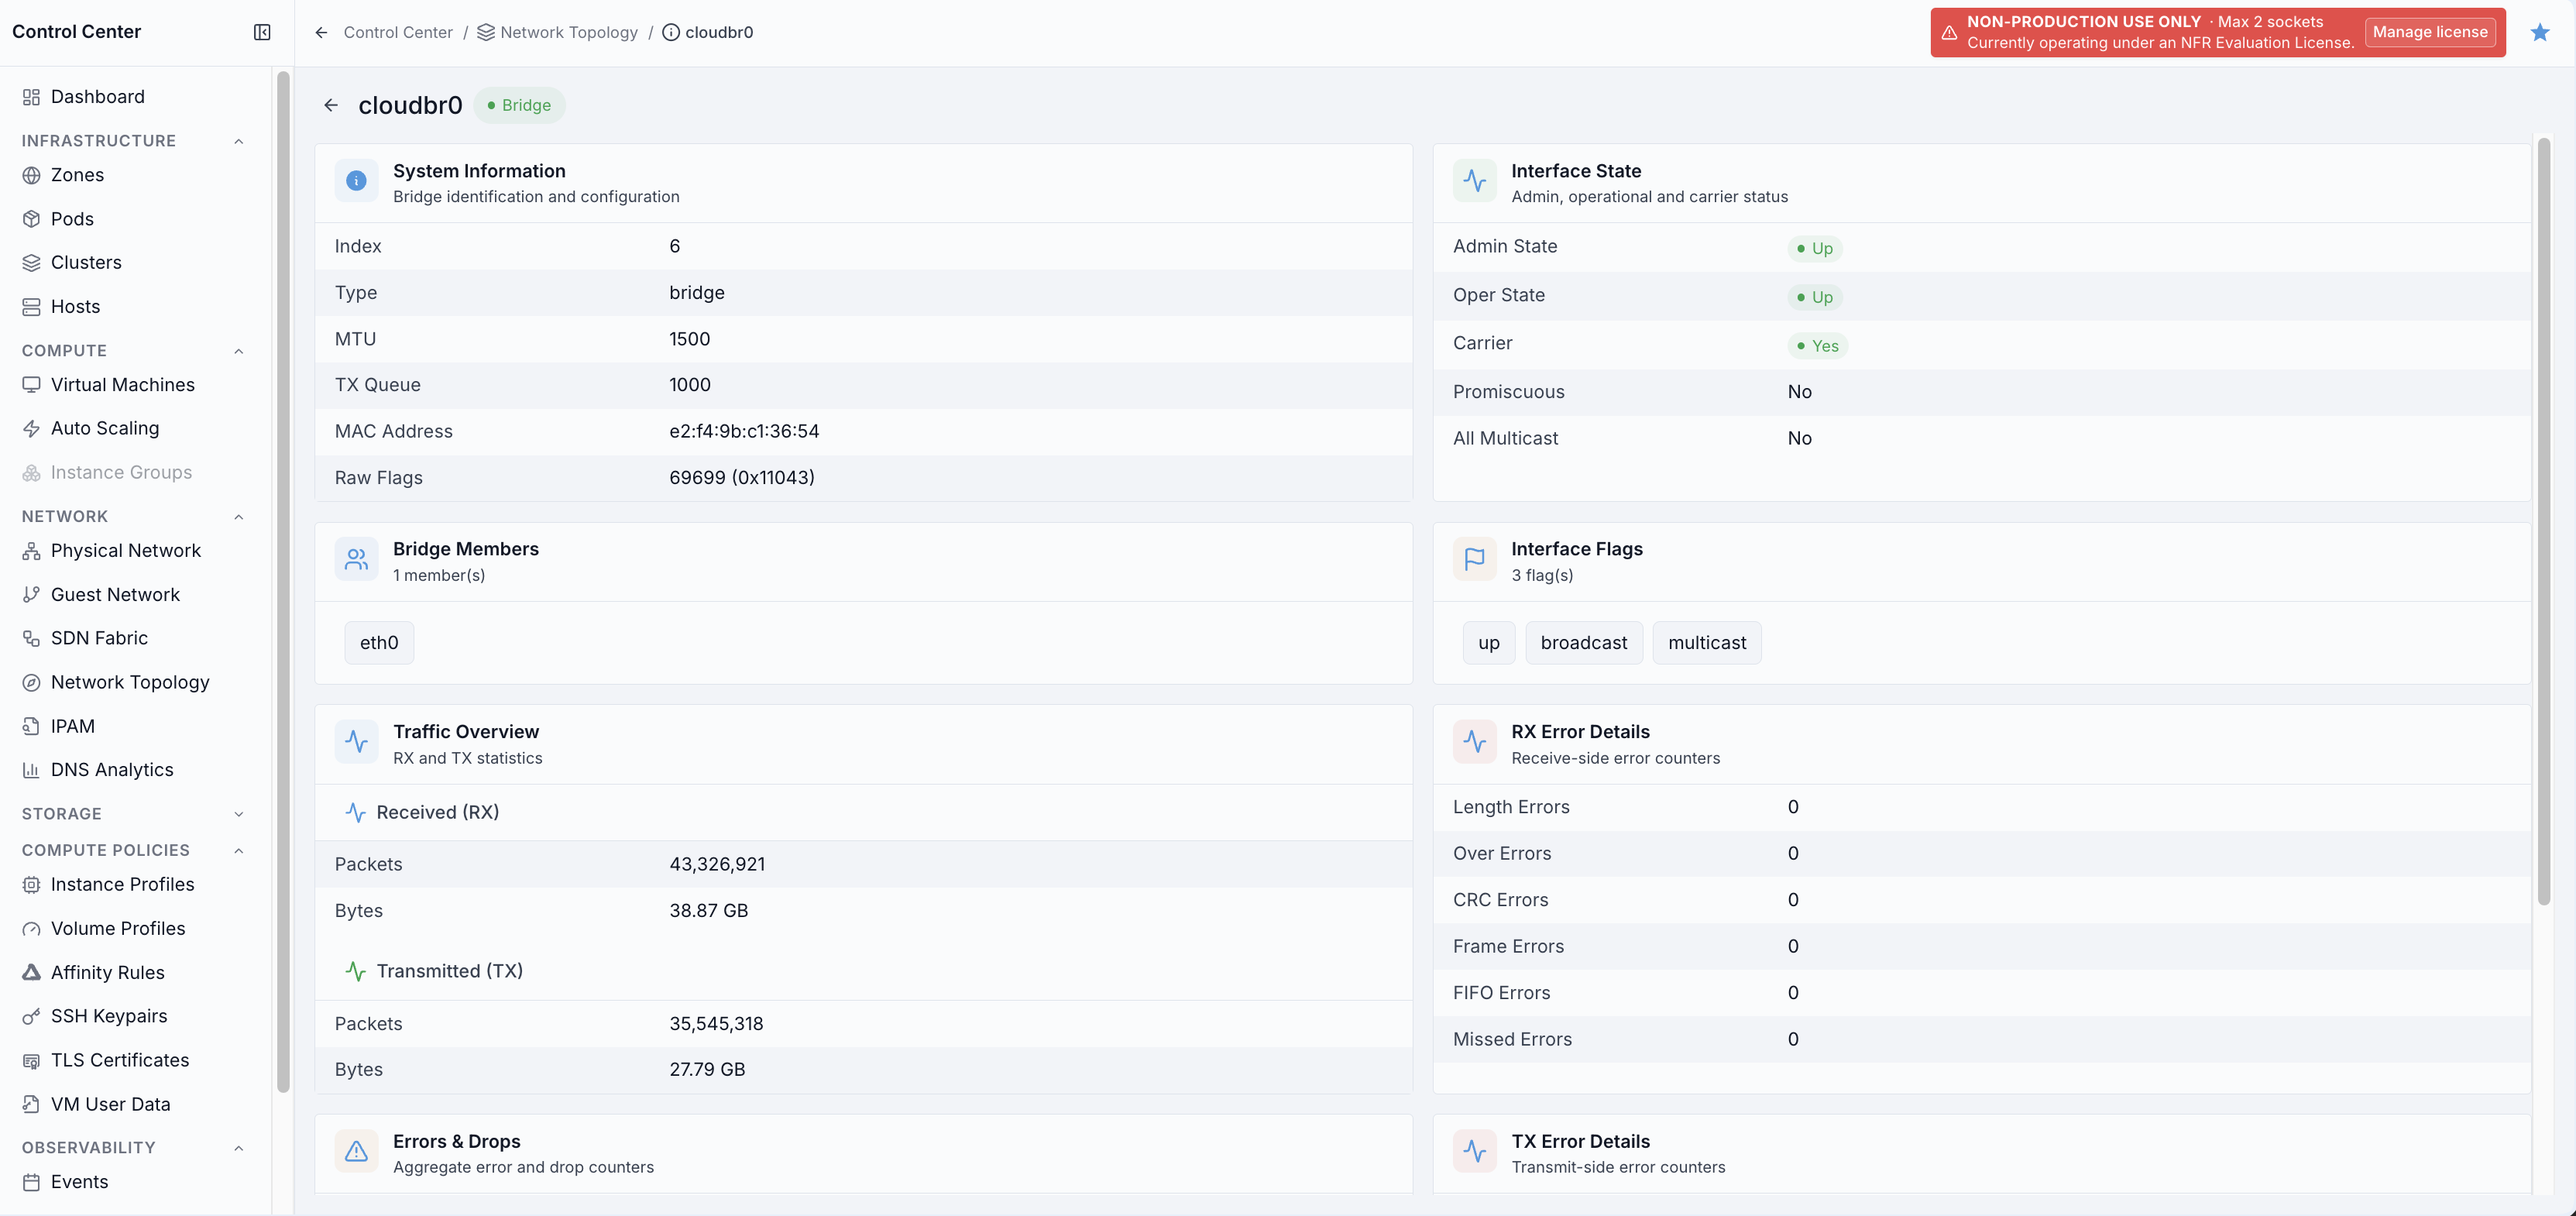
Bridge stats cards include:
Total bridges
Active
Inactive/Down
Total errors
Most traffic
Bridge row details include:
Name (for example
cloudbr0)Layer type and MAC address
Binding/member interface
Bridge MTU and TX queue
Admin, operational, and carrier state
Flags and member interfaces
Traffic, error, and drop counters
Interfaces Tab
When to Use:
Use this when you need NIC-level or virtual-interface-level status and packet counters.
Purpose:
Verify interface state, drops, and errors to isolate link or port-level faults.
Steps:
Open
Control Center -> Network -> Network Topology.In
Nodes, click the target node to open node details.Open the
Interfacestab.Review links-up, error, and drop counters and check affected interface rows.
Expected Outcome:
You can identify which interface is down, noisy, or dropping traffic.
You can separate interface faults from bridge or overlay faults.
If this fails:
Refresh node details and reopen
Interfaces.Confirm interface telemetry is available for the node.
Cross-check with
Alertsfor the same node/device.
Use this tab to inspect physical and virtual interface health and counters.
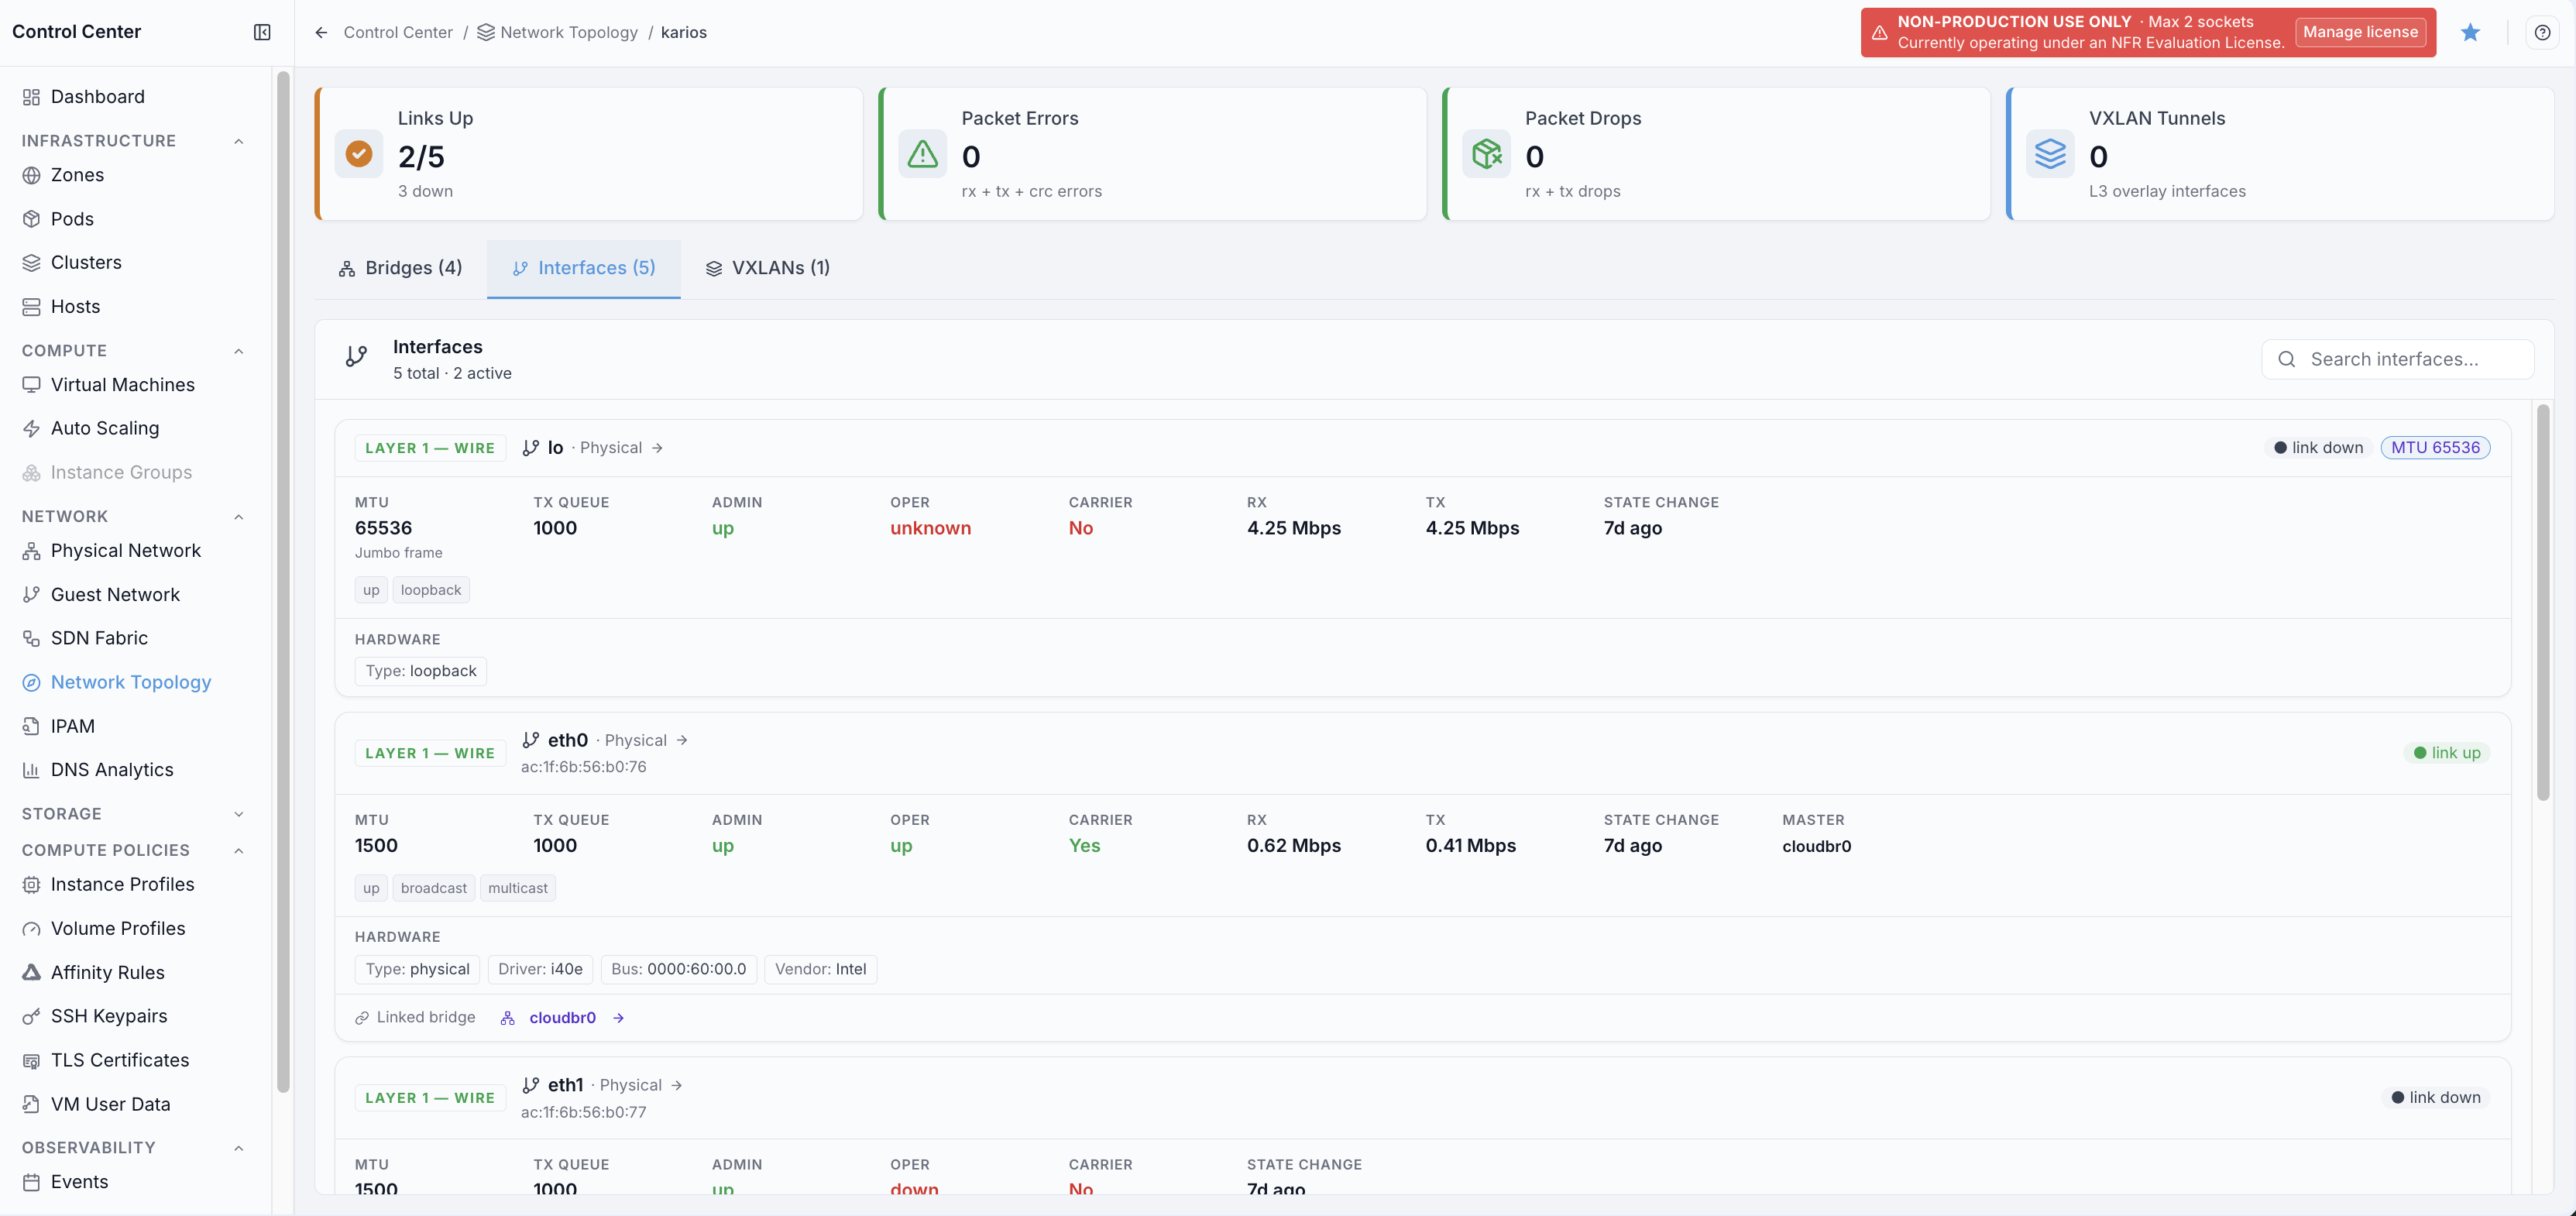
Interface stats cards include:
Links up
Packet errors
Packet drops
VXLAN tunnels
Interface table fields include:
Interface
Layer and type
Master
MTU
TX queue
Admin, operational, and carrier state
RX/TX traffic
State change age
Hardware details and linked bridge
VXLANs Tab
When to Use:
Use this when overlays are suspected (cross-host VM connectivity, VNI spread, tunnel state).
Purpose:
Validate VXLAN tunnel health and VNI participation on the selected node.
Steps:
Open
Control Center -> Network -> Network Topology.In
Nodes, click the target node to open node details.Open the
VXLANstab.Review tunnel state, VNI values, local/remote endpoint fields, and error/drop counters.
Expected Outcome:
You can confirm whether VXLAN tunnels are up and VNIs are present as expected.
You can identify overlay mismatches for targeted SDN follow-up.
If this fails:
Refresh node details and reopen
VXLANs.Verify the node has active VXLAN interfaces in this environment.
Cross-check with
SDN FabricEVPN/VNI views.
Use this tab to inspect overlay tunnels and VNI participation state.
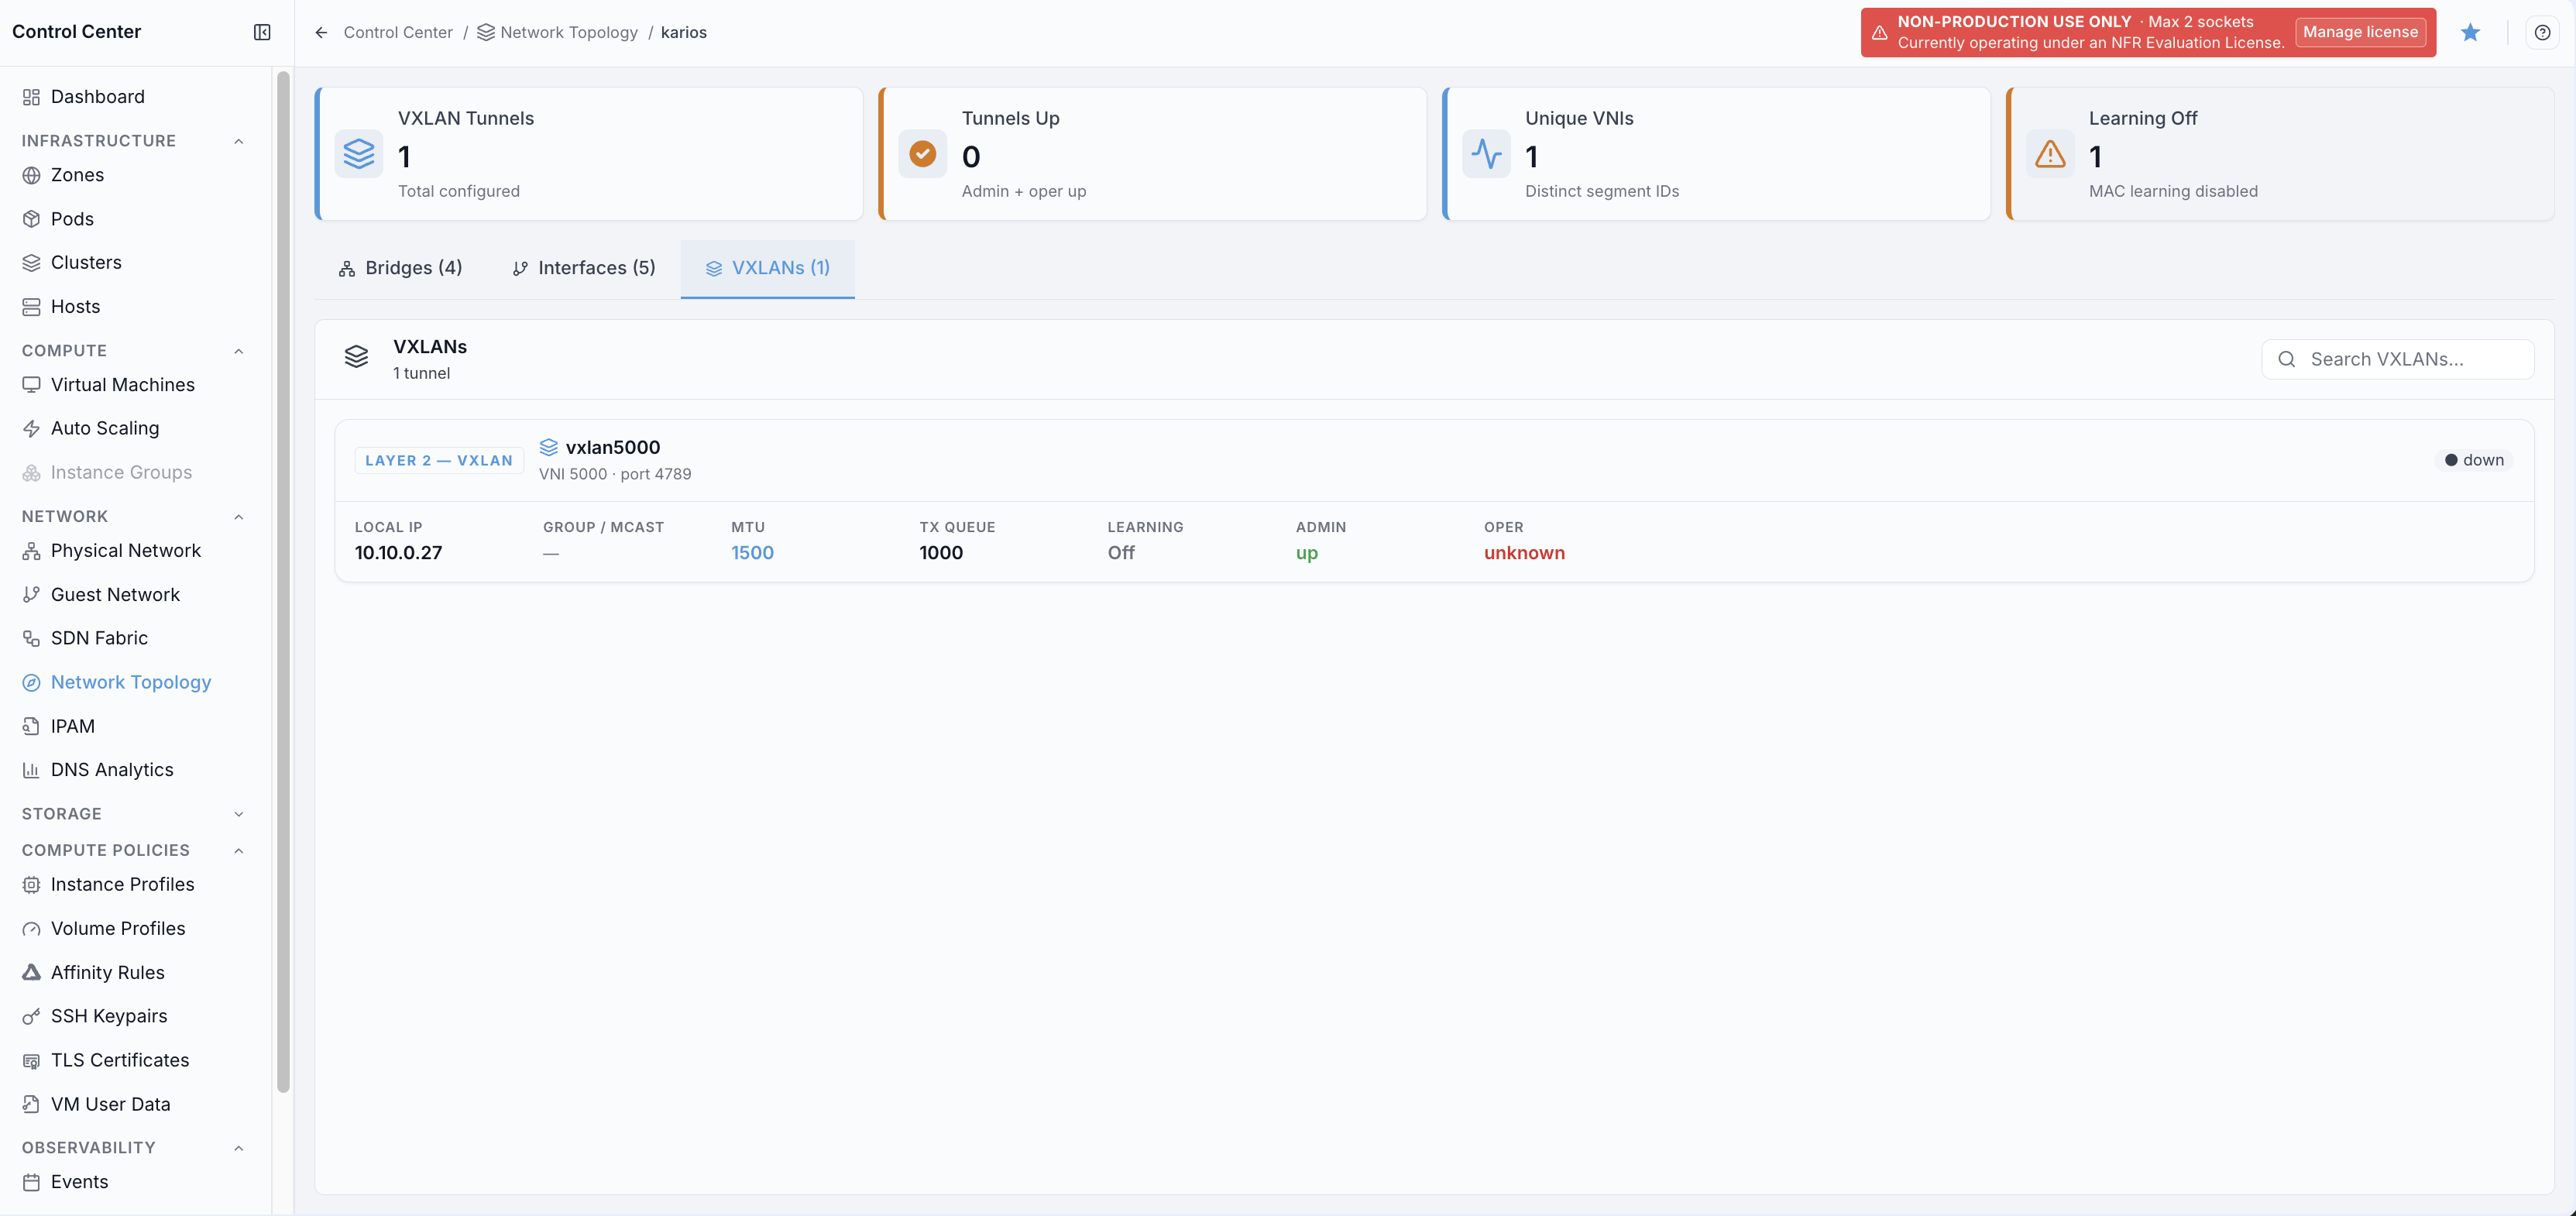
VXLAN stats cards include:
VXLAN tunnels
Tunnels up
Unique VNIs
Learning off
VXLAN card fields include:
Name
VNI
Local IP
Group/multicast value
MTU and TX queue
Learning state
Admin and operational state
Common Tasks
Check network health: start from
Network Health, then move toAlertswhen degraded.Investigate errors: open
Total Errorsand filter by node/device.Inspect a node: open node details and compare
Bridges,Interfaces, andVXLANs.Find MTU issues: use
MTU IssuesandAlertscategoriesMTUorMTU Drift.Verify overlay status: in
VXLANs, confirmTunnels Upaligns with expected tunnel count.
6. IPAM
Use IPAM (IP Address Management) to audit IP addresses, VLANs, and DHCP scopes across your environment.
IPAM helps with:
Address-capacity planning
Assignment and ownership audit
VLAN/subnet consistency checks
DNS and DHCP alignment validation
Term Definitions:
IPAM: IP Address Management, inventory and lifecycle tracking of IP resources.Prefix: subnet in CIDR form (for example192.168.10.0/24).VRF: Virtual Routing and Forwarding instance that isolates routing tables.Gateway: default next hop for traffic leaving a subnet.
Step: Open IPAM
When to Use: Use this for IP, VLAN, and DHCP capacity and assignment audits.
Purpose: Open IPAM to baseline address inventory, segmentation, and scope utilization.
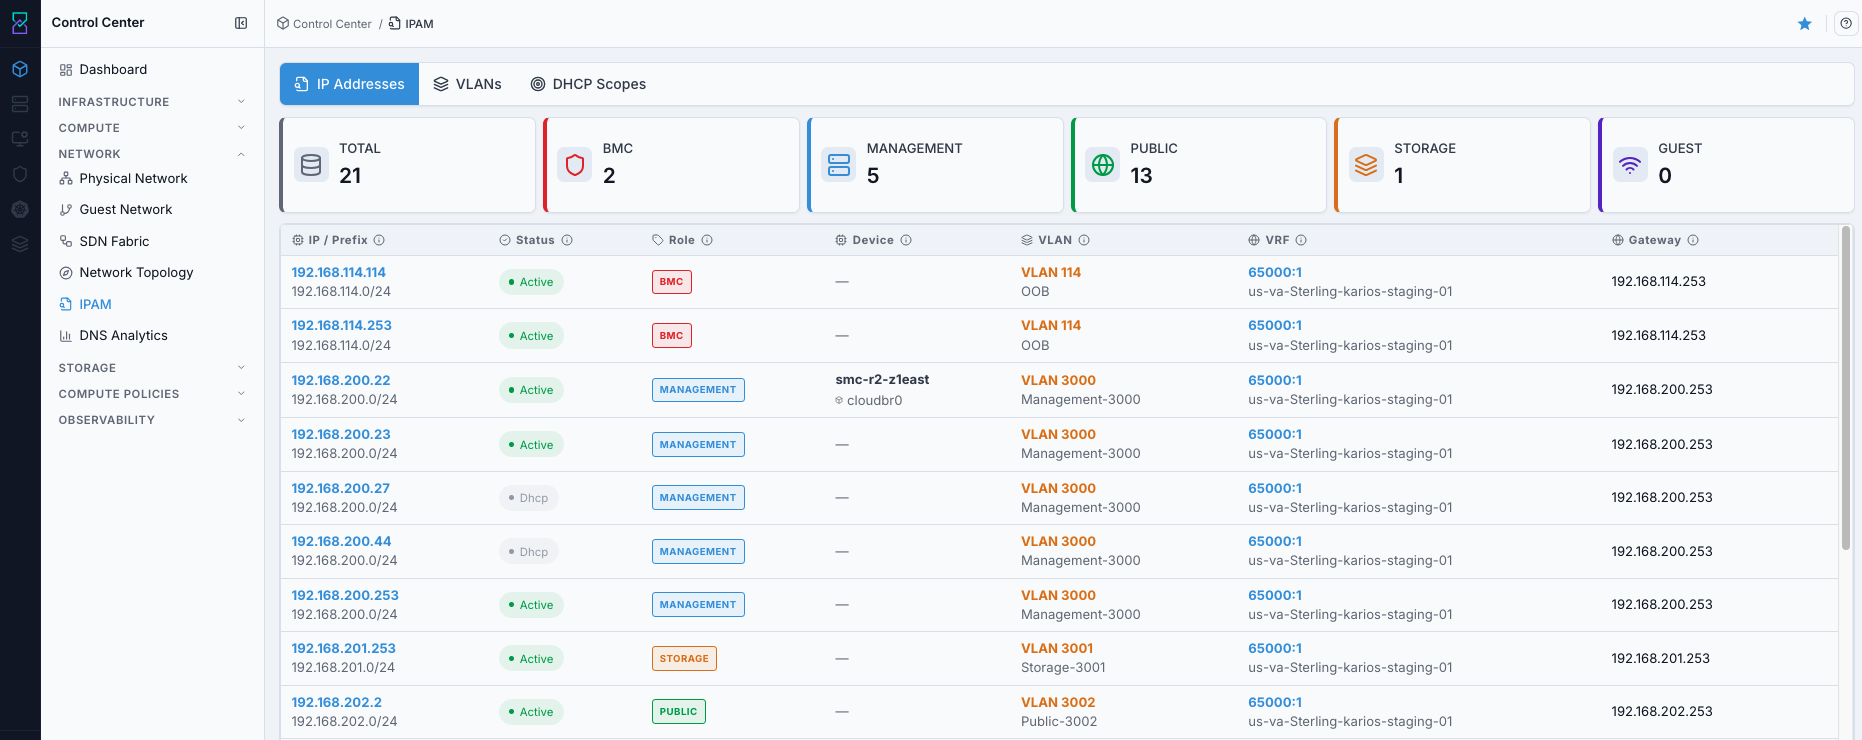
Dashboard shows:
Summary cards for total counts and role-based filters.
Three operational tabs:
IP Addresses,VLANs, andDHCP Scopes.Addressing inventory and utilization context across the environment.
What you can do from this screen:
Audit address ownership and availability.
Validate VLAN/subnet/gateway consistency.
Check DHCP scope utilization before deployment.
Steps:
Open
Control Center -> Network -> IPAM.Review the top summary cards.
Switch between
IP Addresses,VLANs, andDHCP Scopestabs.
Expected Outcome:
You can baseline addressing health, segmentation, and DHCP utilization from one page.
If this fails:
Reopen
IPAMand return toIP Addressesbefore retrying tab navigation.Confirm your account can access
IPAM.Confirm IPAM data sources are available in your environment.
Step: Open IPAM Help Panel
When to Use: Use this after opening IPAM when you need field and role definitions.
Purpose: Open page help separately from dashboard review.
Steps:
Open
Control Center -> Network -> IPAM.Click the top-right help icon.
Review and search the help panel content.
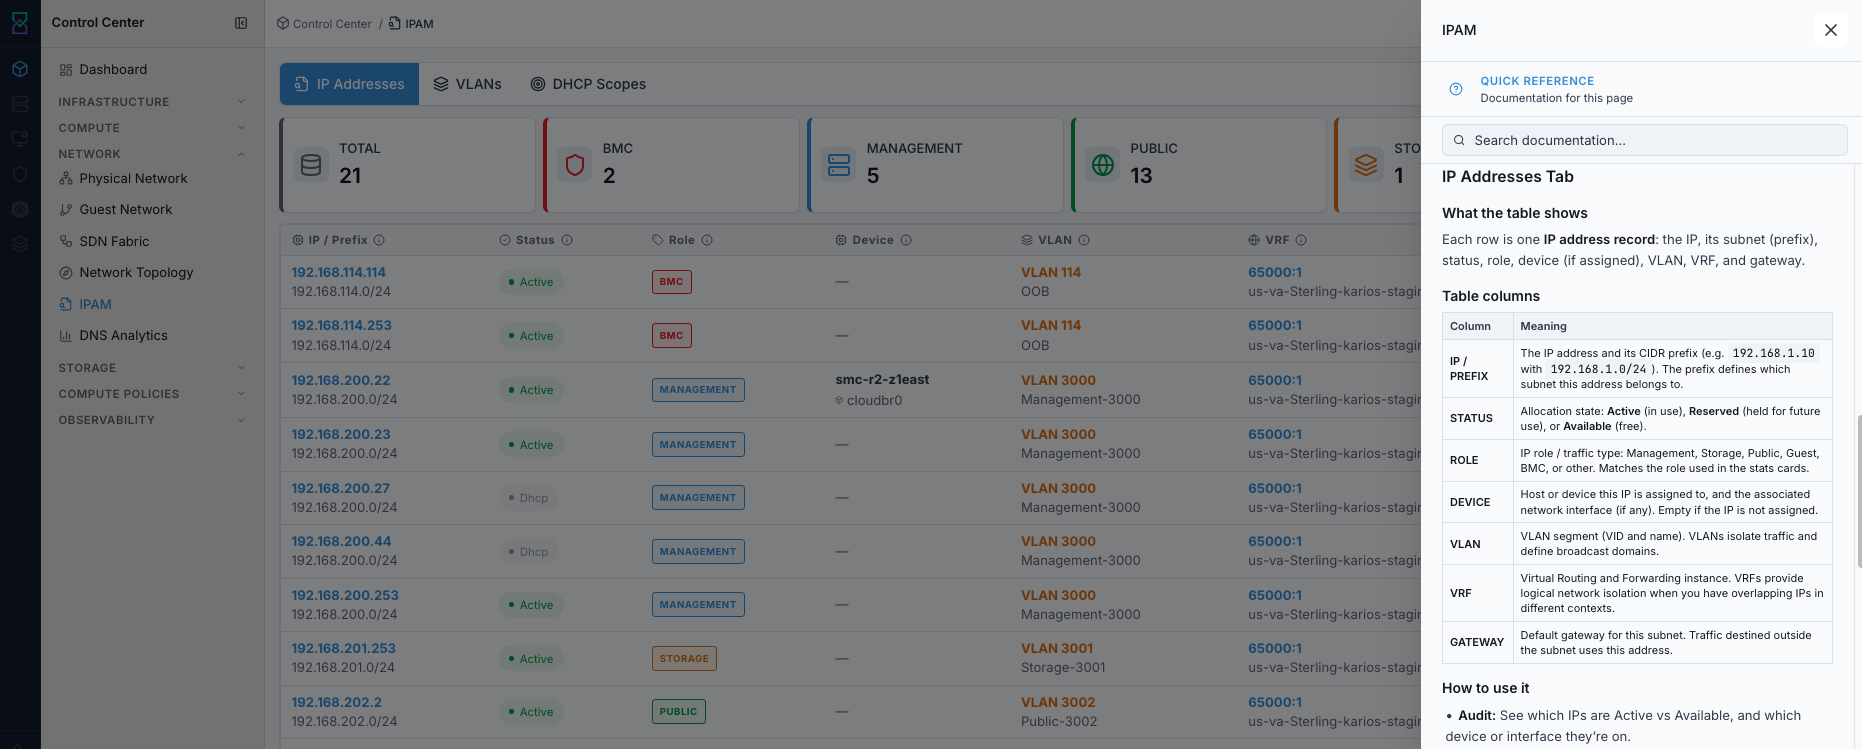
Expected Outcome:
IPAM help opens in the right-side panel.
You can continue tab-level operations with clearer context.
If this fails:
Refresh the page and click the help icon again.
Confirm your account can access in-product help content.
Retry after reopening
IPAM.
Tabs Overview
When to Use:
Use this before analysis when deciding which IPAM tab matches your goal.
Purpose:
Select the correct tab first so you review the right dataset.
Steps:
Open
Control Center -> Network -> IPAM.Review available tabs:
IP Addresses,VLANs,DHCP Scopes.Select the tab that matches your current task.
Expected Outcome:
You select the correct tab before filtering or troubleshooting.
If this fails:
Refresh IPAM and confirm tabs render correctly.
Confirm your account can access all IPAM tabs.
Reopen IPAM and retry tab selection.
Tab |
What It Shows |
|---|---|
IP Addresses |
IP records with status, role, device, VLAN, VRF, and gateway. |
VLANs |
VLAN segments with role, prefix, gateway, DNS zone, and linked DHCP scope. |
DHCP Scopes |
DHCP subnets with role, VLAN, gateway, and utilization. |
Stats Cards (Summary Bar)
When to Use:
Use this to get a quick role-based snapshot before drilling into table rows.
Purpose:
Use card counts and role filters to narrow data quickly.
Steps:
Open
Control Center -> Network -> IPAM.Stay on the target tab (
IP Addresses,VLANs, orDHCP Scopes).Click
TOTALto show all rows.Click a role card (
BMC,MANAGEMENT,PUBLIC,STORAGE,GUEST) to filter.Click the same role again or
TOTALto clear filter.
Expected Outcome:
Card counts provide immediate distribution context.
Table rows are filtered to the selected role.
If this fails:
Clear filters with
TOTALand retry.Refresh the page and reapply the role filter.
Confirm role-tagged data exists for the current tab.
At the top of each tab, cards show counts and provide role-based filters.
TOTAL card:
Meaning: total row count for the current tab.
Click action: clears role filtering (shows all rows).
Role cards (BMC, MANAGEMENT, PUBLIC, STORAGE, GUEST):
Meaning: item count for that role category.
Click action: filter current tab to selected role.
Click the same role again or click
TOTALto clear filter.
Role guidance:
BMC: out-of-band management addressing.MANAGEMENT: control-plane and host-management addressing.PUBLIC: external/public addressing.STORAGE: storage-network addressing.GUEST: workload/tenant network addressing.
IP Addresses Tab
When to Use
Use this when auditing IP ownership, allocation state, and subnet context.
Purpose
Review IP-level records to identify active, reserved, and available addresses.
Steps
Open
Control Center -> Network -> IPAM.Click
IP Addresses.Optional: apply role filter cards.
Review key columns:
IP / PREFIX,STATUS,ROLE,DEVICE,VLAN,VRF,GATEWAY.Open row details for deeper assignment context when needed.
Expected Outcome
You can confirm IP assignment, state, and routing context for affected records.
If this fails
Clear role filters by clicking
TOTAL.Verify the expected subnet exists in
VLANs.Refresh and reopen
IP Addresses.
Each row represents one IP address record and its network context.
Table columns:
Column |
Meaning |
|---|---|
IP / PREFIX |
IP address and associated CIDR subnet. |
STATUS |
|
ROLE |
Traffic/purpose role of the IP. |
DEVICE |
Assigned host/device and interface context when allocated. |
VLAN |
VLAN segment identifier and name. |
VRF |
Routing instance context. |
GATEWAY |
Default gateway for the subnet. |
How to use:
Audit active vs available capacity.
Filter by role cards for targeted views.
Open row details for full assignment context.
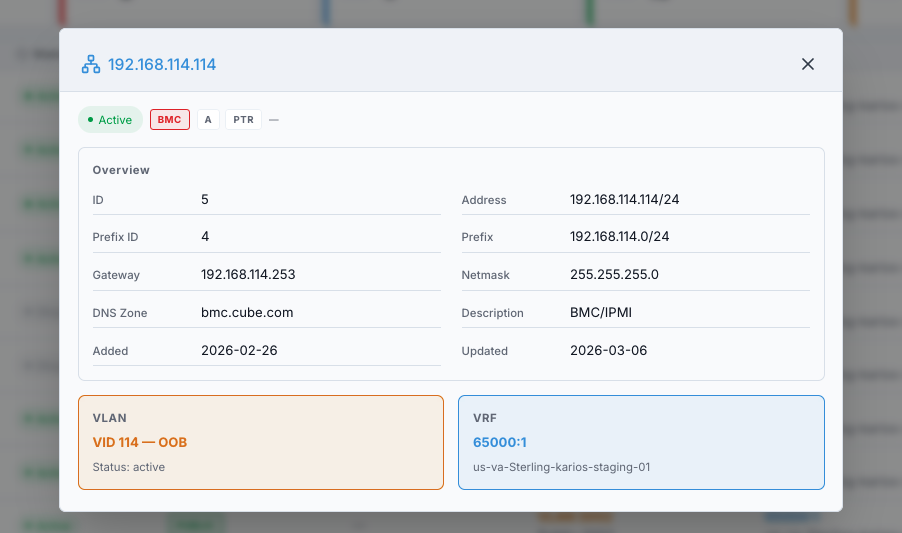
VLANs Tab
When to Use
Use this when validating VLAN segmentation, subnet mapping, and DNS/DHCP linkage.
Purpose
Review VLAN-level design and ensure prefix, gateway, and service mappings are consistent.
Steps
Open
Control Center -> Network -> IPAM.Click
VLANs.Optional: apply role filter cards.
Review
VID / NAME,ROLE,PREFIX,GATEWAY,DNS ZONE, andDHCP SCOPE.
Expected Outcome
You can verify VLAN segmentation and associated L3/service mappings.
If this fails
Clear role filters with
TOTAL.Confirm VLAN inventory is available for the current environment.
Refresh and reopen
VLANs.
Each row represents one VLAN segment and its L3/DNS/DHCP associations.
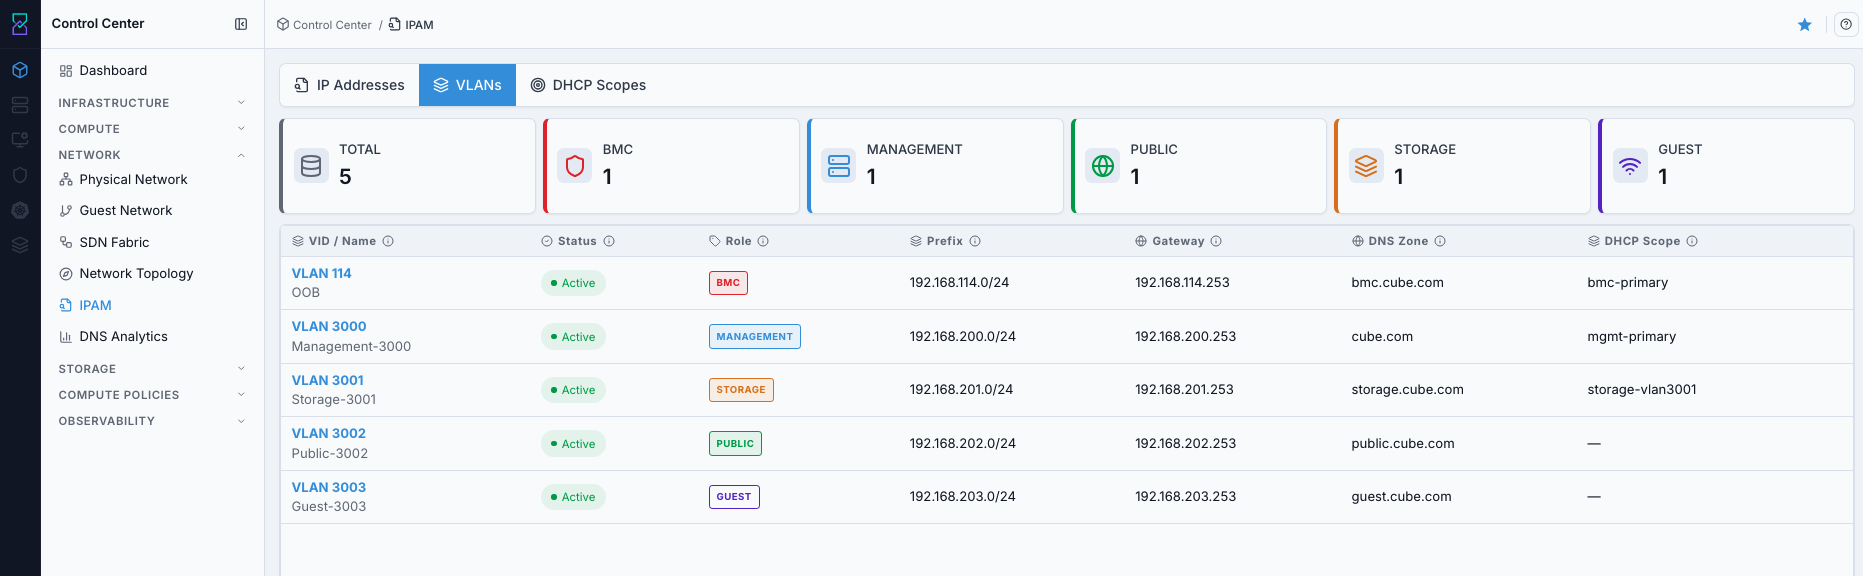
Table columns:
Column |
Meaning |
|---|---|
VID / NAME |
VLAN identifier and VLAN name. |
STATUS |
Operational or reserved state. |
ROLE |
Traffic role for this VLAN. |
PREFIX |
Associated CIDR subnet. |
GATEWAY |
Default gateway for the VLAN subnet. |
DNS ZONE |
DNS zone associated with this subnet. |
DHCP SCOPE |
Linked DHCP scope name when DHCP is in use. |
How to use:
Validate segmentation design by role.
Confirm VLAN prefix and gateway values.
Verify DNS zone and DHCP scope alignment.
DHCP Scopes Tab
When to Use
Use this before provisioning workloads to check scope utilization and exhaustion risk.
Purpose
Review DHCP capacity and subnet consistency for reliable IP assignment.
Steps
Open
Control Center -> Network -> IPAM.Click
DHCP Scopes.Optional: apply role filter cards.
Review
PREFIX,VLAN,GATEWAY, andUTILIZATION.
Expected Outcome
You can identify scopes approaching exhaustion and plan expansion before deployments fail.
If this fails
Clear role filters with
TOTAL.Confirm DHCP scope data exists for the selected environment.
Refresh and reopen
DHCP Scopes.
Each row represents a DHCP scope and its subnet utilization.
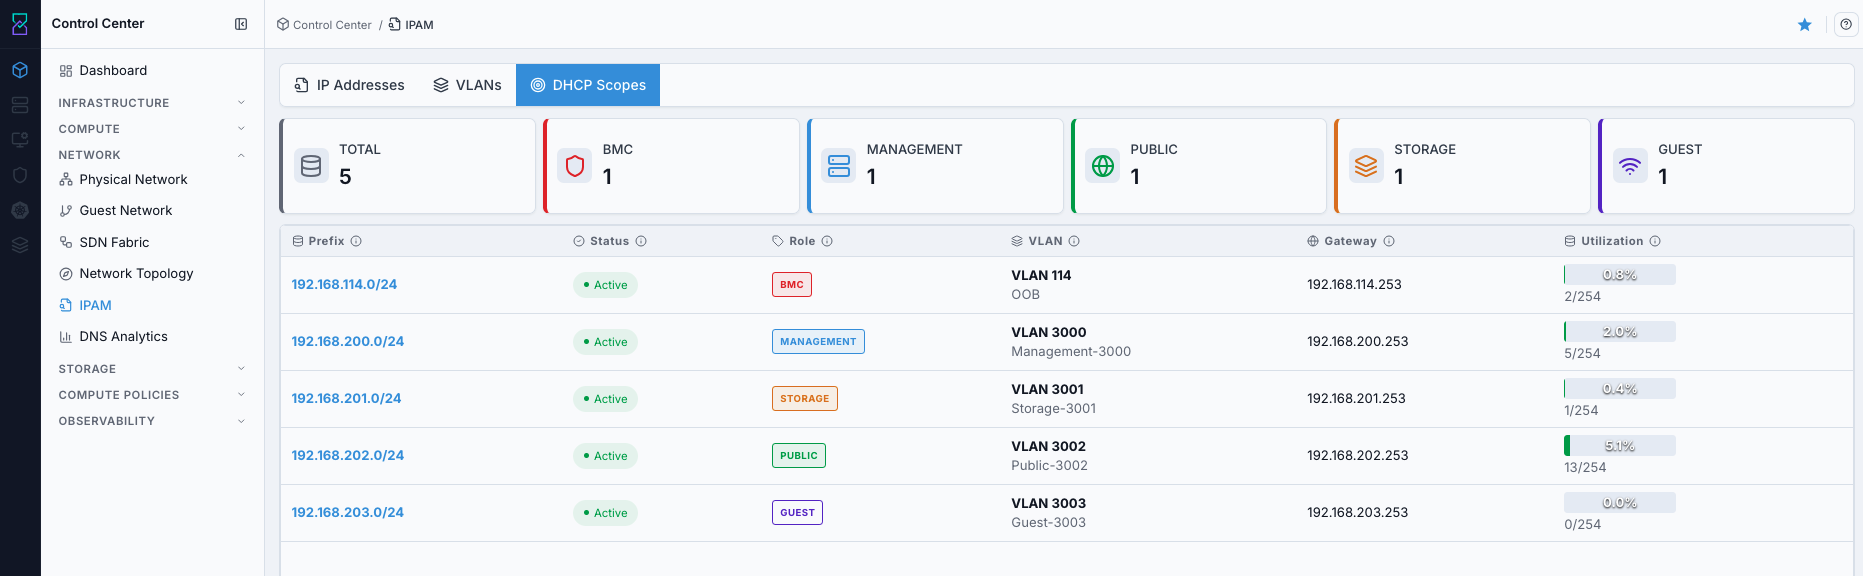
Table columns:
Column |
Meaning |
|---|---|
PREFIX |
CIDR subnet used for the DHCP scope. |
STATUS |
Scope state. |
ROLE |
Traffic role for the scope. |
VLAN |
VLAN tied to this scope. |
GATEWAY |
Default gateway for the scope subnet. |
UTILIZATION |
Used addresses vs total available in scope. |
How to use:
Track utilization to prevent scope exhaustion.
Confirm subnet/gateway/VLAN consistency.
Use role filters for targeted capacity review.
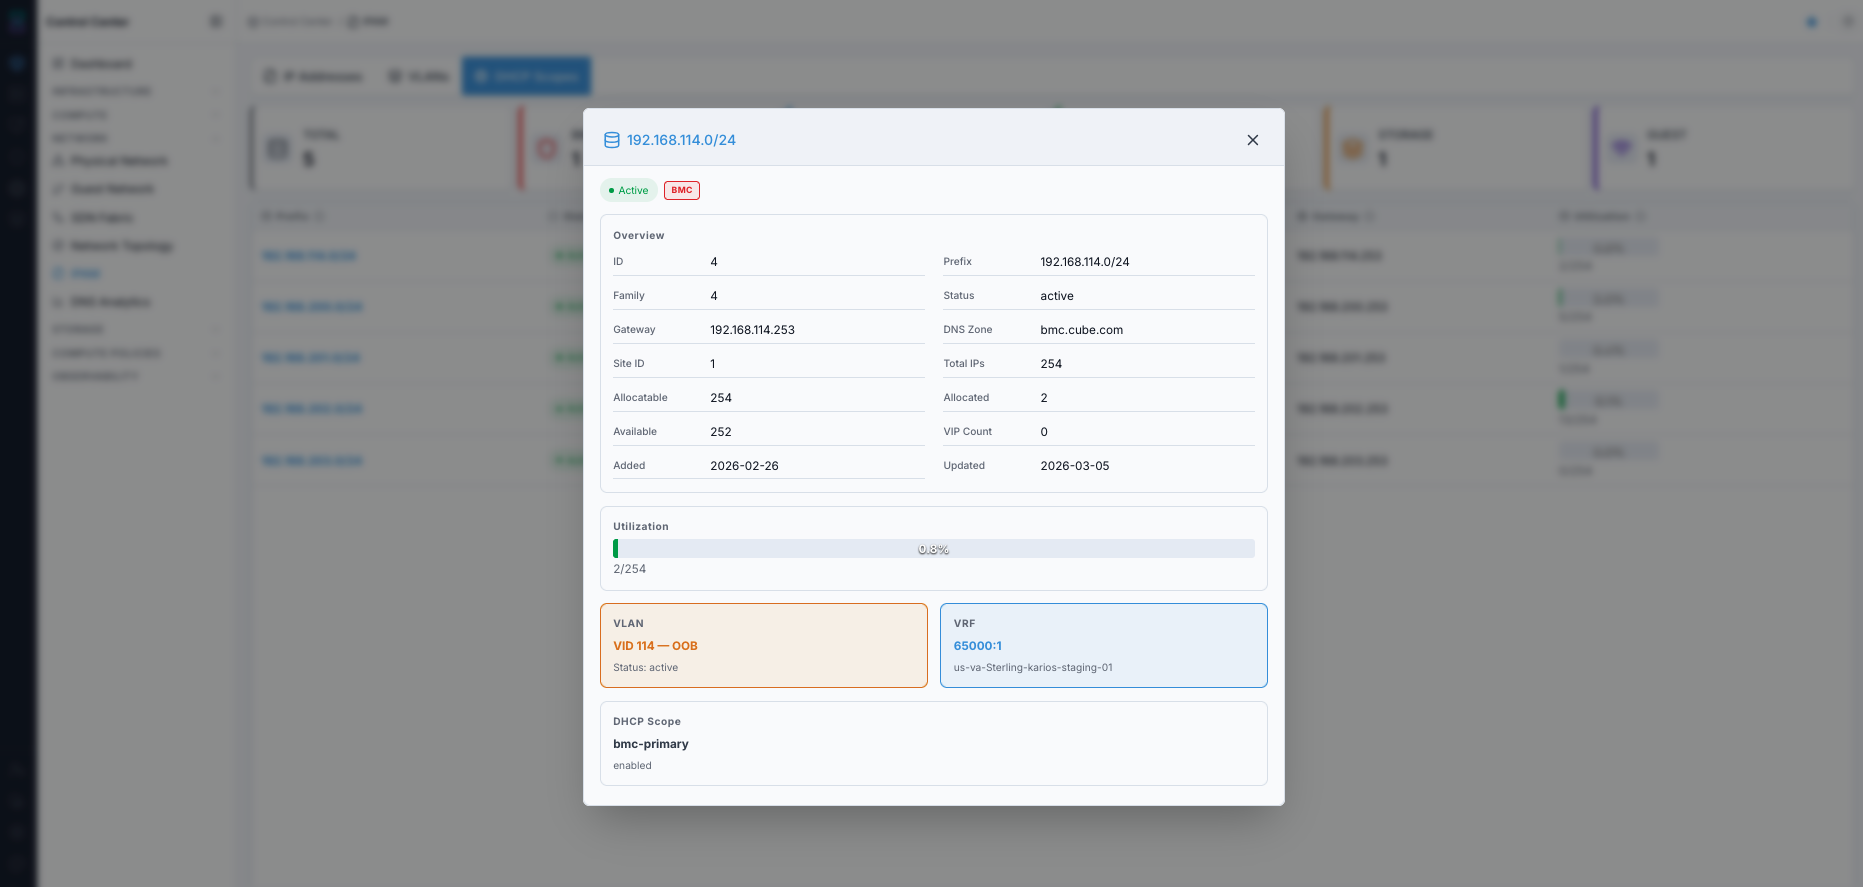
Quick Reference
Goal |
Where to Go |
|---|---|
Audit IP assignments by role |
|
Review VLAN segments and prefixes |
|
Prevent DHCP exhaustion |
|
Check VLAN DNS/DHCP linkage |
|
Tips
Start with
TOTALfirst, then apply role cards to avoid false conclusions from filtered views.Review
DHCP Scopesutilization before adding new VM batches.Use
IP Addressestab when validating host/VM assignment issues.
Warnings
DHCP scope utilization near exhaustion can block new VM IP allocation.
Inconsistent
VLAN/PREFIX/GATEWAYvalues across tabs can indicate configuration drift.
Troubleshooting
Empty table unexpectedly: clear role filter by clicking
TOTALand verify no search filter is active.Expected IP missing: check the correct role card and confirm the subnet exists in
VLANs.Scope running out of addresses: expand the subnet scope or add a new scope before provisioning more workloads.
7. DNS Analytics
Use DNS Analytics to monitor query volume, response outcomes, top clients/domains, and protocol/query-type distribution over time.
Term Definitions:
NXDOMAIN: DNS response meaning the queried name does not exist.SERVFAIL: DNS server failure while processing a query.Authoritative: response served from authoritative zone data.DoT: DNS over TLS (encrypted DNS transport).DoH: DNS over HTTPS (encrypted DNS transport over HTTPS).
Step: Open DNS Analytics
When to Use: Use this when reviewing DNS traffic trends, error classes, and top sources.
Purpose: Open DNS Analytics to baseline DNS query behavior for the selected time range.
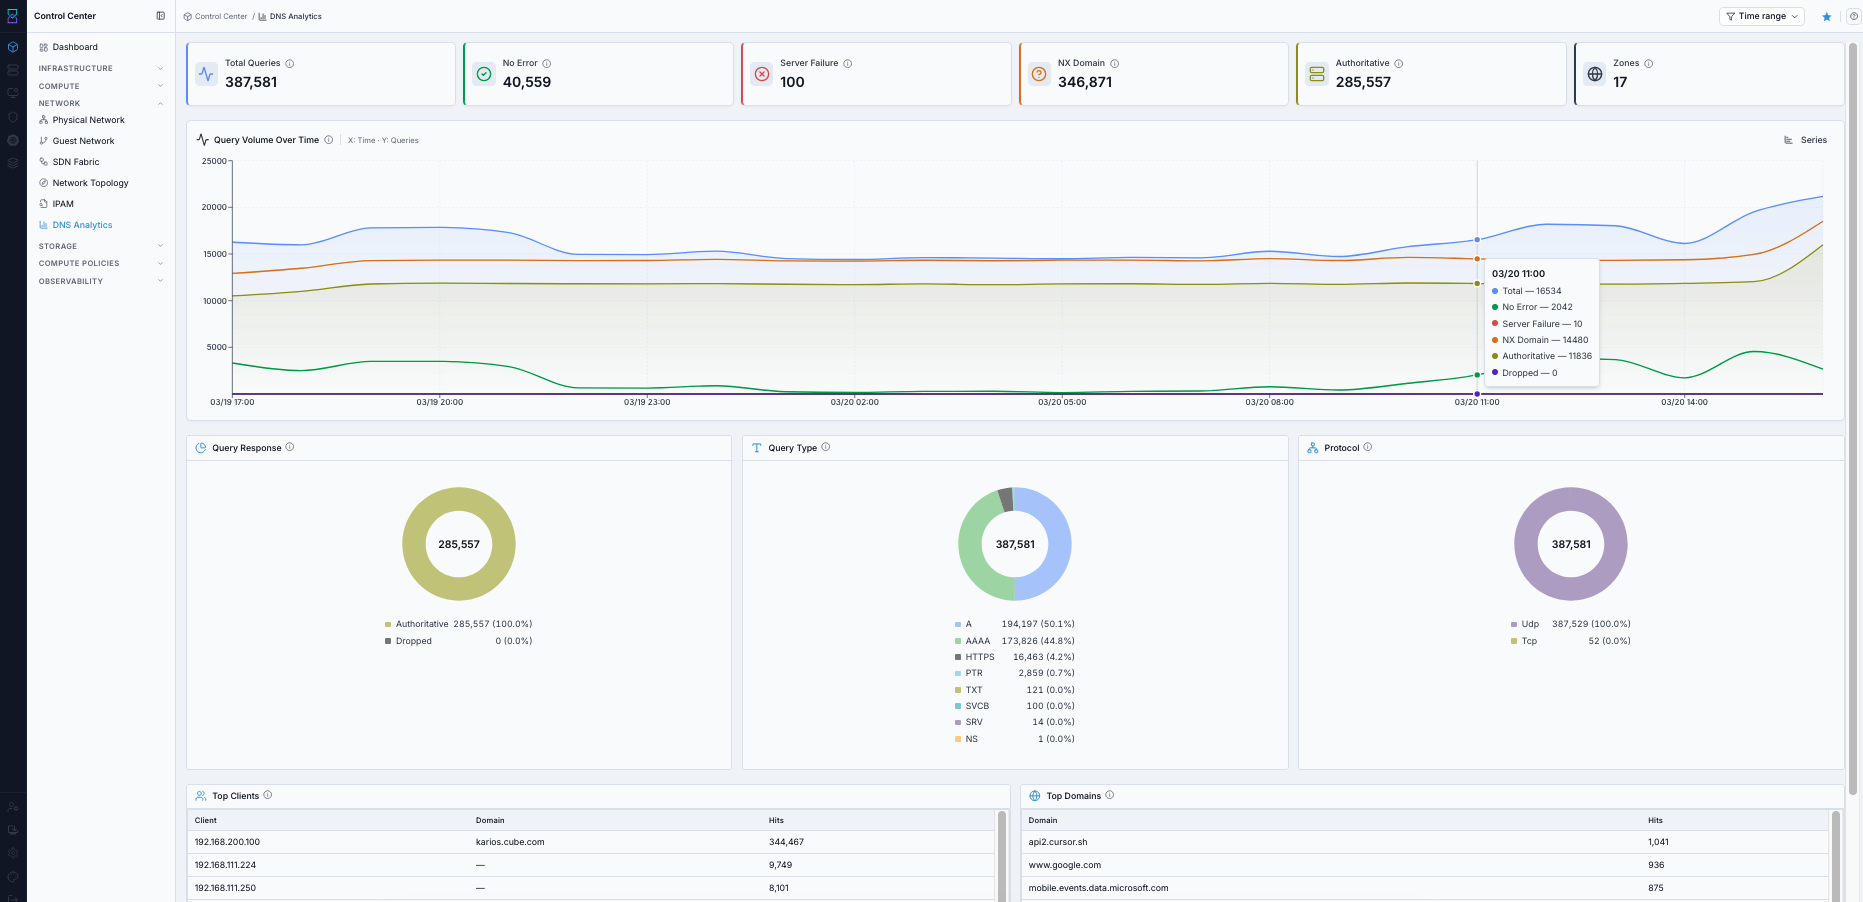
Dashboard shows:
Query volume trend and outcome cards for the selected time range.
Donut visualizations for response classes, query types, and protocols.
Top clients and top domains tables for traffic source analysis.
What you can do from this screen:
Detect DNS error spikes quickly.
Identify heavy query sources and domains.
Compare DNS traffic behavior across time windows.
Steps:
Open
Control Center -> Network -> DNS Analytics.Set the time range in the header.
Review summary cards, trend charts, and top tables.
Expected Outcome:
You can identify DNS load patterns, error classes, and top query sources for the selected time window.
If this fails:
Reopen
DNS Analyticsand retry with a shorter time range.Confirm your account can access
DNS Analytics.Confirm DNS analytics data is available for the selected time range.
Step: Open DNS Analytics Help Panel
When to Use: Use this after opening DNS Analytics when you need metric and chart definitions.
Purpose: Open page help separately from dashboard review.
Steps:
Open
Control Center -> Network -> DNS Analytics.Click the top-right help icon.
Review and search the help panel content.
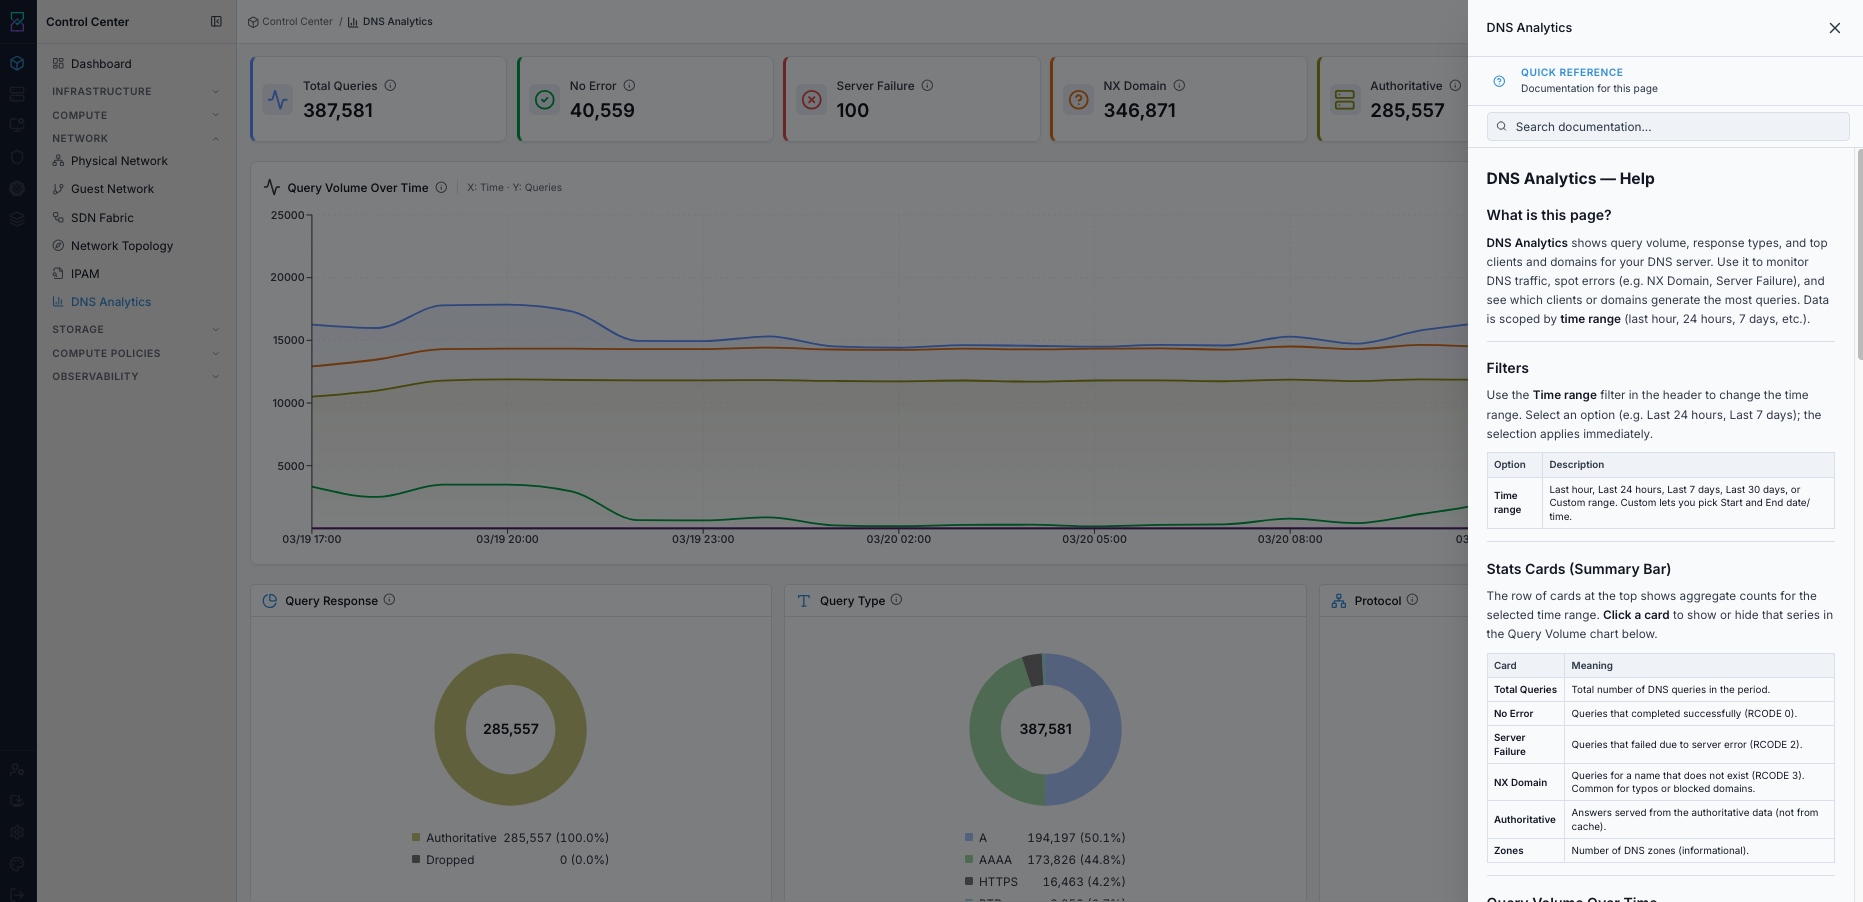
Expected Outcome:
DNS Analytics help opens in the right-side panel.
You can continue dashboard analysis with clear metric definitions.
If this fails:
Refresh the page and click the help icon again.
Confirm your account can access in-product help content.
Retry after reopening
DNS Analytics.
What This Page Shows
Query-volume trends by time
Response outcomes (success/failure/NXDOMAIN)
Query-type mix (A, AAAA, PTR, MX, and others)
Protocol usage (UDP/TCP/DoT/DoH)
Top clients and top queried domains
Filters
When to Use
Use this first when the default time window does not match the incident or trend you are investigating.
Purpose
Set one consistent time scope for all cards, charts, and ranking tables.
Steps
Open
Control Center -> Network -> DNS Analytics.Open the
Time rangecontrol in the page header.Select
Last hour,Last 24 hours,Last 7 days,Last 30 days, or a custom range.Confirm the dashboard refreshes with the selected range.
Expected Outcome
All DNS Analytics widgets update to the same selected time window.
If this fails
Reopen the
Time rangeselector and reapply the window.Refresh the page and set the filter again.
Select a broader window to confirm data exists.
Use Time range in the header; changes apply immediately.

Filter |
Description |
|---|---|
Time range |
Last hour, Last 24 hours, Last 7 days, Last 30 days, or custom start/end range. |
Stats Cards (Summary Bar)
When to Use
Use this at the start of DNS analysis to get a quick error/success baseline.
Purpose
Use card totals to compare response outcomes and isolate chart series quickly.
Steps
Keep the target
Time rangeselected.Review card totals:
Total Queries,No Error,Server Failure,NX Domain,Authoritative,Zones.Click a card to show or hide its matching series in
Query Volume Over Time.Click again to toggle that series back.
Expected Outcome
You can quickly identify dominant outcomes and focus the trend chart on specific series.
If this fails
Confirm a valid
Time rangeis selected.Refresh the page and retry card toggles.
Ensure the selected window has DNS traffic.
Cards show aggregate counts for the selected time window. Click a card to show or hide that series in the query-volume chart.
Card |
Meaning |
|---|---|
Total Queries |
Total DNS queries in selected period. |
No Error |
Successful responses (RCODE 0). |
Server Failure |
Server-side failures (RCODE 2). |
NX Domain |
Name does not exist (RCODE 3). |
Authoritative |
Responses served from authoritative data. |
Zones |
DNS-zone count (informational). |
Query Volume Over Time
When to Use
Use this when you need to correlate DNS spikes and error bursts over time.
Purpose
Visualize trend direction and compare selected DNS series at each timestamp.
Steps
Open
Query Volume Over Time.Use
Seriesto control which lines are visible.Optionally use summary-card toggles to hide or show specific series.
Hover points on the chart to read exact values at a timestamp.
Expected Outcome
You can pinpoint when DNS volume or error classes changed.
If this fails
Confirm at least one series is selected.
Expand the time range to include active traffic.
Refresh and reapply chart series selections.
Use this chart to visualize DNS volume and error trends.
Seriesselector controls visible metrics.Card toggles are linked to chart series visibility.
Hover to inspect exact values at a timestamp.
Donut Charts
When to Use
Use this when you need distribution view instead of timeline view.
Purpose
Break DNS traffic into response classes, record types, and transport mix.
Steps
Review
Query Responsefor success/error distribution.Review
Query Typefor record-type mix (for exampleA,AAAA,PTR,MX).Review
Protocolfor transport usage (UDP,TCP,DoT,DoH).Hover donut segments to read counts and percentages.
Expected Outcome
You can identify dominant response, type, and protocol distributions for the selected window.
If this fails
Confirm the selected time window has DNS query volume.
Refresh the page and recheck segment values.
Use a wider time range when counts are too low for distribution analysis.
Three donut charts summarize response behavior, query types, and transport protocols.
Chart |
Description |
|---|---|
Query Response |
Distribution of responses (success, NXDOMAIN, SERVFAIL, dropped). |
Query Type |
Distribution of record types (A, AAAA, PTR, MX, and others). |
Protocol |
Distribution by transport (UDP, TCP, DoT, DoH). |
Query-type interpretation:
A: IPv4 lookupAAAA: IPv6 lookupPTR: reverse-DNS lookupMX: mail-exchanger lookupSOA/SRV/ others: zone and service-oriented lookups
Protocol interpretation:
UDP: default DNS transportTCP: fallback/large response transportDoT/DoH: encrypted DNS transport
Top Clients and Top Domains
When to Use
Use this after identifying spikes or errors to find who and what generated the most traffic.
Purpose
Identify highest-volume query sources and most-queried domains for targeted follow-up.
Steps
Open
Top Clientsand review the highest-hit sources.Open
Top Domainsand review the highest-hit domains.Compare both tables together to identify noisy client-domain combinations.
Expected Outcome
You can isolate heavy clients and domains driving DNS load or error patterns.
If this fails
Confirm the selected time range includes active DNS traffic.
Refresh and reload the tables.
Expand the time range to increase sample size.
Use the two ranking tables to identify heavy query sources and frequently queried domains.
Table |
Description |
|---|---|
Top Clients |
Highest-volume query sources (client, domain, hits). |
Top Domains |
Most frequently queried domains (domain, hits). |
Quick Reference
Goal |
Where to Go |
|---|---|
Audit DNS query volume and outcomes |
Summary cards + Query Volume chart |
Identify DNS errors (NXDOMAIN/SERVFAIL) |
|
Check query transport mix |
|
Find heavy DNS clients/domains |
|
Tips
Use the
Time rangefilter to scope analysis (Last hour,Last 24 hours,Last 7 days,Last 30 days, or custom range).Use card toggles to isolate one error series at a time in
Query Volume Over Time.Compare
Top ClientsandTop Domainstogether to find noisy client-domain pairs quickly.
Warnings
DNS totals and percentages are time-range dependent. Changing the
Time rangechanges all chart and table values.Empty or near-empty charts can mean no traffic in the selected window; verify the selected time range before further analysis.
Troubleshooting
Chart looks flat or empty: confirm the selected time range includes active DNS traffic.
High error counts: use
Top ClientsandTop Domainsto identify the highest-hit sources and queried domains.Unexpected transport mix: use the
Protocoldonut chart and hover values to compare UDP/TCP/DoT/DoH distribution in the selected window.
8. VPCs
Use VPCs to create isolated, account-owned virtual networks with multiple subnets, built-in routing, firewall controls, load balancing, and optional VPN connectivity.
Note
Use the ? help icon in the top-right of each VPC page for inline field definitions and quick-reference guidance.
Typical first-time workflow:
Create a VPC (section 8.4) — define the zone, name, and IP supernet.
Add tiers (section 8.5) — create subnets inside the VPC for each workload layer.
Deploy VMs into tiers (section 8.6) — provision instances that receive IPs from tier CIDRs.
Acquire a Public IP (section 8.7.1) — pull an IP from the zone pool for inbound access.
Add rules — choose Static NAT (8.7.2), Port Forwarding (8.7.3), or Load Balancer (8.8.1) depending on your traffic pattern.
Apply Network ACLs (section 8.9) — control which traffic is allowed into or out of each tier.
Connect on-premises networks (section 8.10) — optional Site-to-Site VPN or Remote Access VPN.
8.1. What is a VPC?
A VPC (Virtual Private Cloud) is a private virtual network scoped to your account. It gives you:
Private IP space — a CIDR block you define, fully isolated from other VPCs.
Multiple subnets (“tiers”) inside it, each with its own CIDR and access policy.
Built-in router that handles east-west traffic between tiers and north-south traffic to the internet.
Stateful firewall for ingress and egress controls per tier.
Load balancers — public (internet-facing) and internal (east-west between tiers).
Public IP attach with NAT and port-forwarding rules.
Site-to-Site VPN to connect on-premises networks.
Remote Access VPN (L2TP / IPsec) for individual users to dial in from their devices.
Think of a VPC as a software-defined private datacenter with everything needed to host a multi-tier application in isolation.
8.2. VPC and Tier Offerings
8.2.1. VPC Offering
The VPC offering is pre-selected at creation. Karios ships one offering:
Name |
Type |
Description |
|---|---|---|
Karios VPC (NAT’d) |
NAT’d + Static routing |
The default Karios VPC. Outbound NAT via the VPC router, public IPs attached on demand, public and internal load balancing supported inside. |
8.2.2. Tier Offerings
When creating a tier (subnet) inside the VPC, pick one offering based on what that tier serves:
Tier Offering |
Best For |
What You Get |
|---|---|---|
Karios VPC Tier – Default |
Internet-facing tiers (web frontends, APIs) |
Public LB, Static NAT, Port Forwarding, VPN, AutoScale |
Karios VPC Tier – Hybrid |
Tiers that need an internal VIP AND the ability to attach a public IP (bastion, mixed backend) |
Internal LB + Static NAT, Port Forwarding, VPN. No Public Load Balancer. |
Karios VPC Tier – InternalLB |
Pure internal tiers (databases, internal microservices) |
Internal LB only — no public IP access by design |
Tip
Use the Tier Offering Selection Guide in section 8.12 to choose the right offering for your topology before creating tiers.
8.3. VPC Dashboard
When to Use:
Use this as the entry point before creating, managing, or troubleshooting VPCs.
Purpose:
Review existing VPCs, check their state, and access create and detail actions.
Path:
Control Center -> Network -> VPCs
Dashboard shows:
Summary cards: Total VPCs, Operational, NAT / public edge, and Routed internal counts.
VPC table with columns: Name, CIDR, Mode, State, Zone.
+ Add VPCbutton (top-right) for new VPC creation.Per-row state badge — shows current VPC state (Enabled / Disabled).
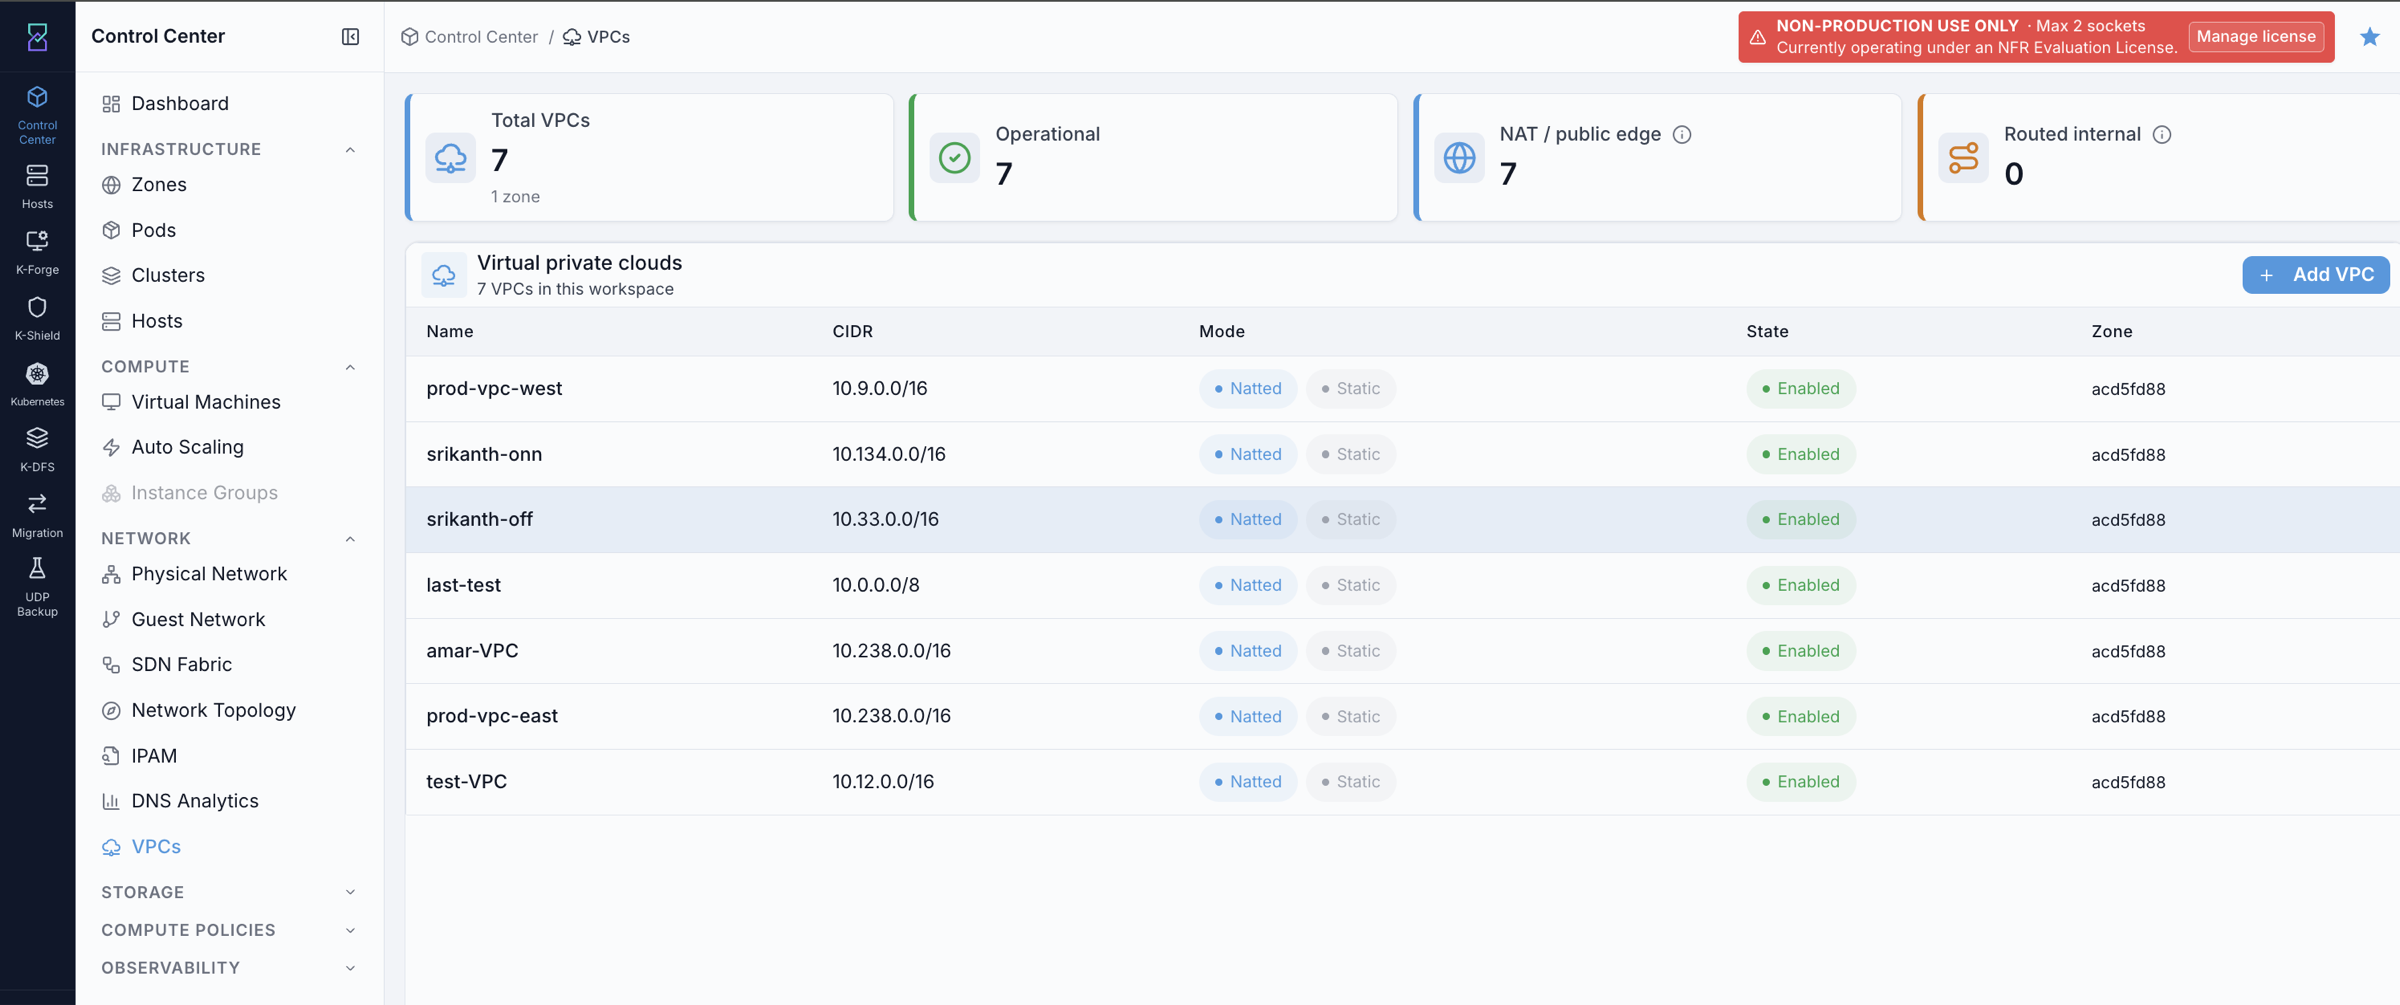
What you can do from this screen:
Click
+ Add VPCto open the create form.Click a VPC name to open the VPC detail page.
Review the VPC state (Enabled / Disabled) and mode (Natted) before making changes.
Click the top-right ? help icon for inline guidance.
Expected Outcome:
You can identify existing VPCs, confirm their state, and proceed to create or manage actions.
If this fails:
See Common screen checks before retrying this screen.
8.4. Create a VPC
When to Use:
Use this when you need a new isolated virtual network for a workload or application group.
Purpose:
Create a VPC with a defined IP supernet, zone, and offering so tiers and VMs can be placed inside it.
Path:
Control Center -> Network -> VPCs -> Add VPC
Steps:
Open
Control Center -> Network -> VPCs.Click
+ Add VPC. The form opens showing the pre-selected Karios VPC (NAT’d) offering with its included services.Fill in the required fields:
Zone— the physical zone where this VPC is hosted.VPC Name— human-readable identifier (for exampleprod-east).VPC CIDR— the supernet for the VPC (for example10.0.0.0/16). Tiers will use sub-prefixes from this range.
Optional fields:
Redundant VPC— toggle on to run the VPC with a redundant router pair for higher availability.Display Text— a friendly description shown in listings.VR size— the router VM size (default: Medium, 2 vCPU / 1024 MB). Increase for high-traffic VPCs.
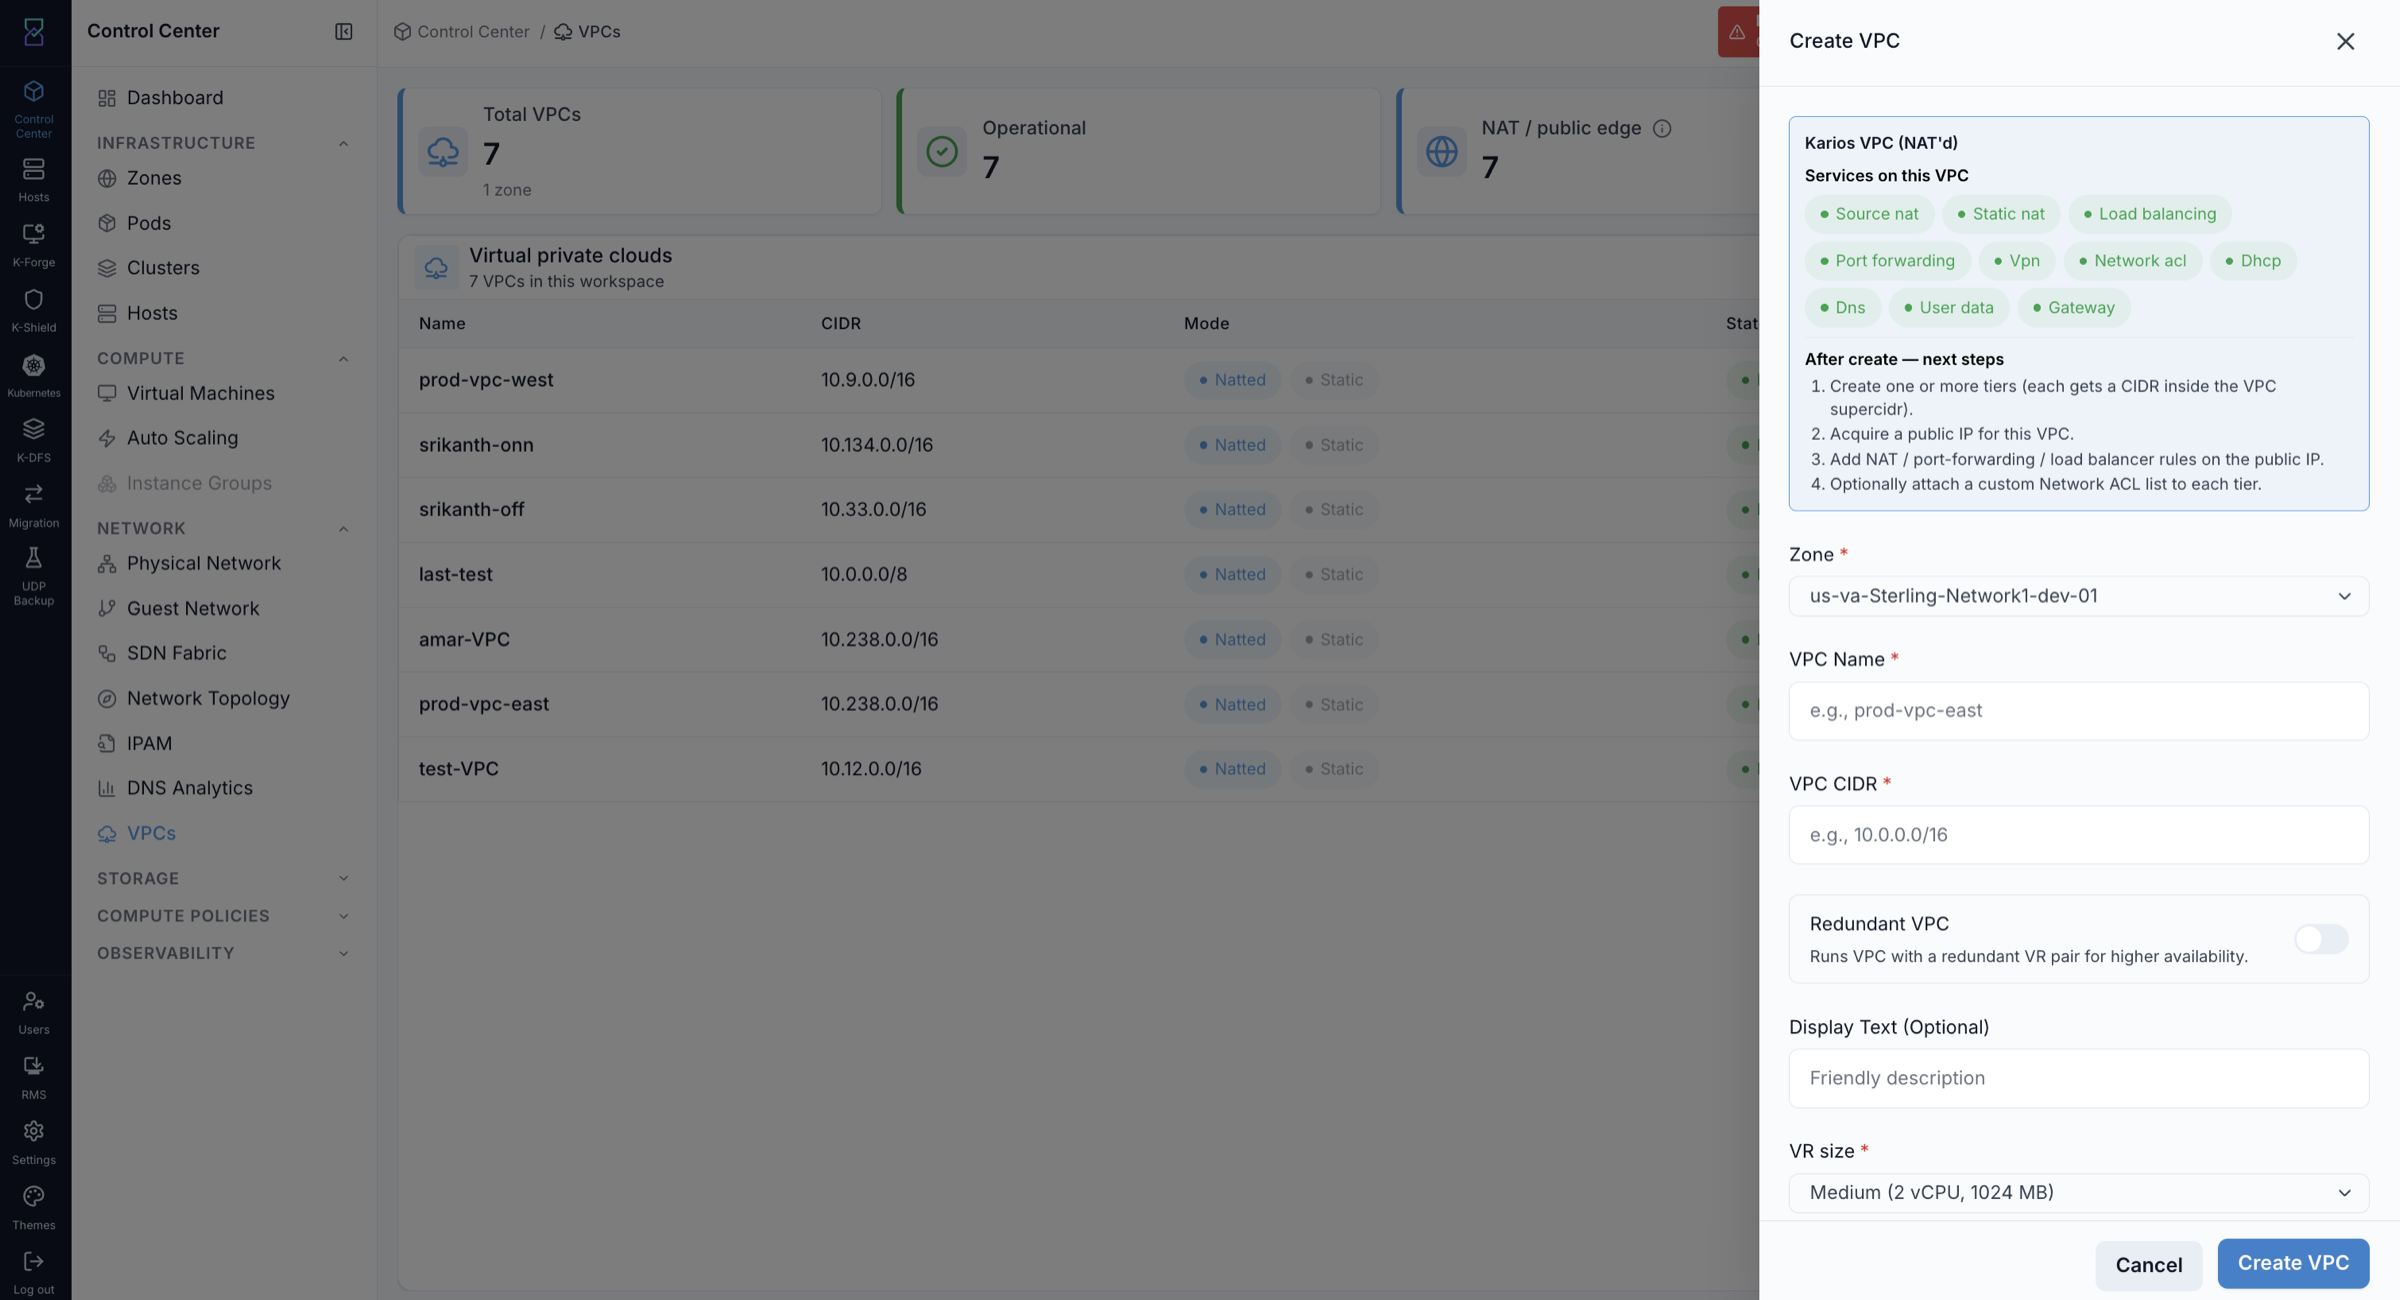
Click
Create VPC.
Field guidance:
VPC CIDR: choose a supernet that does not overlap your on-premises networks if you plan to use Site-to-Site VPN.VPC CIDRis immutable after creation — plan the supernet range before creating.Zone: a VPC is scoped to one zone. Cross-zone VPCs are not supported in the current release.
Expected Outcome:
The VPC appears in the VPCs table with state Enabled.
The VPC router is created automatically.
The VPC’s CIDR is registered in IPAM automatically.
You can proceed to add tiers.
Clicking the VPC name opens the detail page:
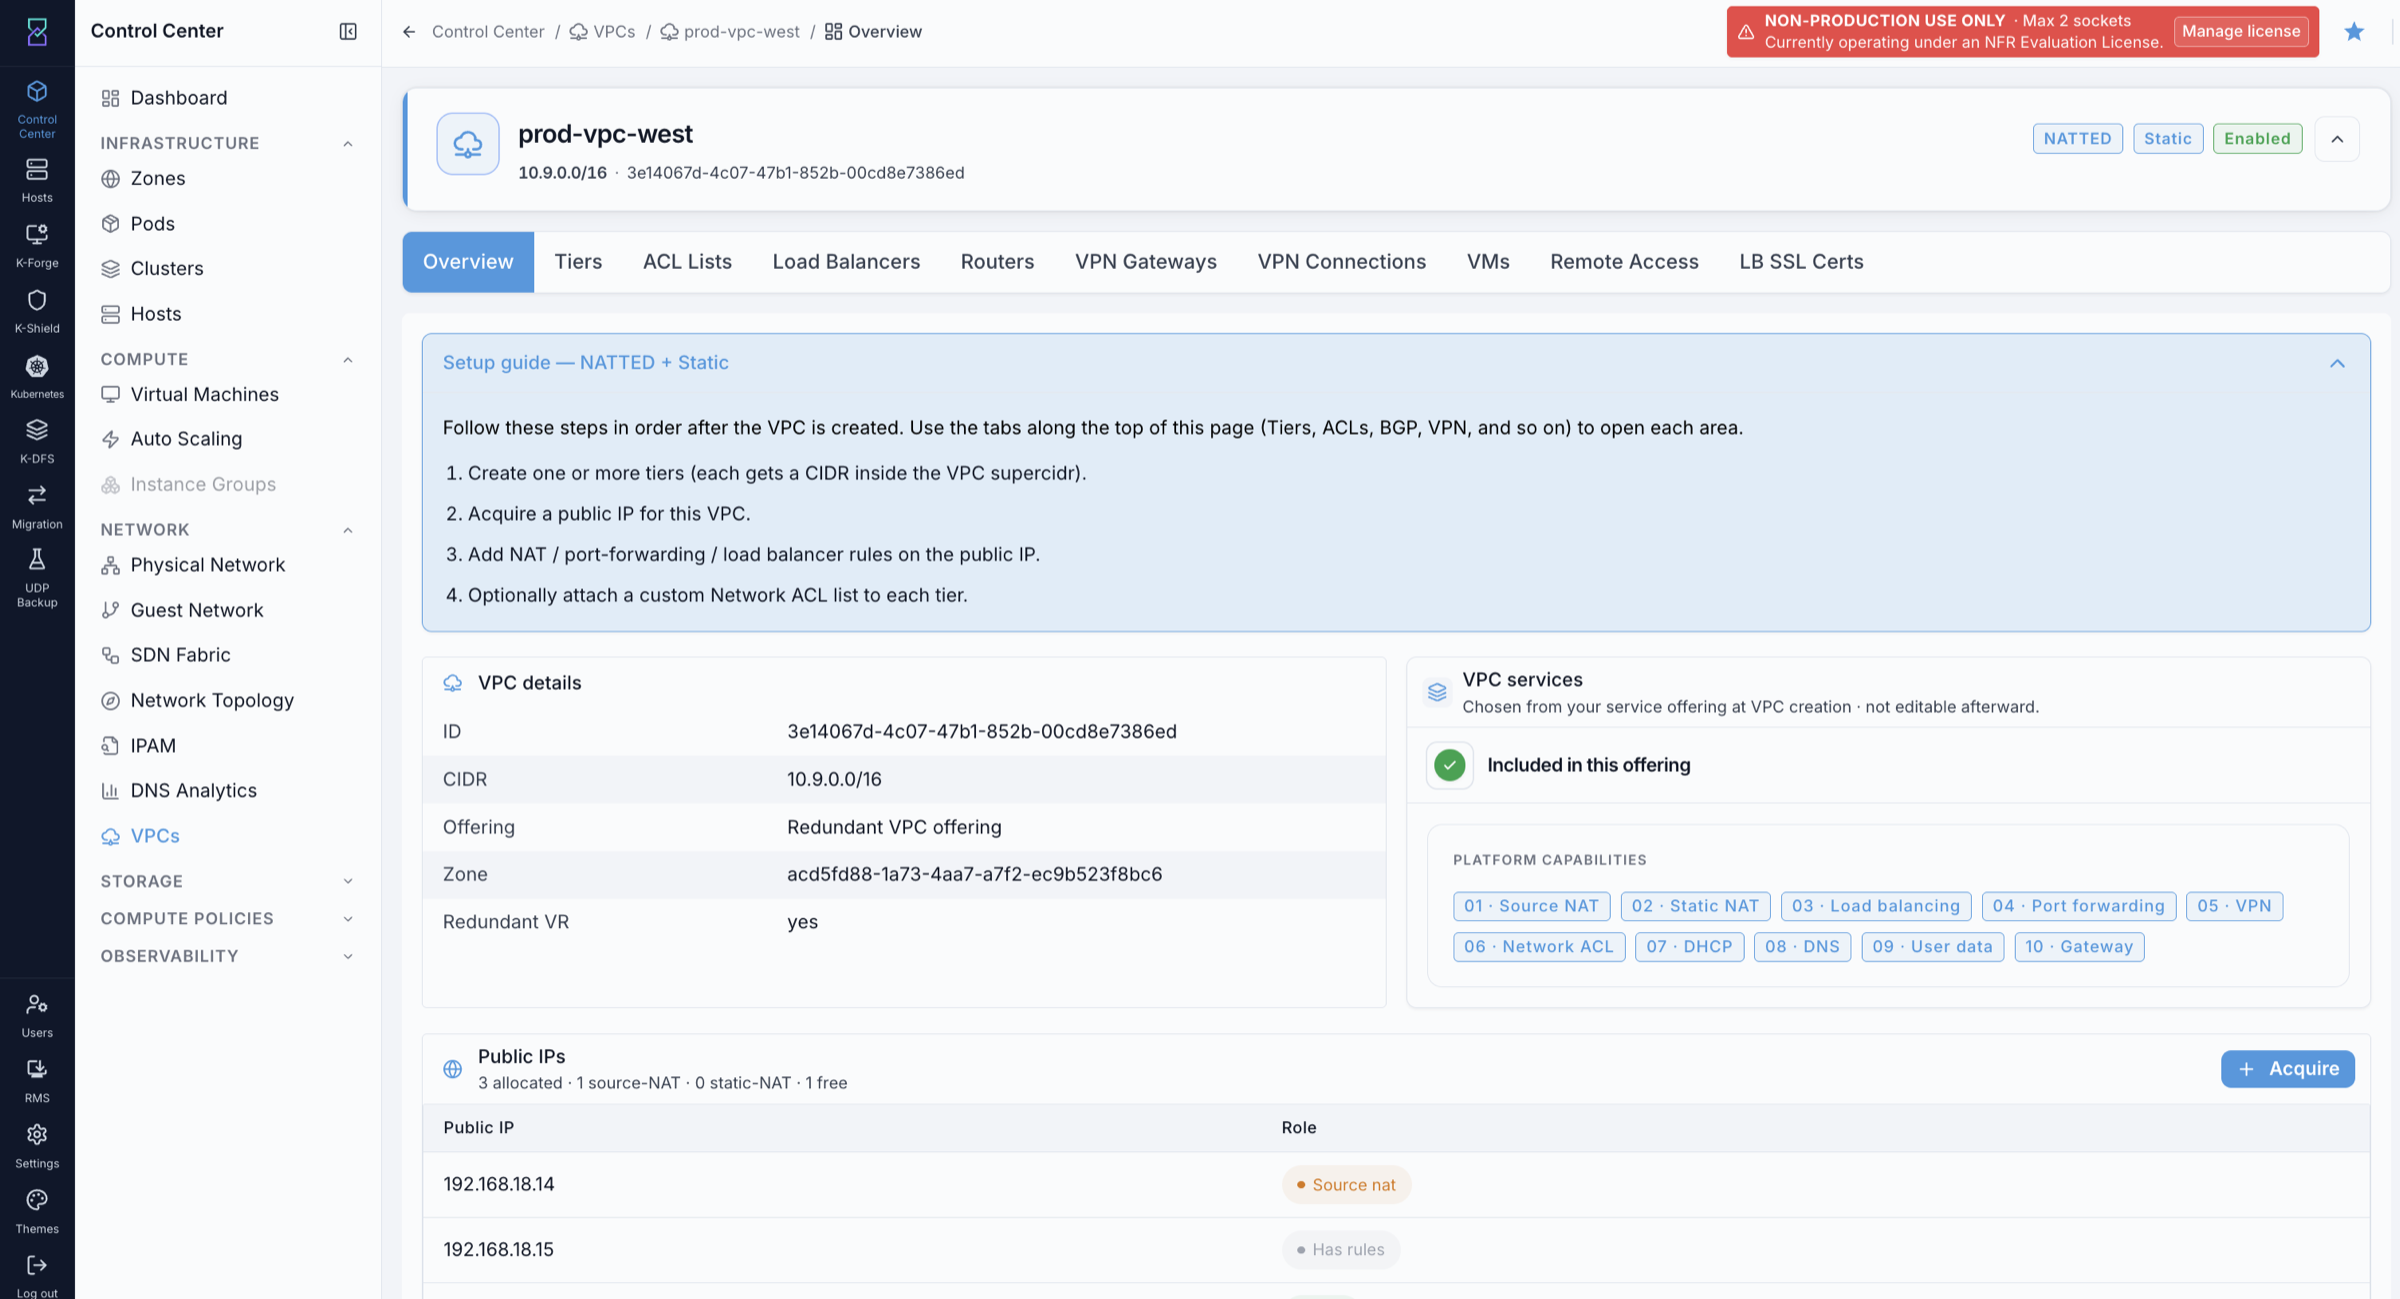
VPC detail page header badges (top-right):
NATTED — the VPC offering type.
Static — VPN/routing mode indicator.
Enabled — current VPC state.
VPC detail page tabs:
Overview — VPC summary, platform capabilities, public IPs at a glance, and a built-in 4-step quickstart guide.
Tiers — create and manage subnets inside the VPC.
ACL Lists — create and attach Network ACL lists to tiers.
Load Balancers — view, add, and manage both Public and Internal load balancer rules.
Routers — view VPC router state, health, public IP, and redundancy role.
VPN Gateways — register remote on-premises VPN customer gateways.
VPN Connections — create and manage Site-to-Site VPN tunnels.
VMs — list all VMs deployed across all tiers in this VPC.
Remote Access — enable and manage the Remote Access VPN endpoint.
LB SSL Certs — upload and manage SSL certificates for TLS termination on Public LB rules.
The Routers tab confirms the VPC router was created automatically:
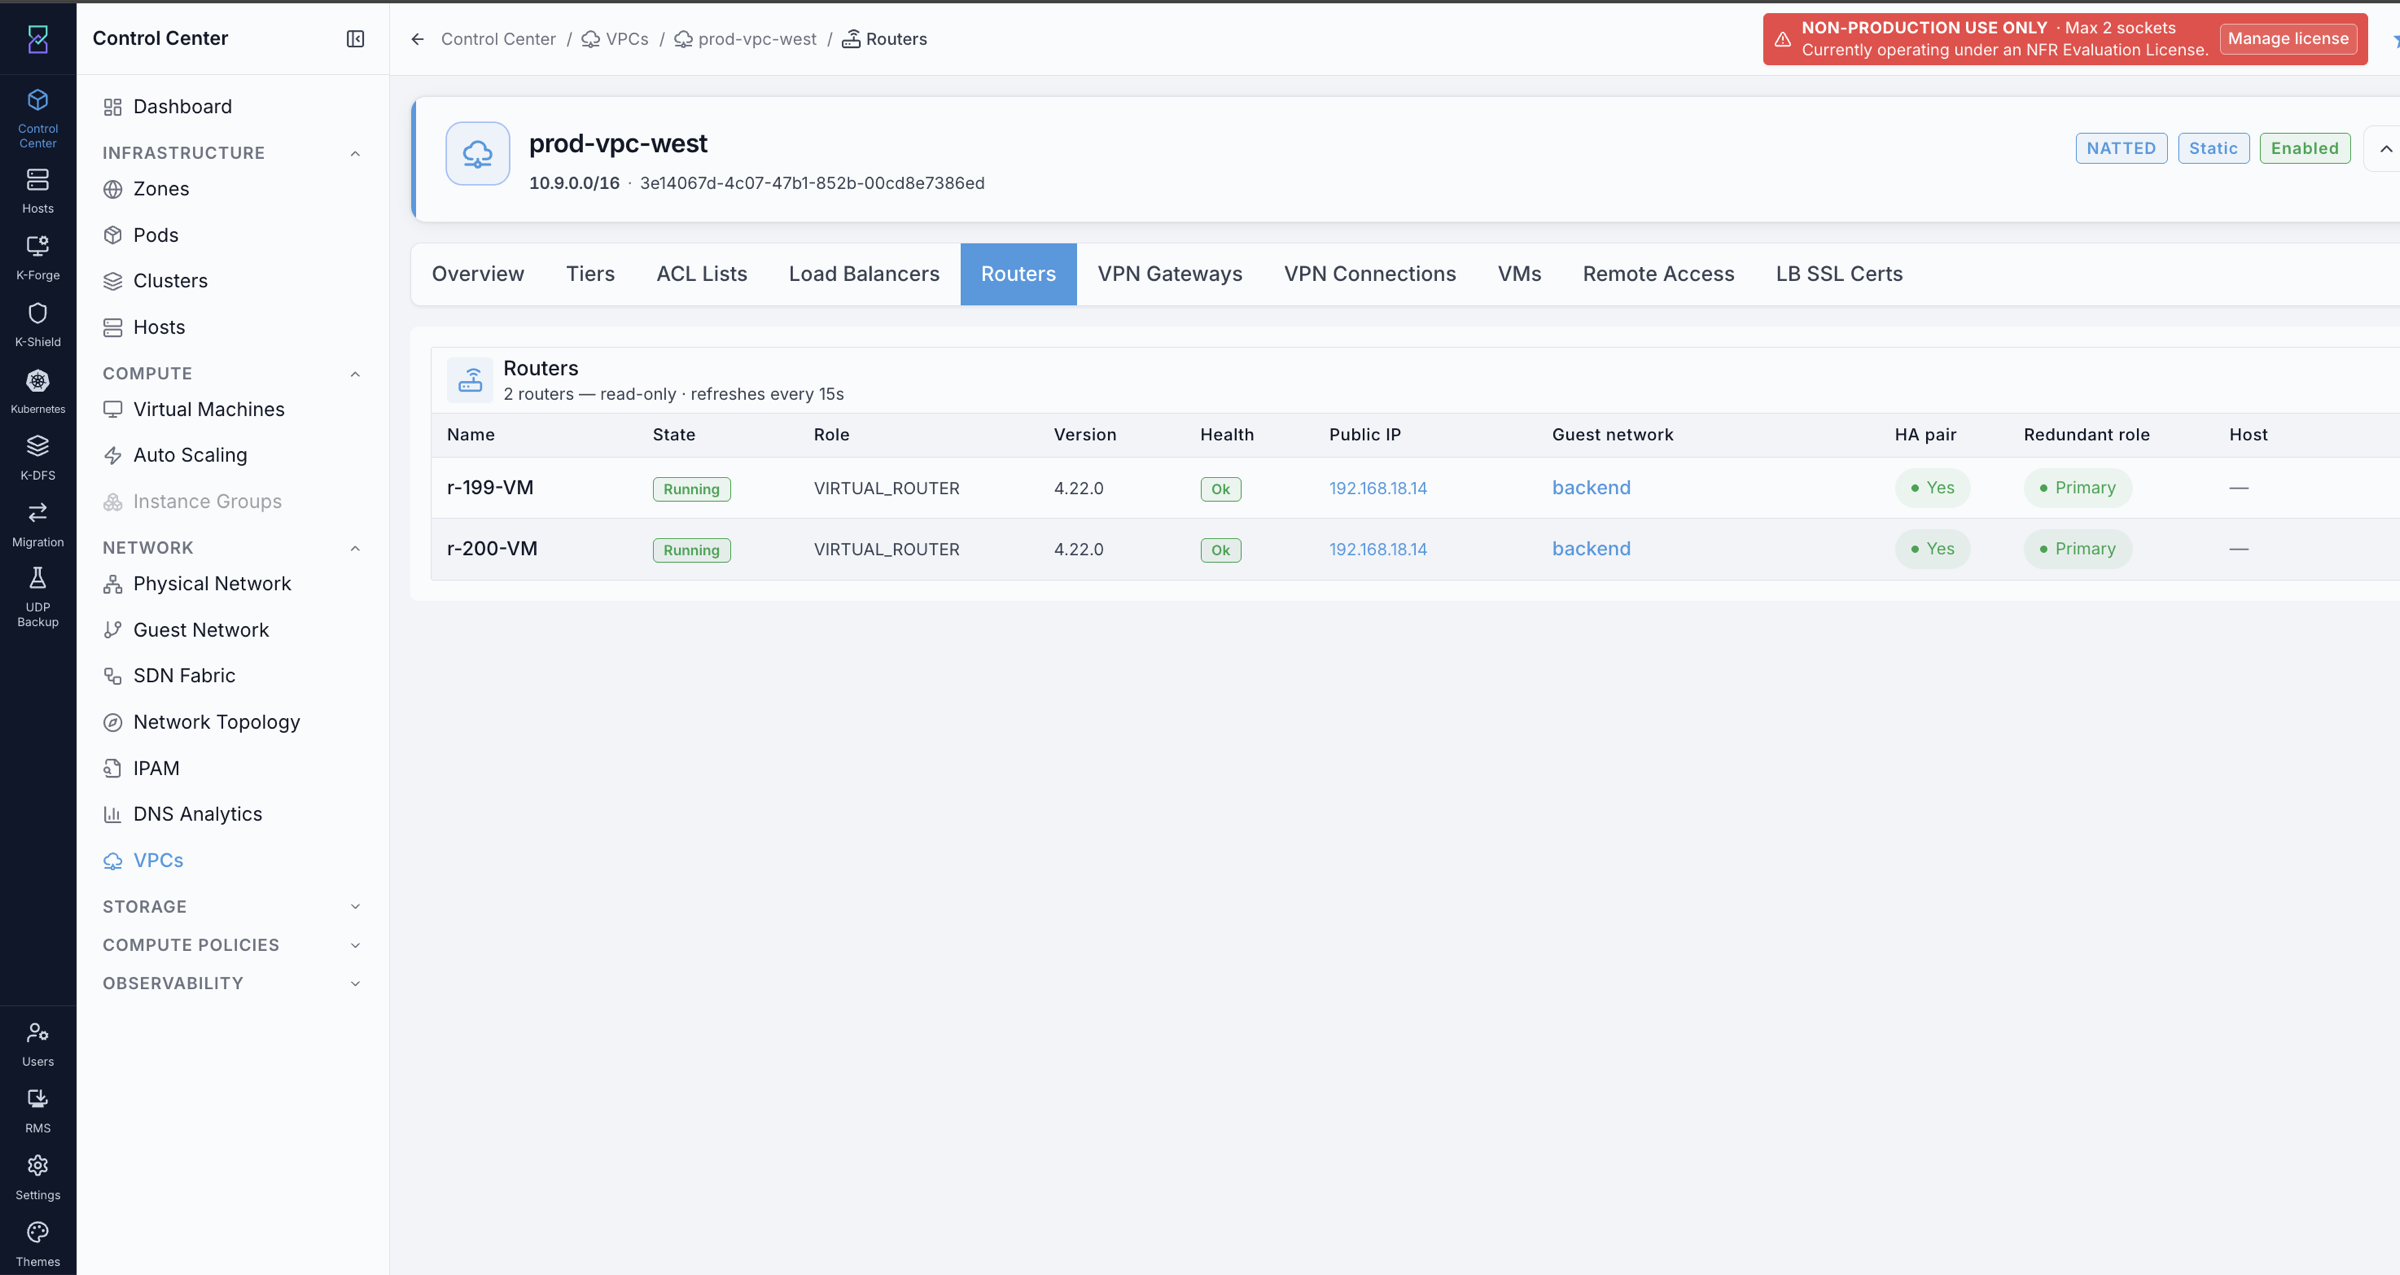
The Routers tab shows: router name, state, version, health, public IP, guest network, HA pair, and redundant role. This view is read-only — use it to verify the router is Running and OK before adding rules.
If this fails:
Confirm required fields are complete.
Confirm the CIDR does not overlap an existing VPC in the same zone.
Verify your account has permission to create VPCs in the selected zone.
Warning
VPC CIDR cannot be changed after creation. Choose the supernet carefully at create time.
8.5. Add a Tier
When to Use:
Use this to add a subnet inside an existing VPC for a specific workload tier.
Purpose:
Create a tier with the correct offering and CIDR so VMs in that tier get the right networking behavior.
Path:
Control Center -> Network -> VPCs -> [VPC name] -> Tiers tab -> Create Tier
Steps:
Open
Control Center -> Network -> VPCs.Click the target VPC name.
Click the
Tierstab.Click
Create Tier(top-right).Fill in the required fields:
Tier Offering— Default, Hybrid, or InternalLB (see section8.2.2).Tier Name— for exampleweb,app, ordb.CIDR— a sub-prefix of the VPC’s CIDR (for example10.20.1.0/24).Gateway— typically the first address of the subnet (for example10.20.1.1).Netmask— subnet mask (for example255.255.255.0for a /24).
Click
Create.
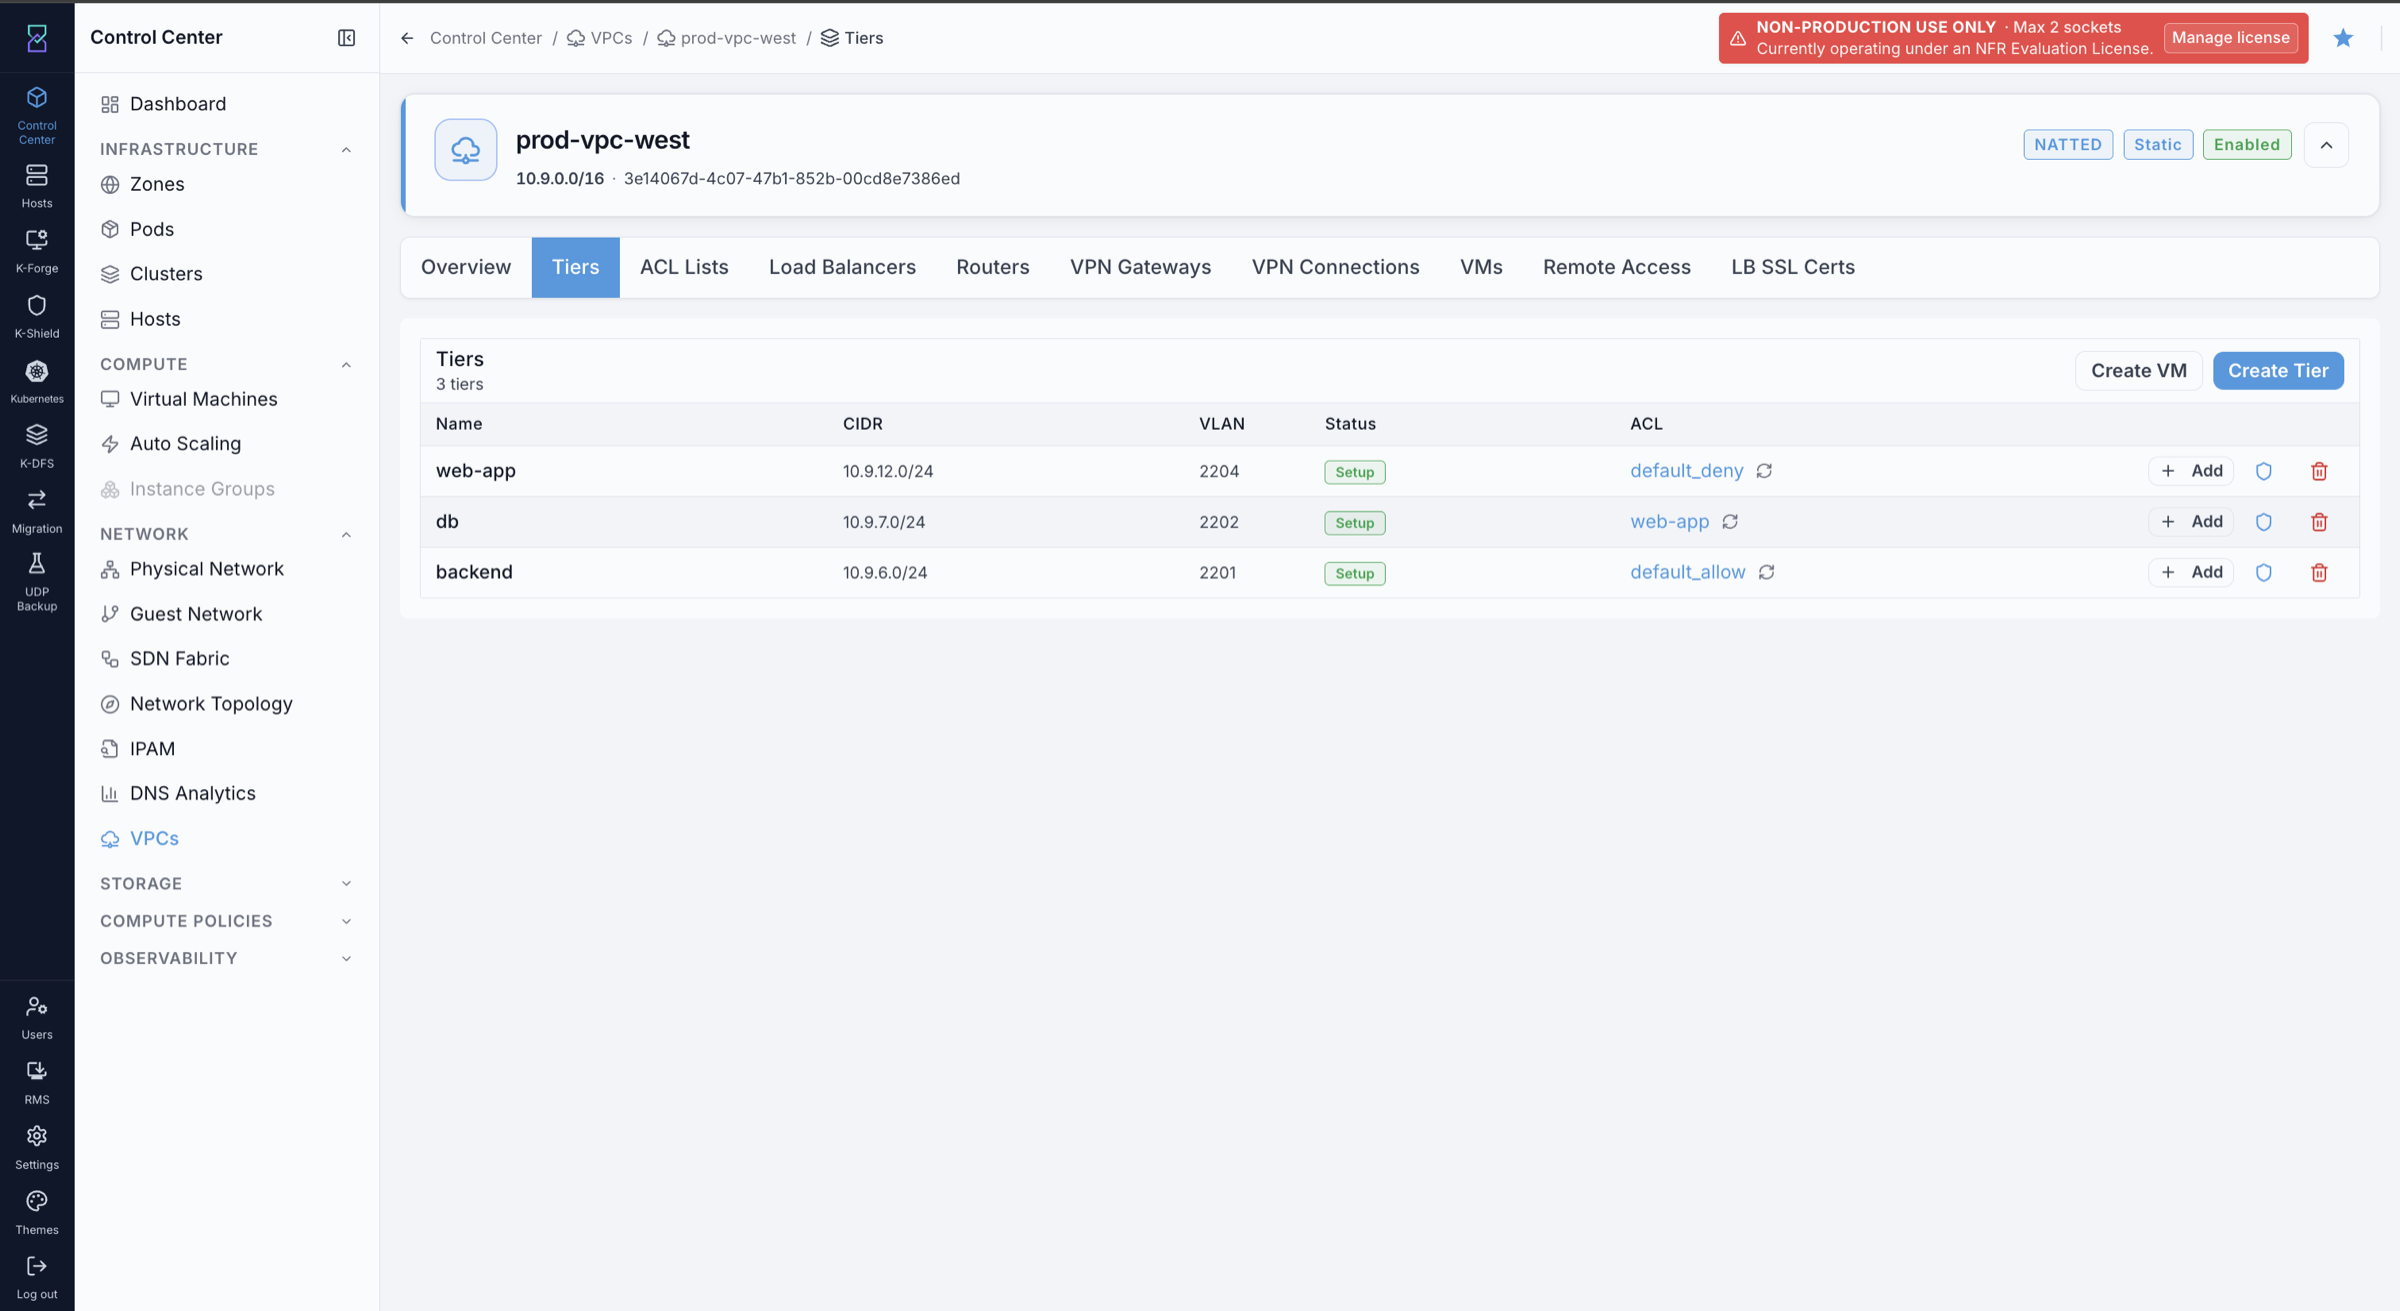
Tiers tab columns and actions:
Table columns: Name, CIDR, VLAN (auto-assigned), Status, ACL (attached ACL list name).
Tier status shows Setup while the tier is being provisioned — this is normal and resolves automatically.
Top-right buttons:
Create Tierto add another subnet;Create VMto deploy a VM directly into a tier from this tab.Per-tier row actions:
Edit (pencil icon) — update the tier name or ACL.
Delete (trash icon) — remove the tier. The tier must have no VMs before it can be deleted.
Add (
+ Addbutton) — attach or change the ACL list assigned to that tier.
Field guidance:
CIDR: must be inside the VPC supernet and must not overlap any existing tier.A VPC supports up to 3 tiers by default.
Typical pattern:
web(Default),app(Hybrid or InternalLB),db(InternalLB).
Expected Outcome:
The tier appears under the
Tierstab with the selected offering and CIDR.VMs can now be deployed into this tier.
If this fails:
Confirm the tier CIDR is within the VPC supernet and does not overlap an existing tier — the error message will name the conflict.
Confirm required fields are complete and valid.
Verify your account has permission to modify the selected VPC.
8.6. Deploy a VM into a Tier
When to Use:
Use this when you are ready to place a VM inside a VPC tier.
Purpose:
Provision a VM that receives an IP from the selected tier’s CIDR and uses the VPC router for outbound traffic.
Steps:
Open the VPC detail page, click the
Tierstab, and clickCreate VM(top-right), or go toControl Center -> Compute -> VMsand clickCreate VM— then select the VPC tier from theNetworkfield in the form.In the Provision Virtual Machine form, fill in the required fields. In the
Networkfield, select the target VPC tier.Click
Provision VM.
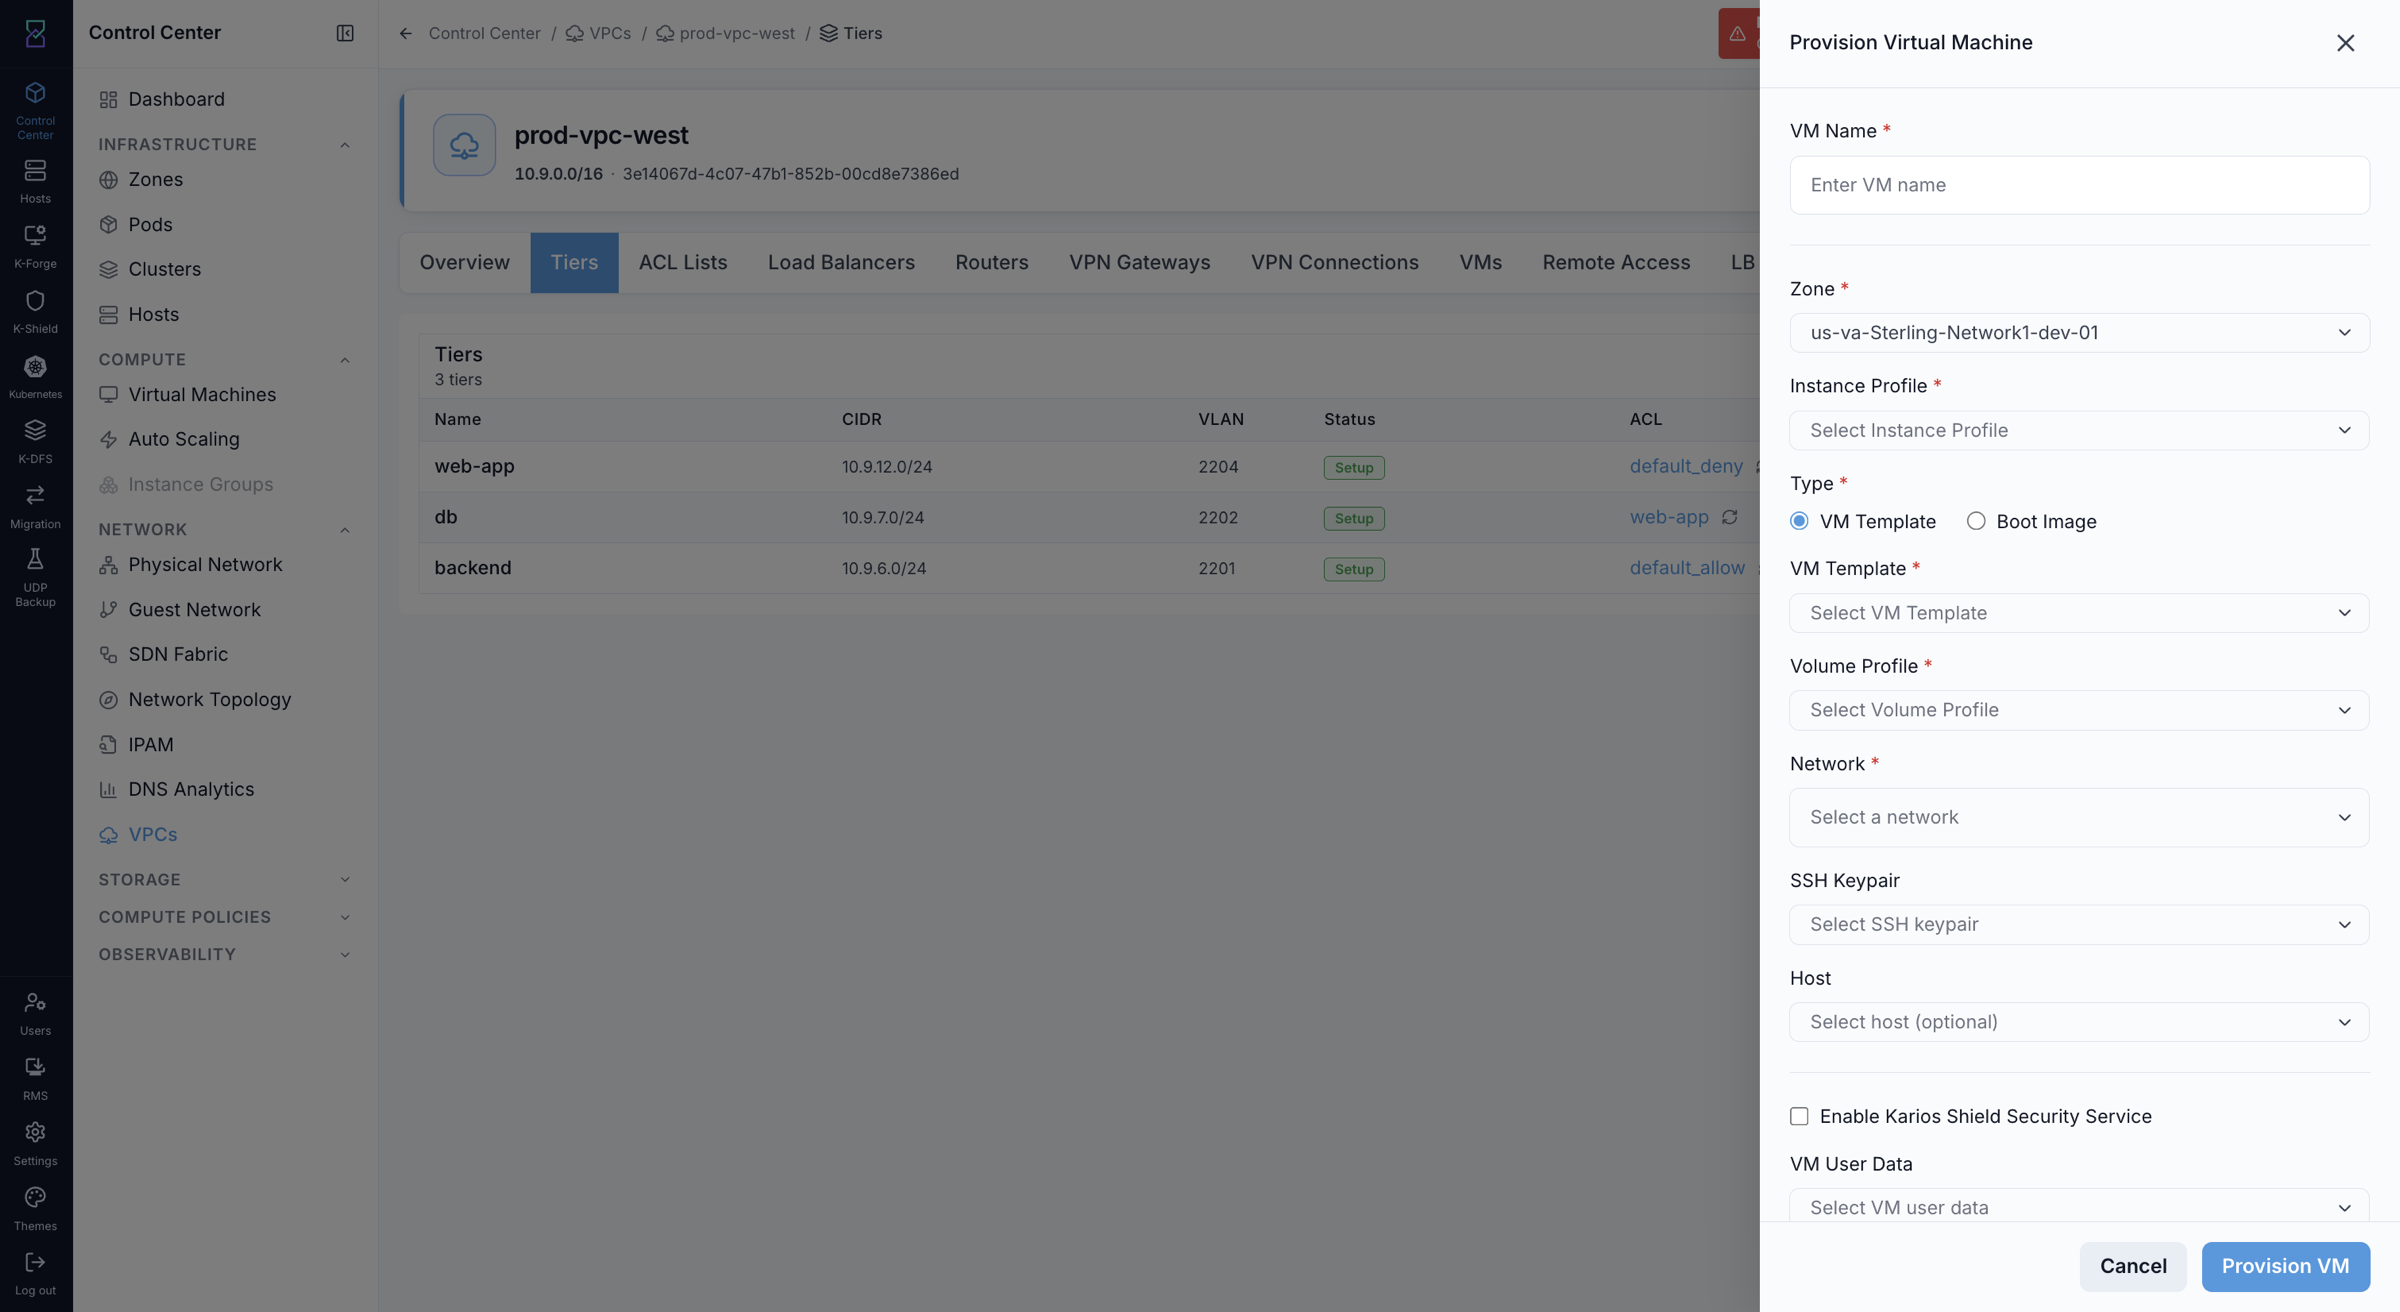
What the VM gets:
An IP from the tier’s CIDR (auto-assigned, or you can pin a specific address).
A NIC attached to the VPC router.
Outbound internet access via the VPC router’s Source NAT — no public IP required for outbound-only traffic.
Expected Outcome:
The VM appears in the
VMstab of the VPC with a private IP from the tier’s CIDR and state Running.The VM can reach the internet outbound via Source NAT without needing a public IP.
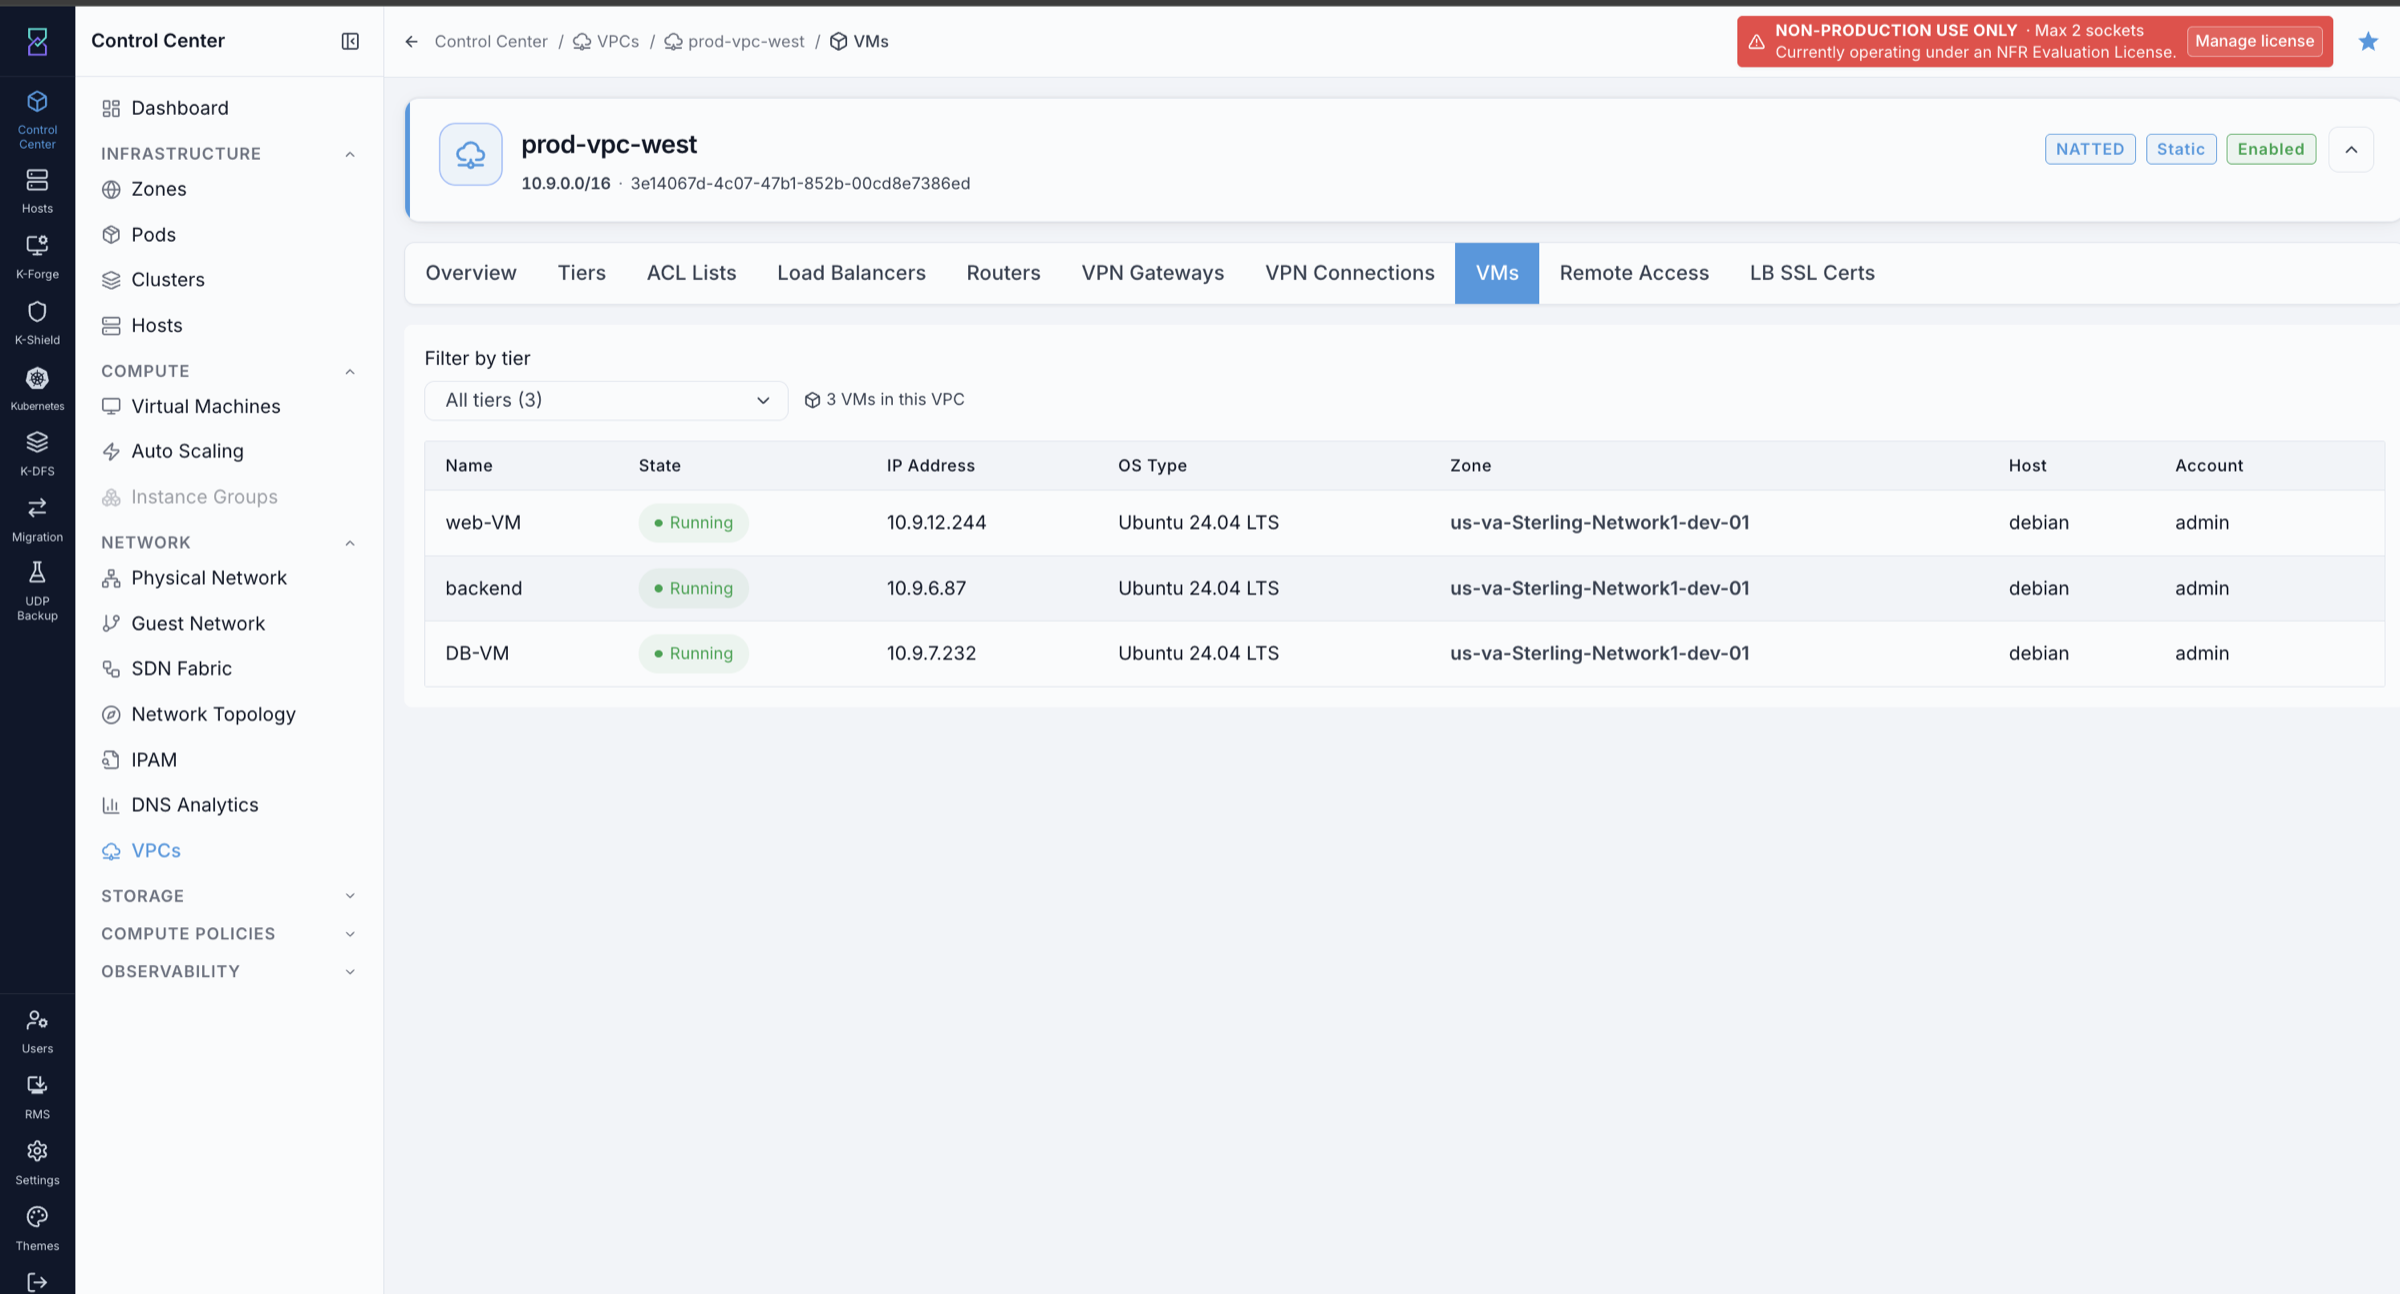
If this fails:
Confirm the selected tier exists and is in state Active.
Confirm the VM template and service offering are available in the zone.
Check the Events log for provisioning errors.
See also
For full VM creation steps, use Compute - Virtual Machines.
8.7. Public IPs
Public IPs give VMs in internet-facing tiers inbound connectivity via the VPC router. A public IP is VPC-scoped — it is not assigned to a tier until you create the first rule on it (Static NAT, Port Forwarding, or Load Balancer).
8.7.1. Acquire a Public IP
When to Use:
Use this when a tier needs a public IP for inbound access (Static NAT, Port Forwarding, or Load Balancer).
Purpose:
Pull a public IP from the zone pool and attach it to the VPC so you can create rules on it.
Path:
Control Center -> Network -> VPCs -> [VPC name] -> Overview tab -> Public IPs section
Steps:
Open the VPC detail page. The Overview tab shows the Public IPs section at the bottom, listing all IPs currently acquired for this VPC.
Click
Acquire(top-right of the Public IPs section).Confirm the zone in the dialog and click
OK.
Expected Outcome:
The new IP appears in the Public IPs section with no rules attached yet.
Click the IP address or Add rules to open its detail page and create rules (Static NAT, Port Forwarding, or Load Balancer).
Note
Changes propagate to the VPC router within approximately 30 seconds after a rule is added.
If this fails:
Confirm public IPs are available in the zone’s public pool.
Confirm your account has permission to acquire public IPs.
Refresh the
Public IPstab and retry.
8.7.2. Static NAT
When to Use:
Use this when one VM needs its own dedicated public IP — for example, a bastion host or a single-server service.
Purpose:
Create a 1-to-1 mapping between a public IP and one VM so all inbound traffic to that IP goes directly to that VM.
Path:
Control Center -> Network -> VPCs -> [VPC name] -> Overview tab -> Public IPs section -> [IP address] -> Static NAT
Steps:
In the Public IPs section on the Overview tab, click the target IP address to open its detail page.
Click
Static NAT.Select the target tier from the dropdown — only tiers with eligible VMs are shown.
Select the target VM.
Click
OKto enable.
Expected Outcome:
The public IP detail page shows Static NAT as Enabled with the selected VM listed.
All inbound traffic to the public IP is forwarded to that VM on all ports.
The VM can also send outbound traffic through this public IP.
If this fails:
Confirm the target VM is in a Default or Hybrid tier — InternalLB tiers do not support Static NAT.
Confirm the selected public IP does not already have a Port Forwarding or Load Balancer rule — a public IP can only be bound to one rule type.
8.7.3. Port Forwarding
When to Use:
Use this when one public IP needs to serve multiple VMs on different ports — for example, port 22 goes to a bastion, port 80 goes to a web VM.
Purpose:
Map specific public port ranges on a public IP to specific VMs and ports.
Path:
Control Center -> Network -> VPCs -> [VPC name] -> Overview tab -> Public IPs section -> [IP address] -> Port Forwarding
Steps:
In the Public IPs section on the Overview tab, click the target IP address to open its detail page.
Click
Port Forwarding.Click
Add Port Forwarding Ruleand fill in:Public Start/End Port— the port range exposed on the public IP.Protocol— TCP or UDP.Private Start/End Port— the corresponding port range on the target VM.Target VM— select from the tier.
Click
OKto save the rule.
Expected Outcome:
The rule appears in the Port Forwarding list.
Traffic arriving on the public IP at the specified port is forwarded to the target VM’s private port.
Multiple rules can be added on the same public IP for different VMs or ports.
If this fails:
Confirm the target tier is Default or Hybrid — InternalLB tiers do not support Port Forwarding.
Confirm the port range does not conflict with an existing rule on the same public IP.
8.8. Load Balancing
8.8.1. Public Load Balancer
When to Use:
Use this when you need to distribute internet traffic across multiple VMs in a Default tier.
Purpose:
Create an internet-facing load balancer rule on a public IP, targeting a pool of VMs in the tier.
Path:
Control Center -> Network -> VPCs -> [VPC name] -> Load Balancers tab
The Load Balancers tab shows a summary bar (Total Rules, Backends, Public IPs, Internal VIPs, Tiers) and lists Public Load Balancers and Internal Load Balancers in separate sections.
Steps:
Open the VPC detail page and click the
Load Balancerstab.In the Public Load Balancers section, click
+ Add Public LB.Configure the rule:
NamePublic PortPrivate PortAlgorithm— Round Robin, Least Connections, or Source IP Hash.Protocol— usesslfor TLS termination at the load balancer; usetcpfor passthrough.
Click
OKto save the rule, then open the rule and clickAttach VMson the Members tab to add backend VMs from the selected tier.
Load balancer rules list:
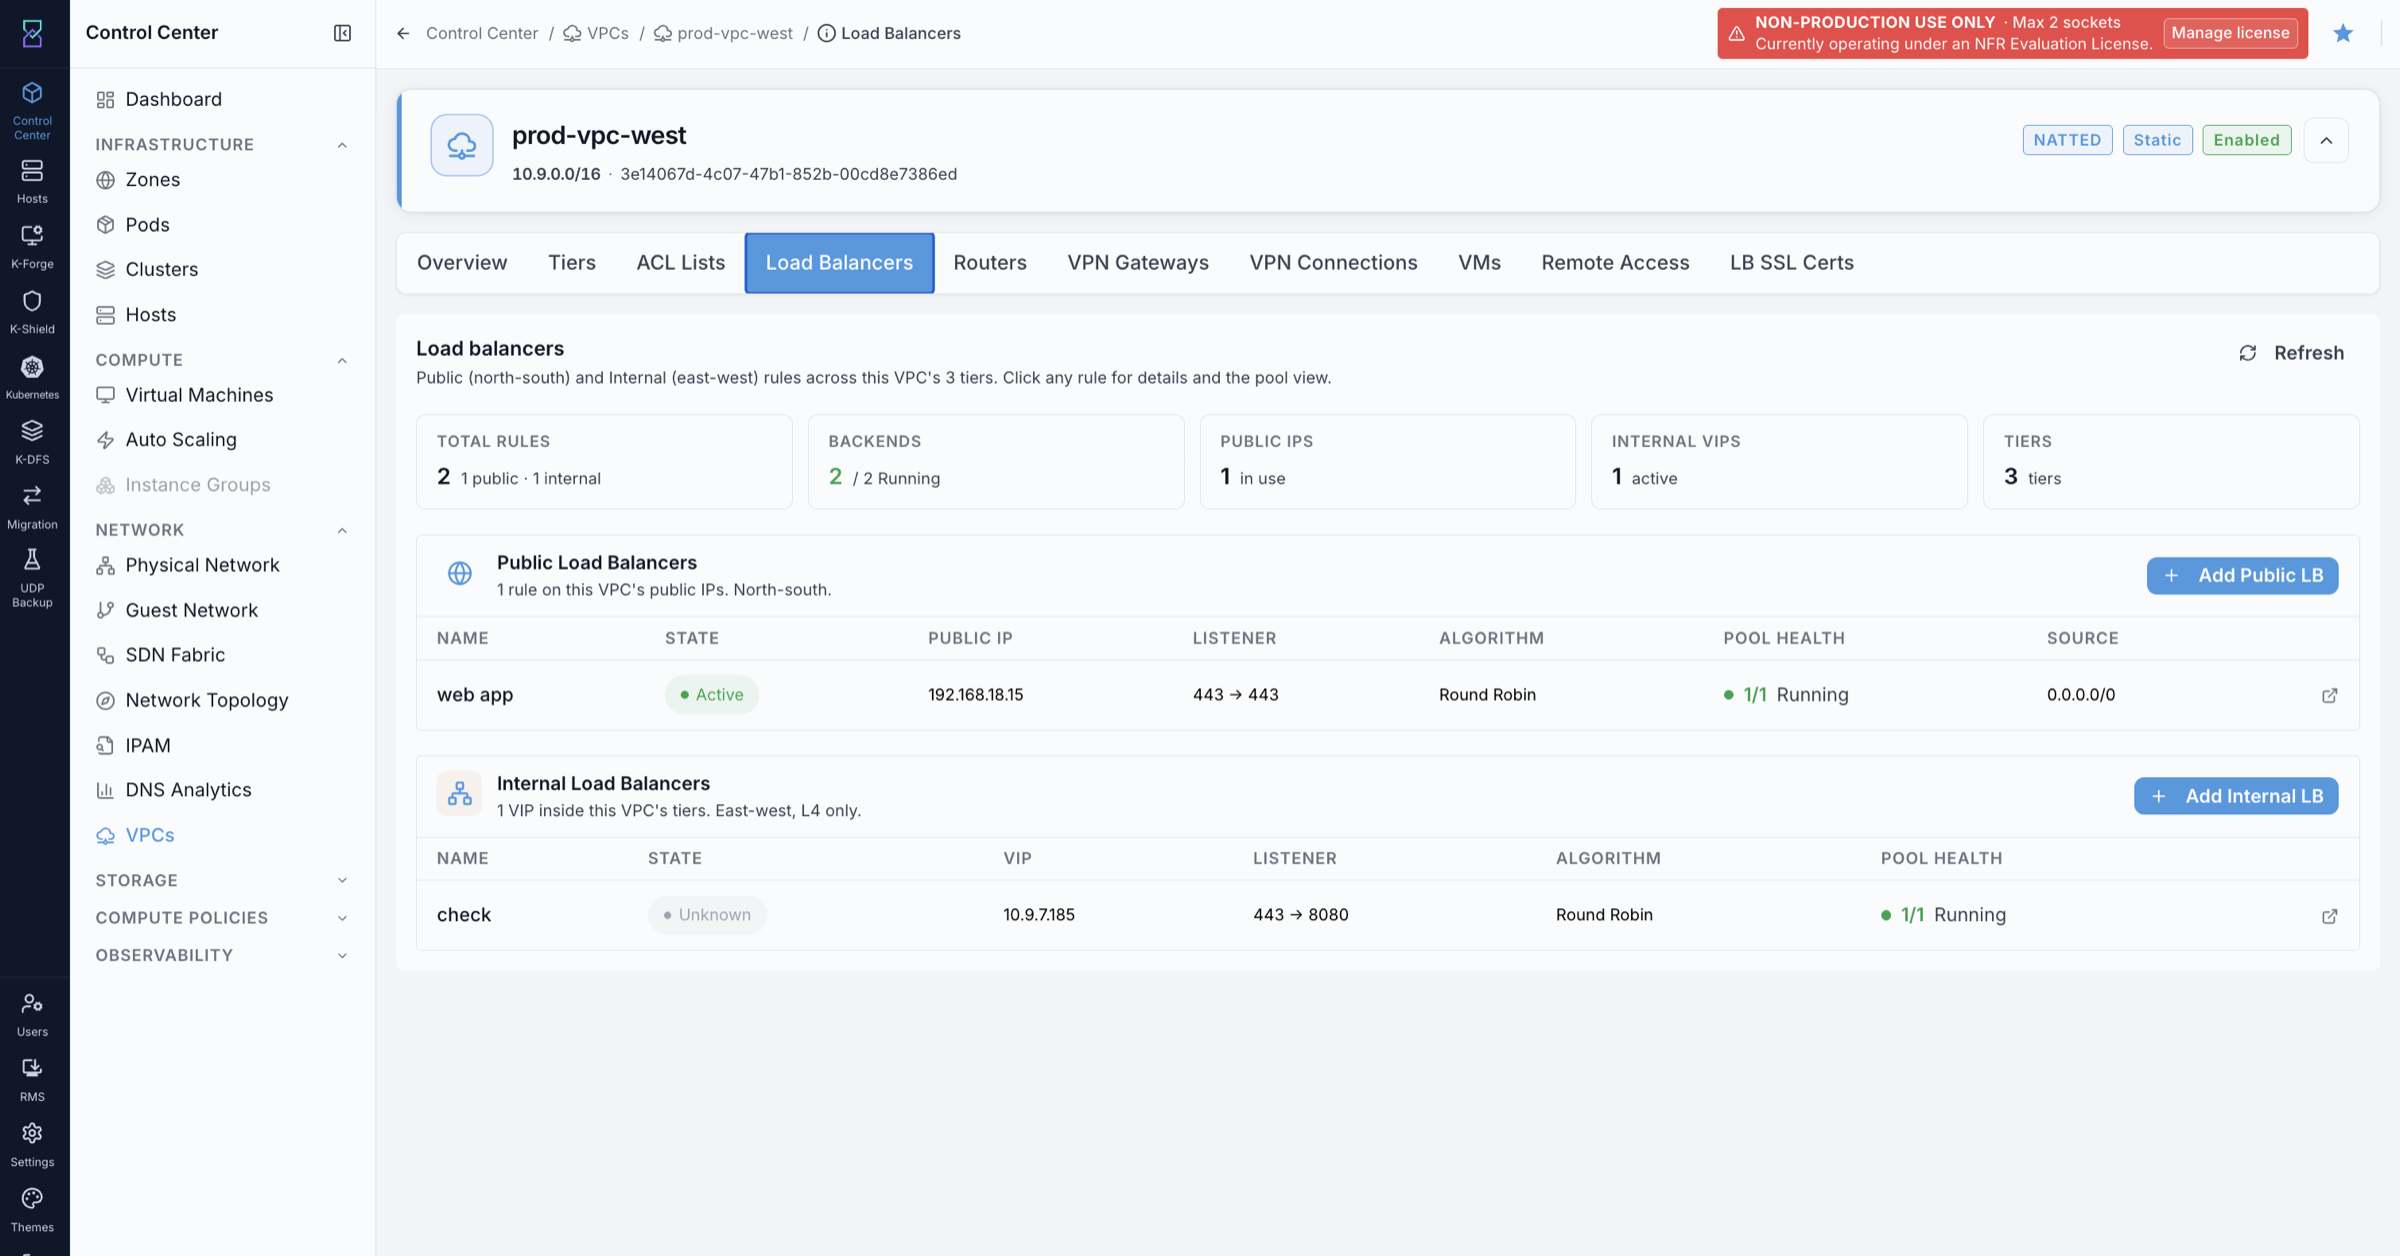
Rule configuration — port, protocol, and algorithm:
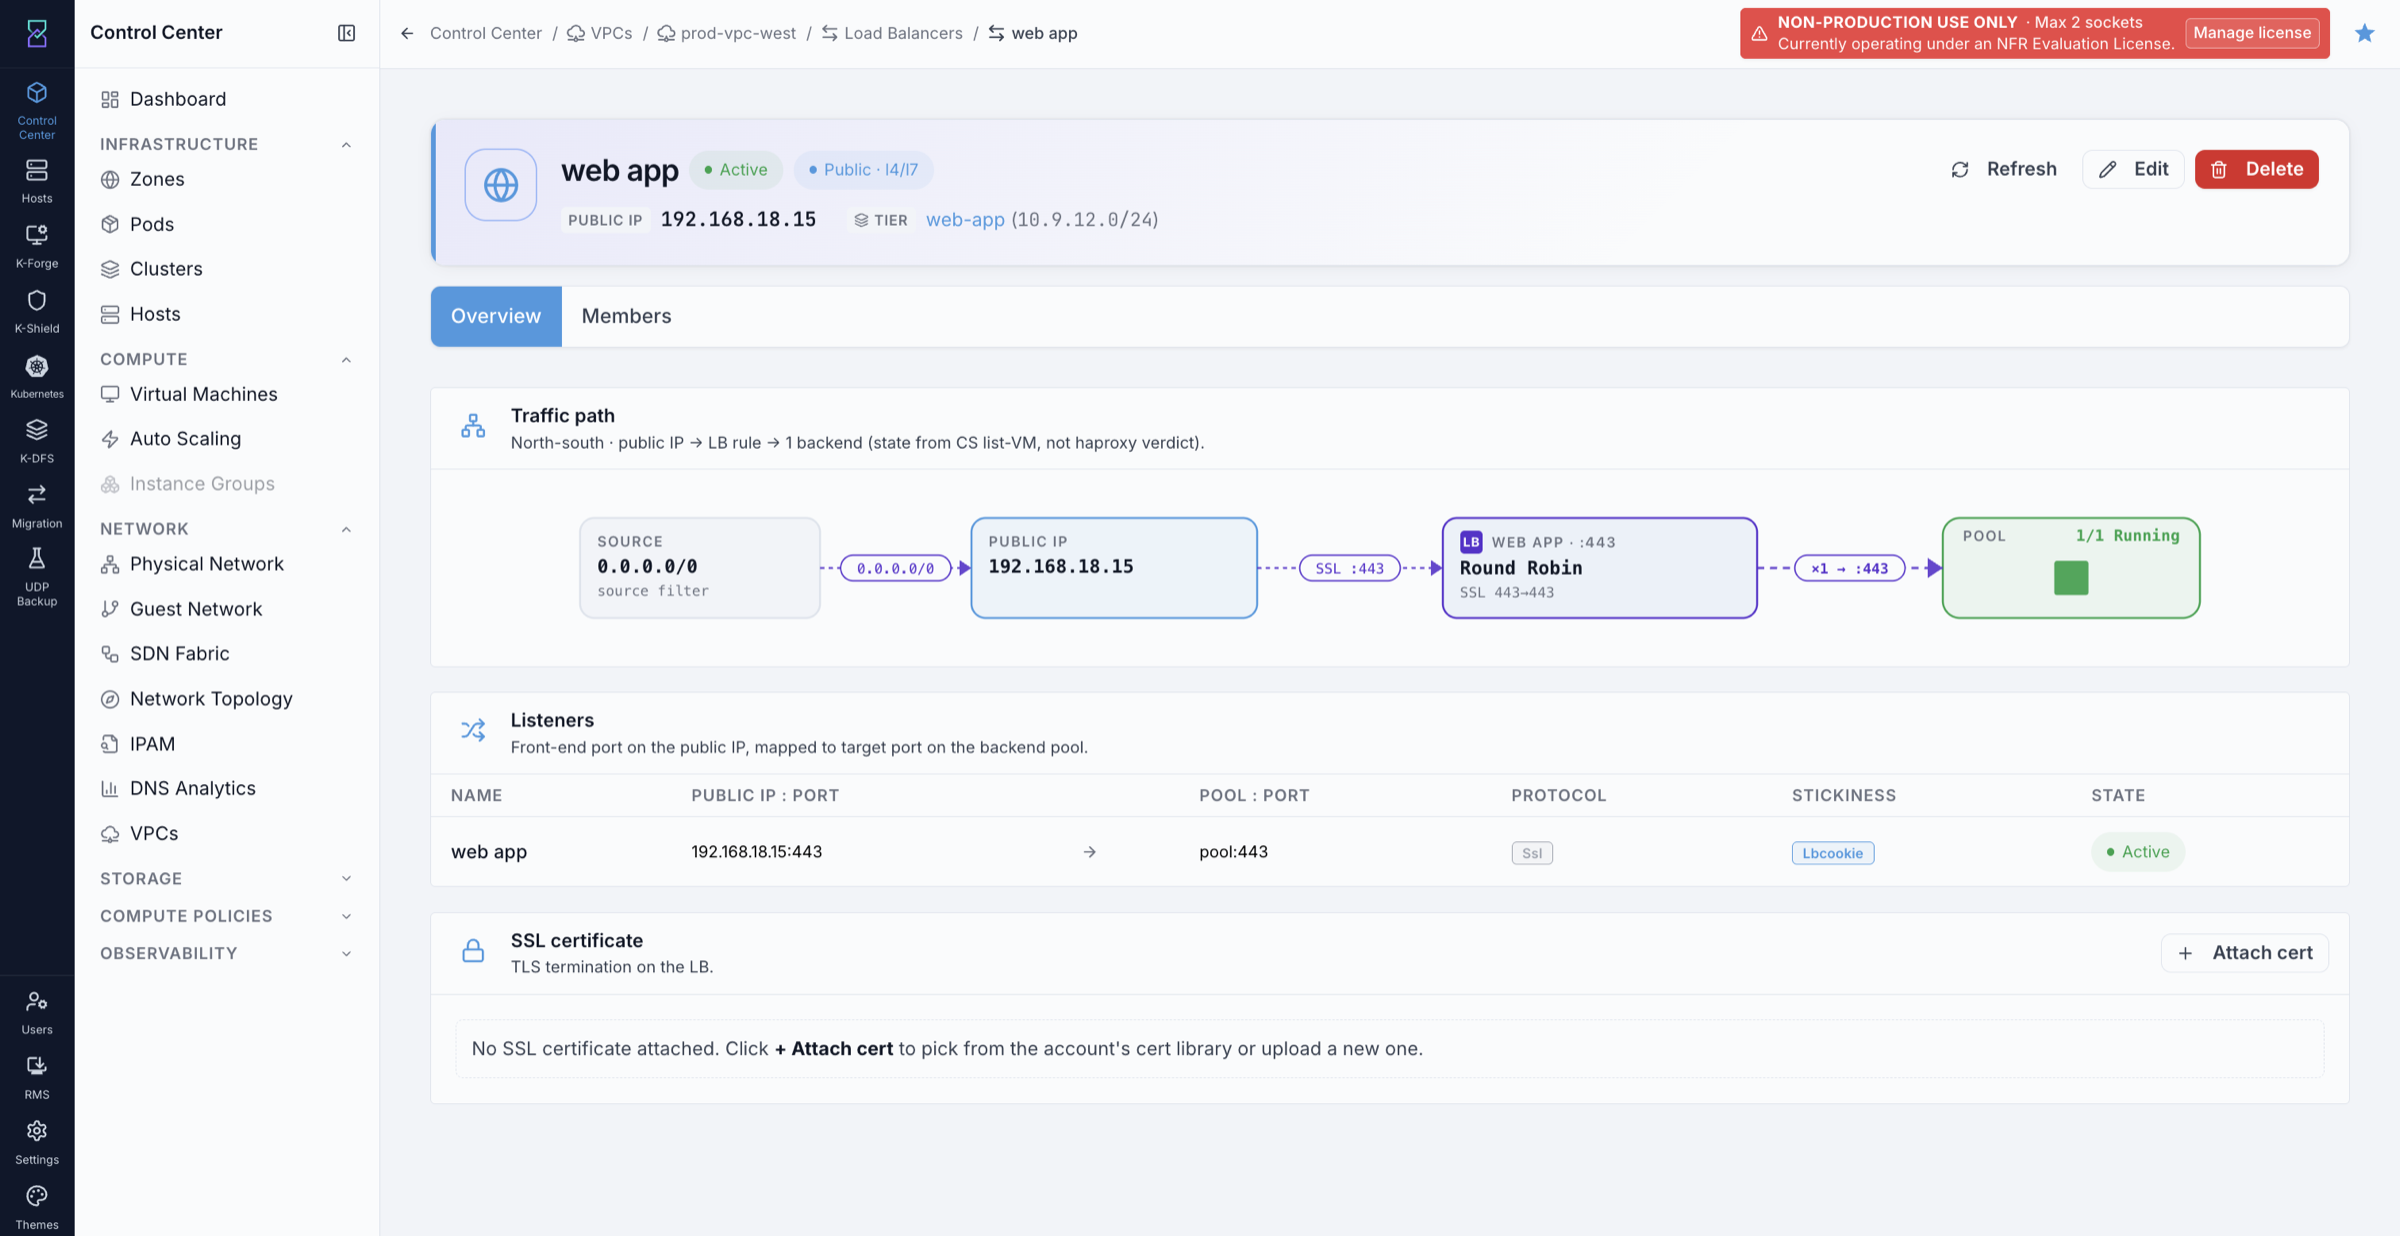
Backend members — VMs added to the pool:
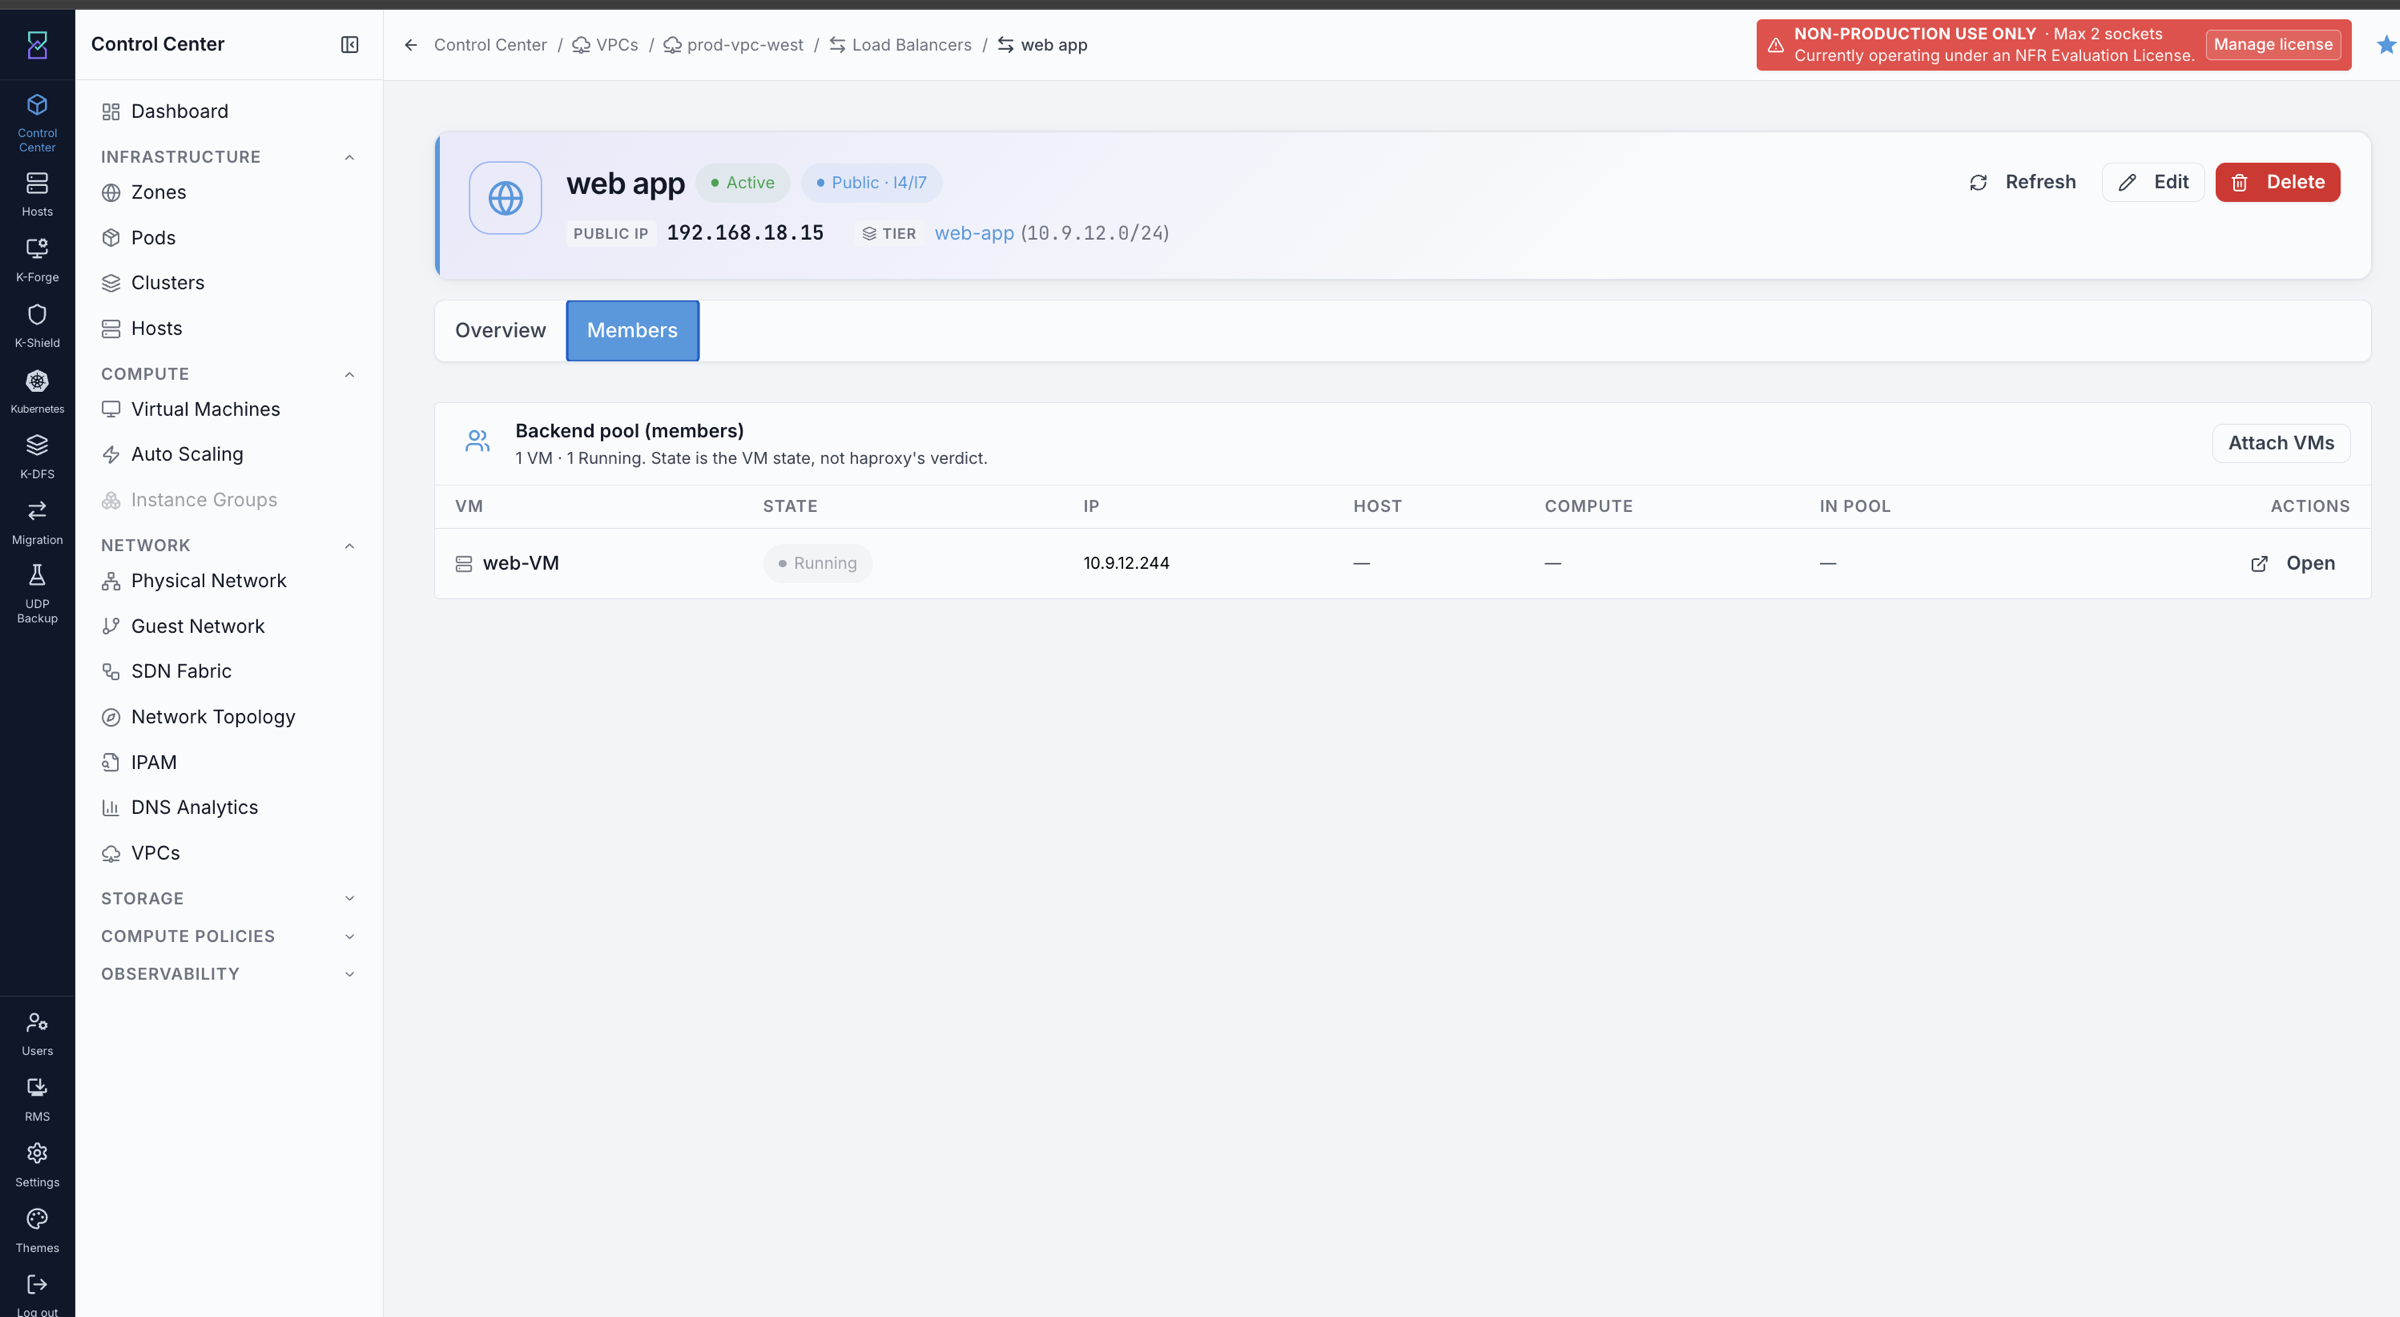
Optional settings:
Stickiness — session affinity to keep a client on the same backend VM. Click Update in the Stickiness column of the Listeners section to configure.
SSL termination — terminate HTTPS at the load balancer by attaching a certificate. See below.
Multiple listeners — multiple port rules can be added to the same LB rule via the Listeners section.
SSL certificate workflow:
SSL certificates are managed at the VPC level on the LB SSL Certs tab, then attached to individual LB rules.
To upload a certificate:
Open the VPC detail page and click the
LB SSL Certstab.Click
+ Upload SSL Certificate.Fill in the fields:
Name— a label for this certificate (for examplewildcard-prod-2026).Certificate (PEM)— paste the full certificate in PEM format.Private key (PEM)— paste the private key. The key is write-only and never returned after upload.Certificate chain (PEM, optional)— paste concatenated intermediate certificates, root last.
Click
Upload.
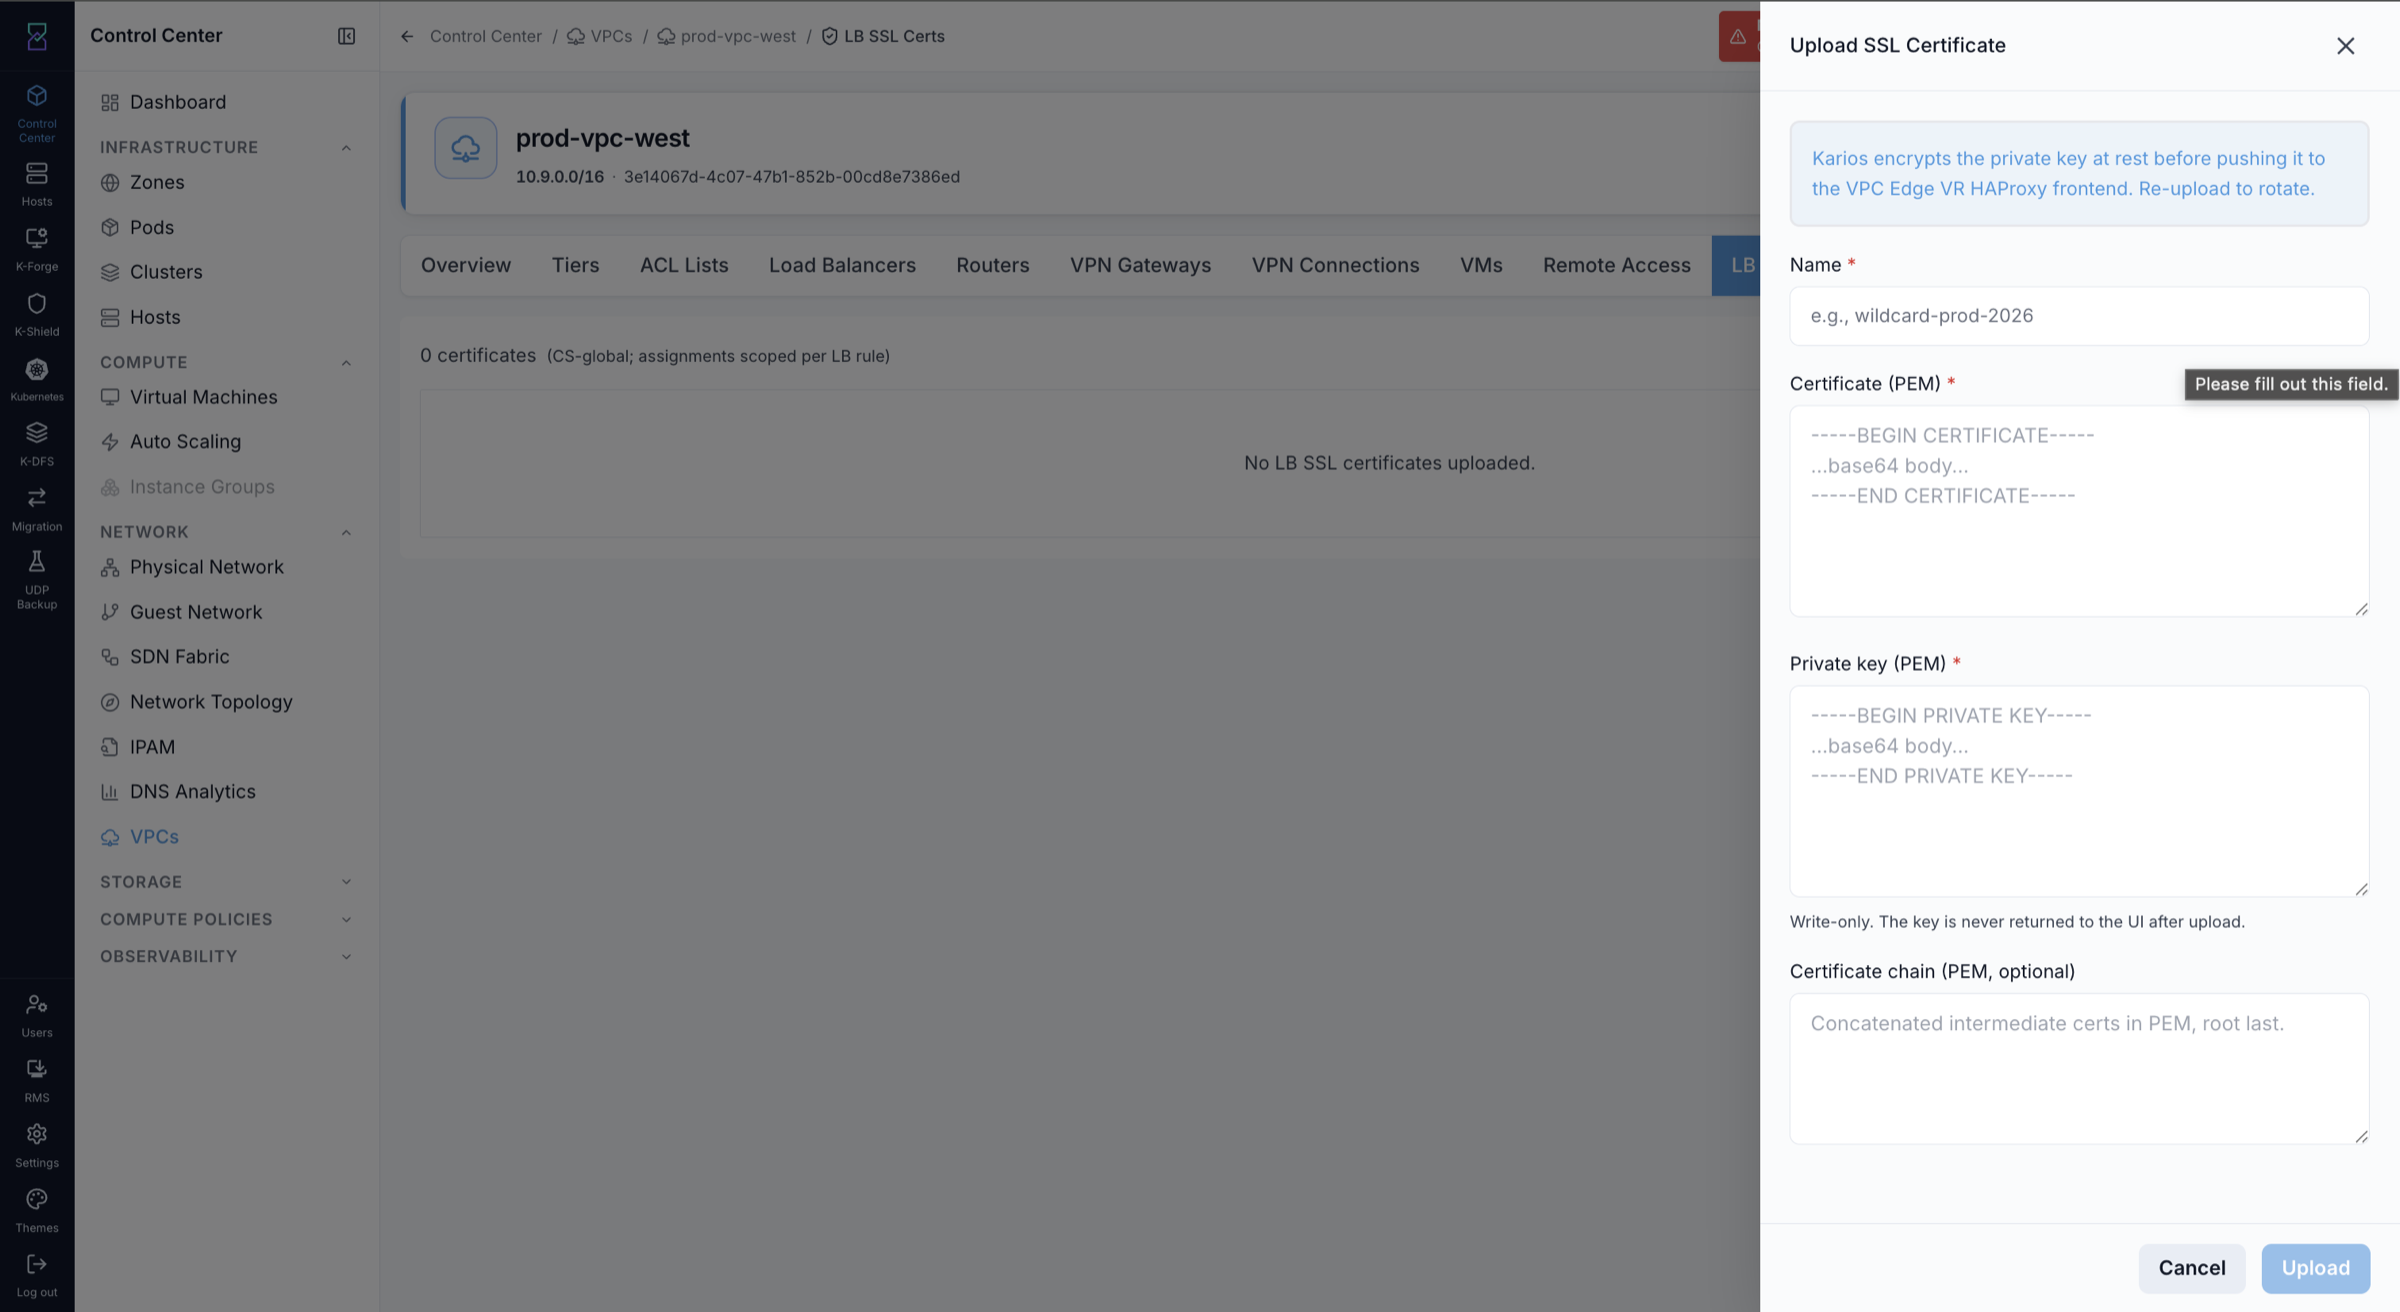
To attach the certificate to an LB rule:
Open the LB rule from the Load Balancers tab.
In the SSL certificate section on the rule’s Overview tab, click
Attach cert.Select the uploaded certificate from the list.
Expected Outcome:
Inbound traffic to the public IP on the configured port is distributed across the backend VM pool.
If this fails:
Confirm the tier is Default — Public LB is not available on InternalLB tiers.
Confirm VMs are running and are in the same tier as the LB rule.
Confirm the public IP is not already bound to a Static NAT rule.
Note
If the LB rule is created but not reachable, confirm the public IP is bound by checking that at least one rule exists on it. Changes propagate within approximately 30 seconds.
8.8.2. Internal Load Balancer
When to Use:
Use this when backend services need a VIP for service-to-service traffic within the VPC (not internet-facing).
Purpose:
Create an internal-only VIP on a Hybrid or InternalLB tier so services can reach a stable address regardless of which VM handles traffic.
Path:
Control Center -> Network -> VPCs -> [VPC name] -> Load Balancers tab
Steps:
Open the VPC detail page and click the
Load Balancerstab.In the Internal Load Balancers section, click
+ Add Internal LB.Fill in the rule fields:
Name— a label for this internal LB rule.Source IP— the internal VIP address that other VMs will connect to.Source Port— the port exposed on the VIP.Instance Port— the port on the backend VMs.Algorithm— Round Robin, Least Connections, or Source IP Hash.Protocol— TCP or UDP.
Click
OKto save the rule, then open the rule and clickAttach VMsto add backend VMs from the same tier to the pool.
Expected Outcome:
The internal LB rule appears in the tier’s Internal LB list with the configured VIP and port.
VMs in the VPC can reach the VIP address and traffic is distributed across the backend pool.
If this fails:
Confirm the tier offering is Hybrid or InternalLB — Default tiers do not support Internal LB.
Confirm the backend VMs are running and in the same tier as the rule.
Confirm the
Source IPis within the tier’s CIDR range.
8.9. Network ACLs
When to Use:
Use this to control which traffic is allowed into or out of a tier.
Purpose:
Apply ingress and egress rules at the tier level to enforce security policy. Tiers without an explicit allow rule deny all ingress by default.
Path:
Control Center -> Network -> VPCs -> [VPC name] -> ACL Lists tab
Steps:
Open the VPC detail page and click the
ACL Liststab. The tab shows all ACL lists for this VPC, including two built-in lists: default_allow (allow all) and default_deny (deny all). These cannot be deleted.Click
+ Create ACL List, give it a name (for exampleweb-tier-acl), and clickOK.Click the ACL list name to open it, then click
+ Add Ruleto add each rule:Action— Allow or Deny.Direction— Ingress (inbound to tier) or Egress (outbound from tier).Protocol— TCP, UDP, ICMP, or All.Ports— port or port range (for TCP/UDP rules).Source CIDR— the IP range the rule applies to.ICMP T/C— ICMP type and code (for ICMP rules only).Reason— optional label for this rule.
After adding rules, go back to the
Tierstab. In the target tier row, click the+ Addbutton and select the ACL list to attach it.
ACL Lists tab row actions:
Edit (pencil icon) — rename the ACL list.
Delete (trash icon) — remove the ACL list. Built-in lists (default_allow, default_deny) cannot be deleted.
Remove — detach the ACL list from a tier (shown in the Attached tiers column).
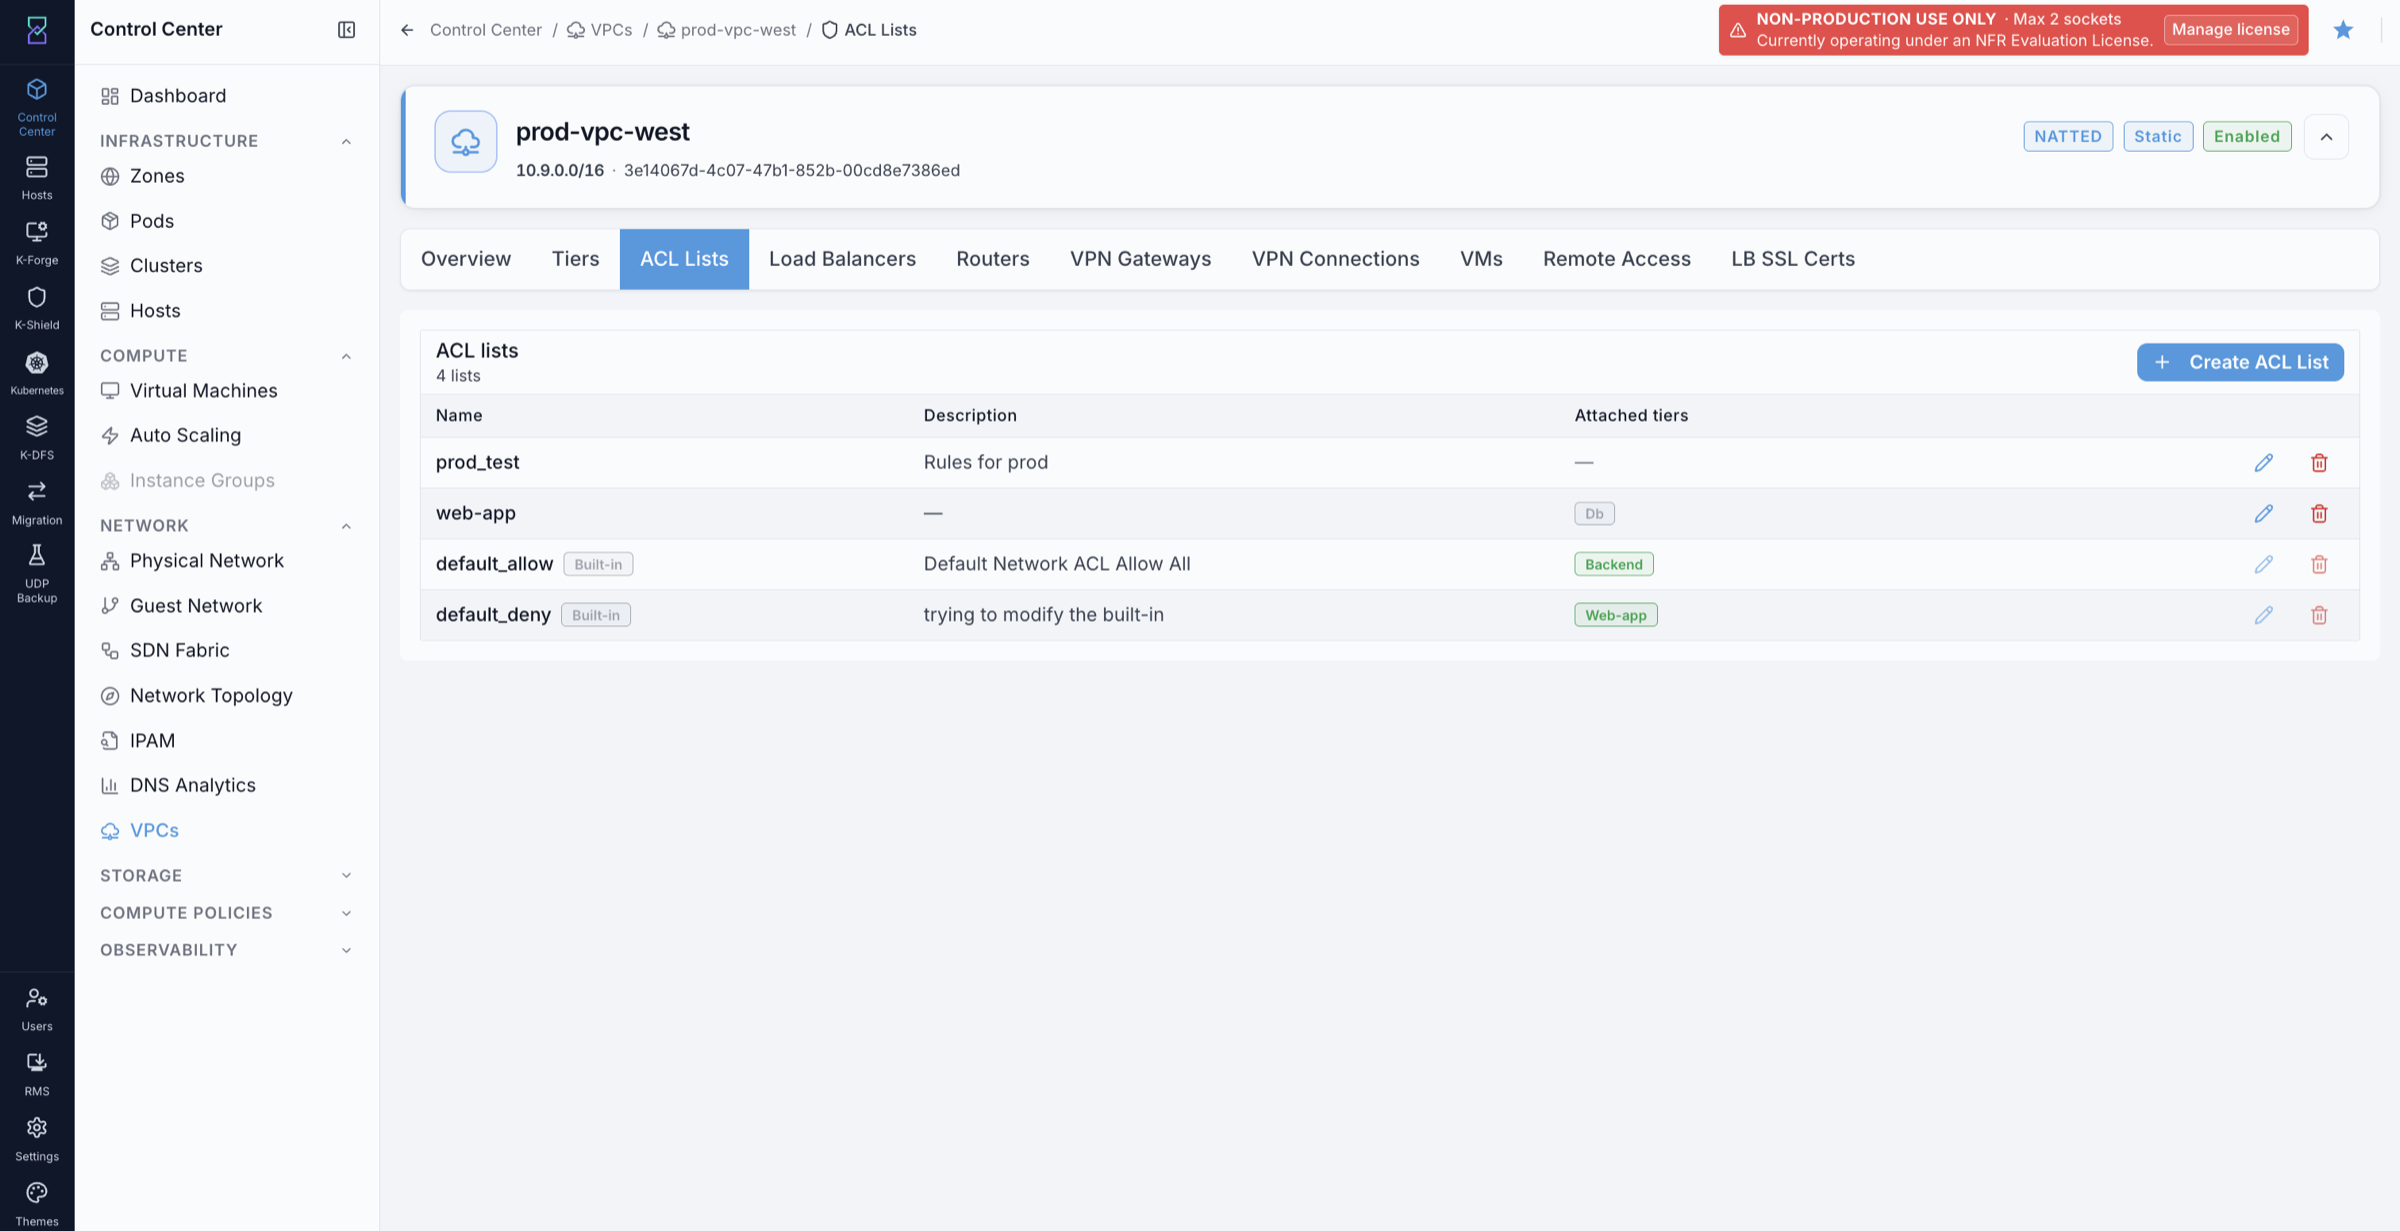
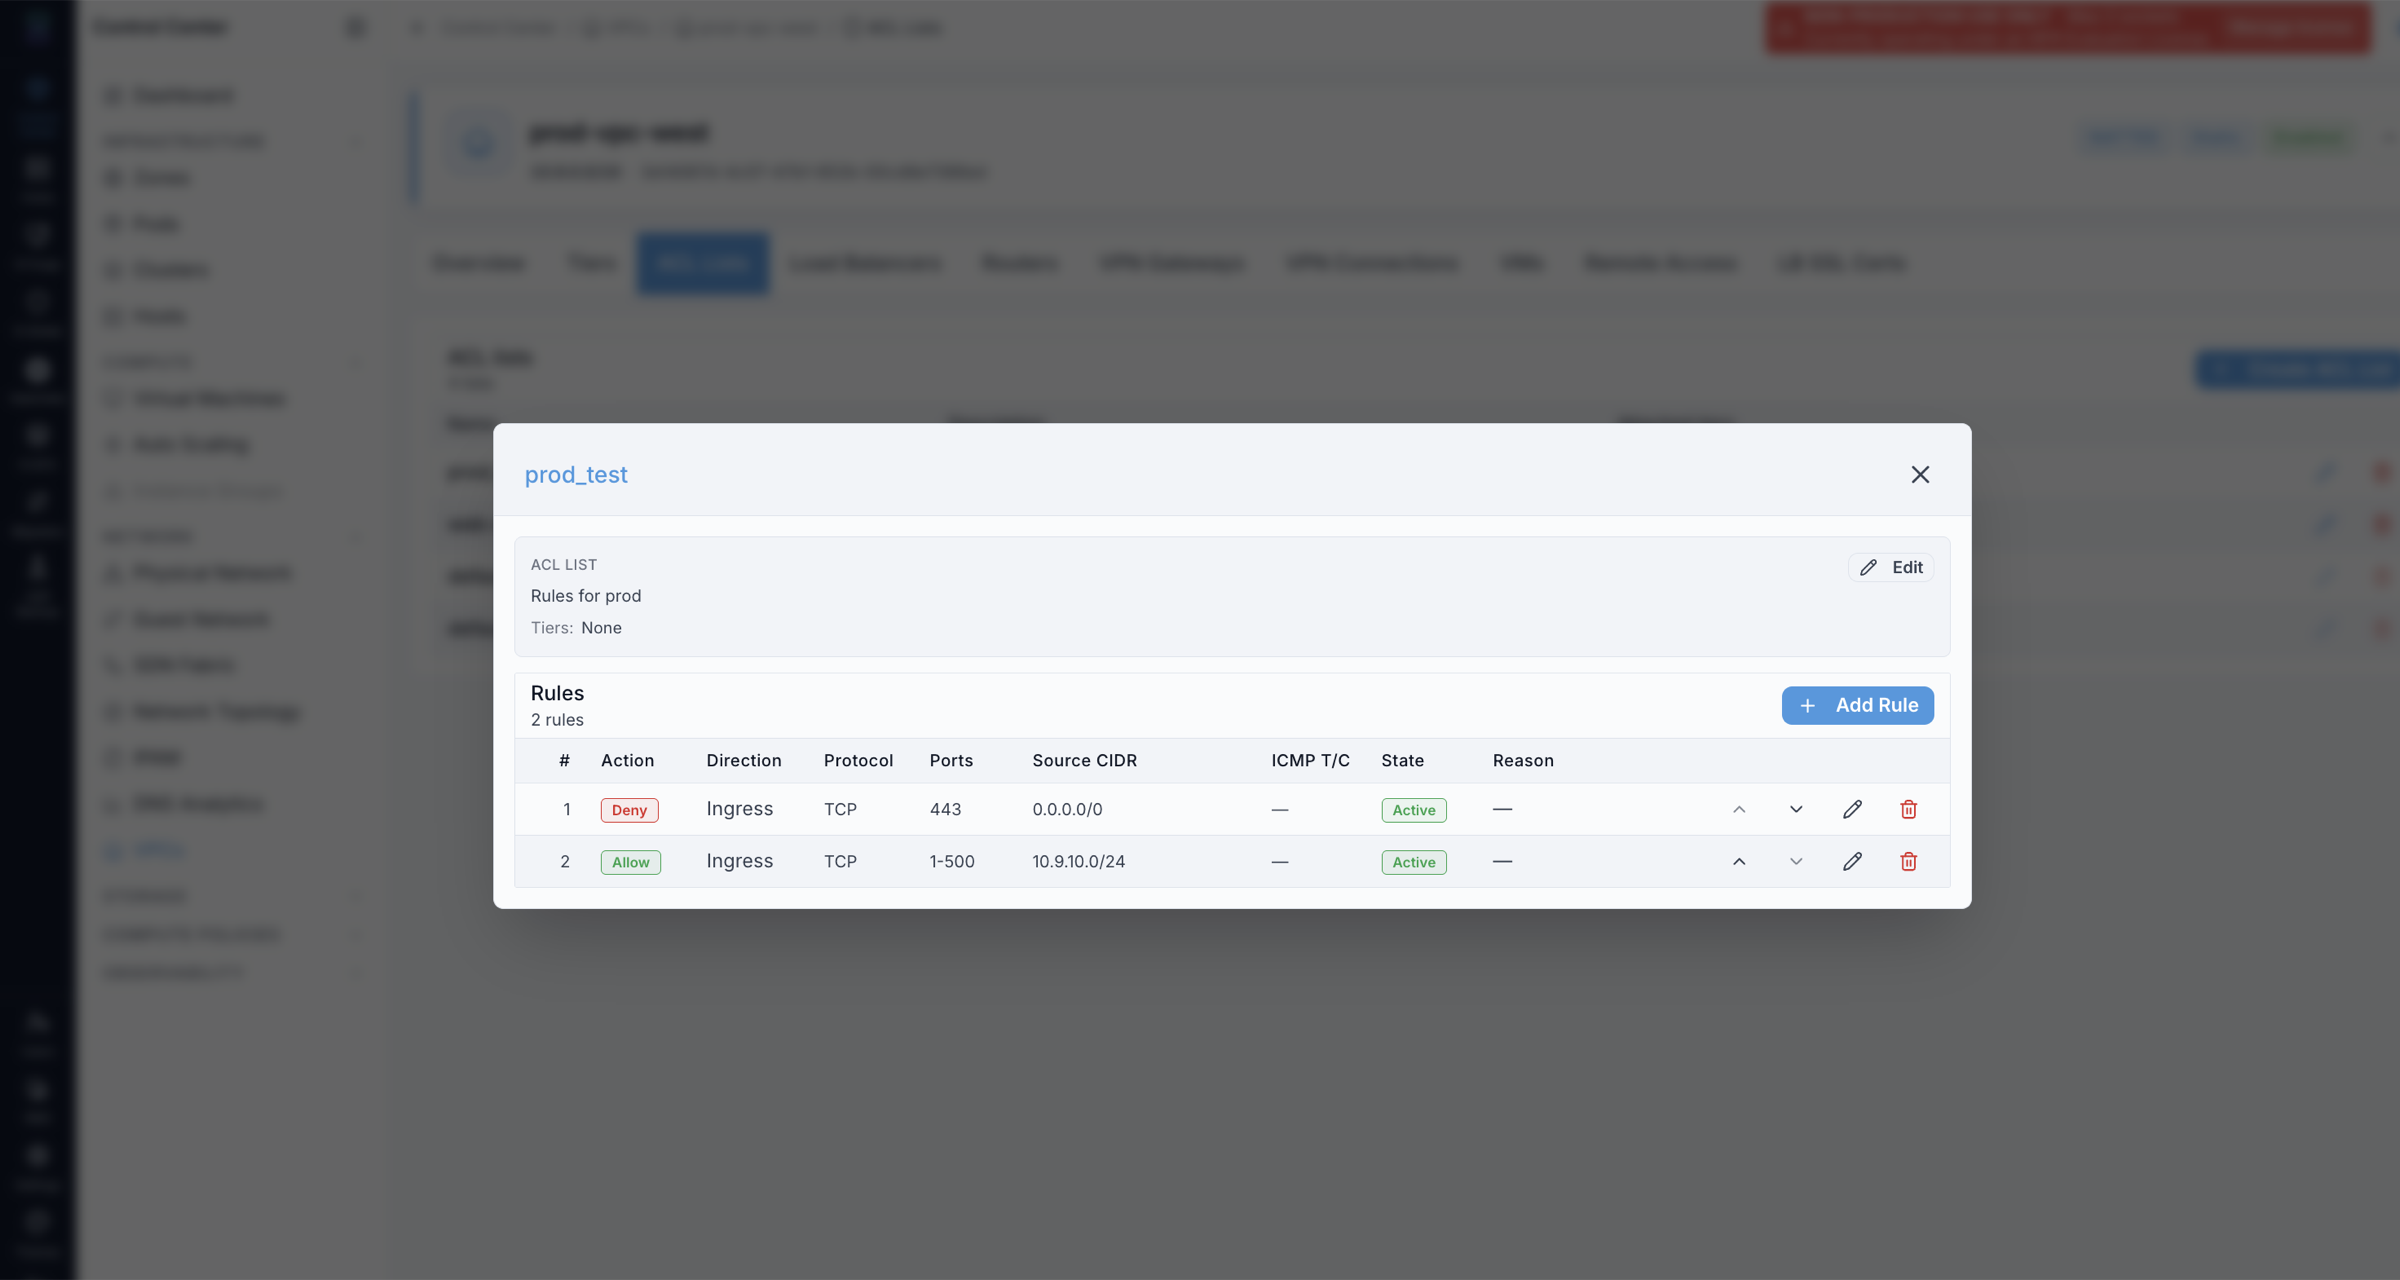
Key behavior:
ACL lists are reusable — one list can be attached to multiple tiers.
Different tiers can have different ACL lists (different security postures per tier).
Default behavior is deny-all ingress until an explicit allow rule is added.
Rules are evaluated in order — first match wins.
Expected Outcome:
The tier accepts or rejects traffic according to the ACL rules in the attached list.
If this fails:
Confirm the ACL list is attached to the correct tier.
Review rule order — a deny rule earlier in the list blocks traffic before a later allow rule is evaluated.
Confirm the protocol, port range, and CIDR in the rule match the expected traffic.
8.10. Site-to-Site VPN
When to Use:
Use this to connect an on-premises network to the VPC so on-premises hosts can communicate with VMs in VPC tiers.
Purpose:
Create an encrypted tunnel between the VPC and an on-premises firewall or VPN device.
Site-to-Site VPN uses two separate tabs — VPN Gateways and VPN Connections. Complete them in order.
Step 1 — Add a VPN Gateway
Path: Control Center -> Network -> VPCs -> [VPC name] -> VPN Gateways tab
Open the VPC detail page and click the
VPN Gatewaystab. The tab shows the VPC’s public IP — this is the Karios side of the tunnel.Click
Create VPN Gatewayif one does not already exist.
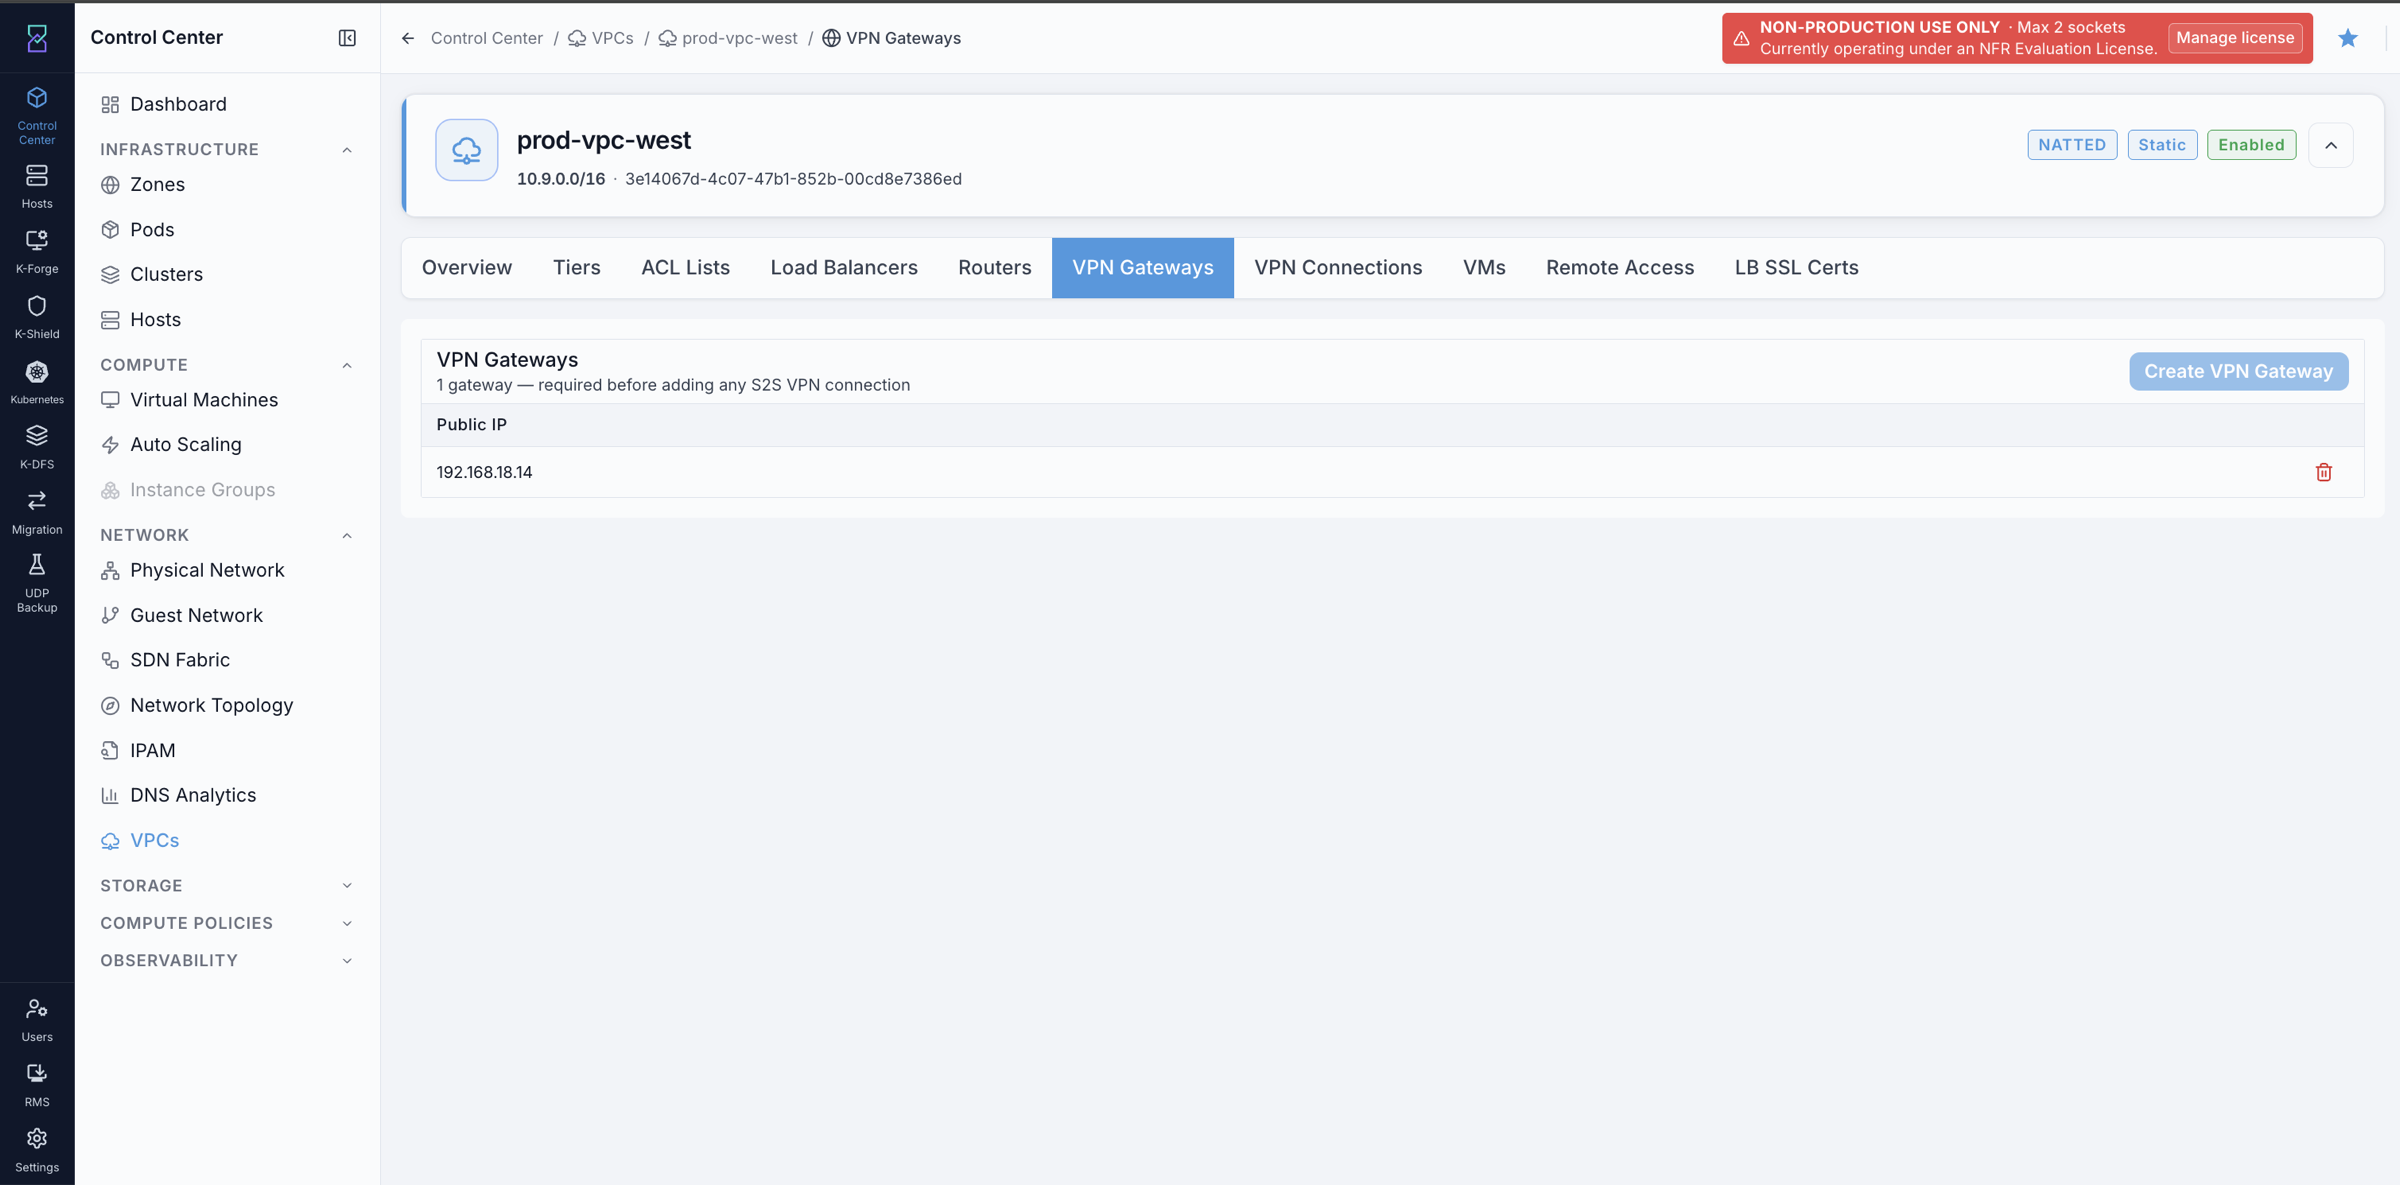
Step 2 — Add a Customer Gateway and Connection
Path: Control Center -> Network -> VPCs -> [VPC name] -> VPN Connections tab
Click the
VPN Connectionstab.In the Customer gateways (peers) section, click
Add Customer Gateway.Fill in the remote on-premises endpoint details (public IP and remote CIDR).
Click
Add Connectionto create the tunnel between the VPC gateway and the customer gateway.Confirm the tunnel state in the S2S VPN connections section.
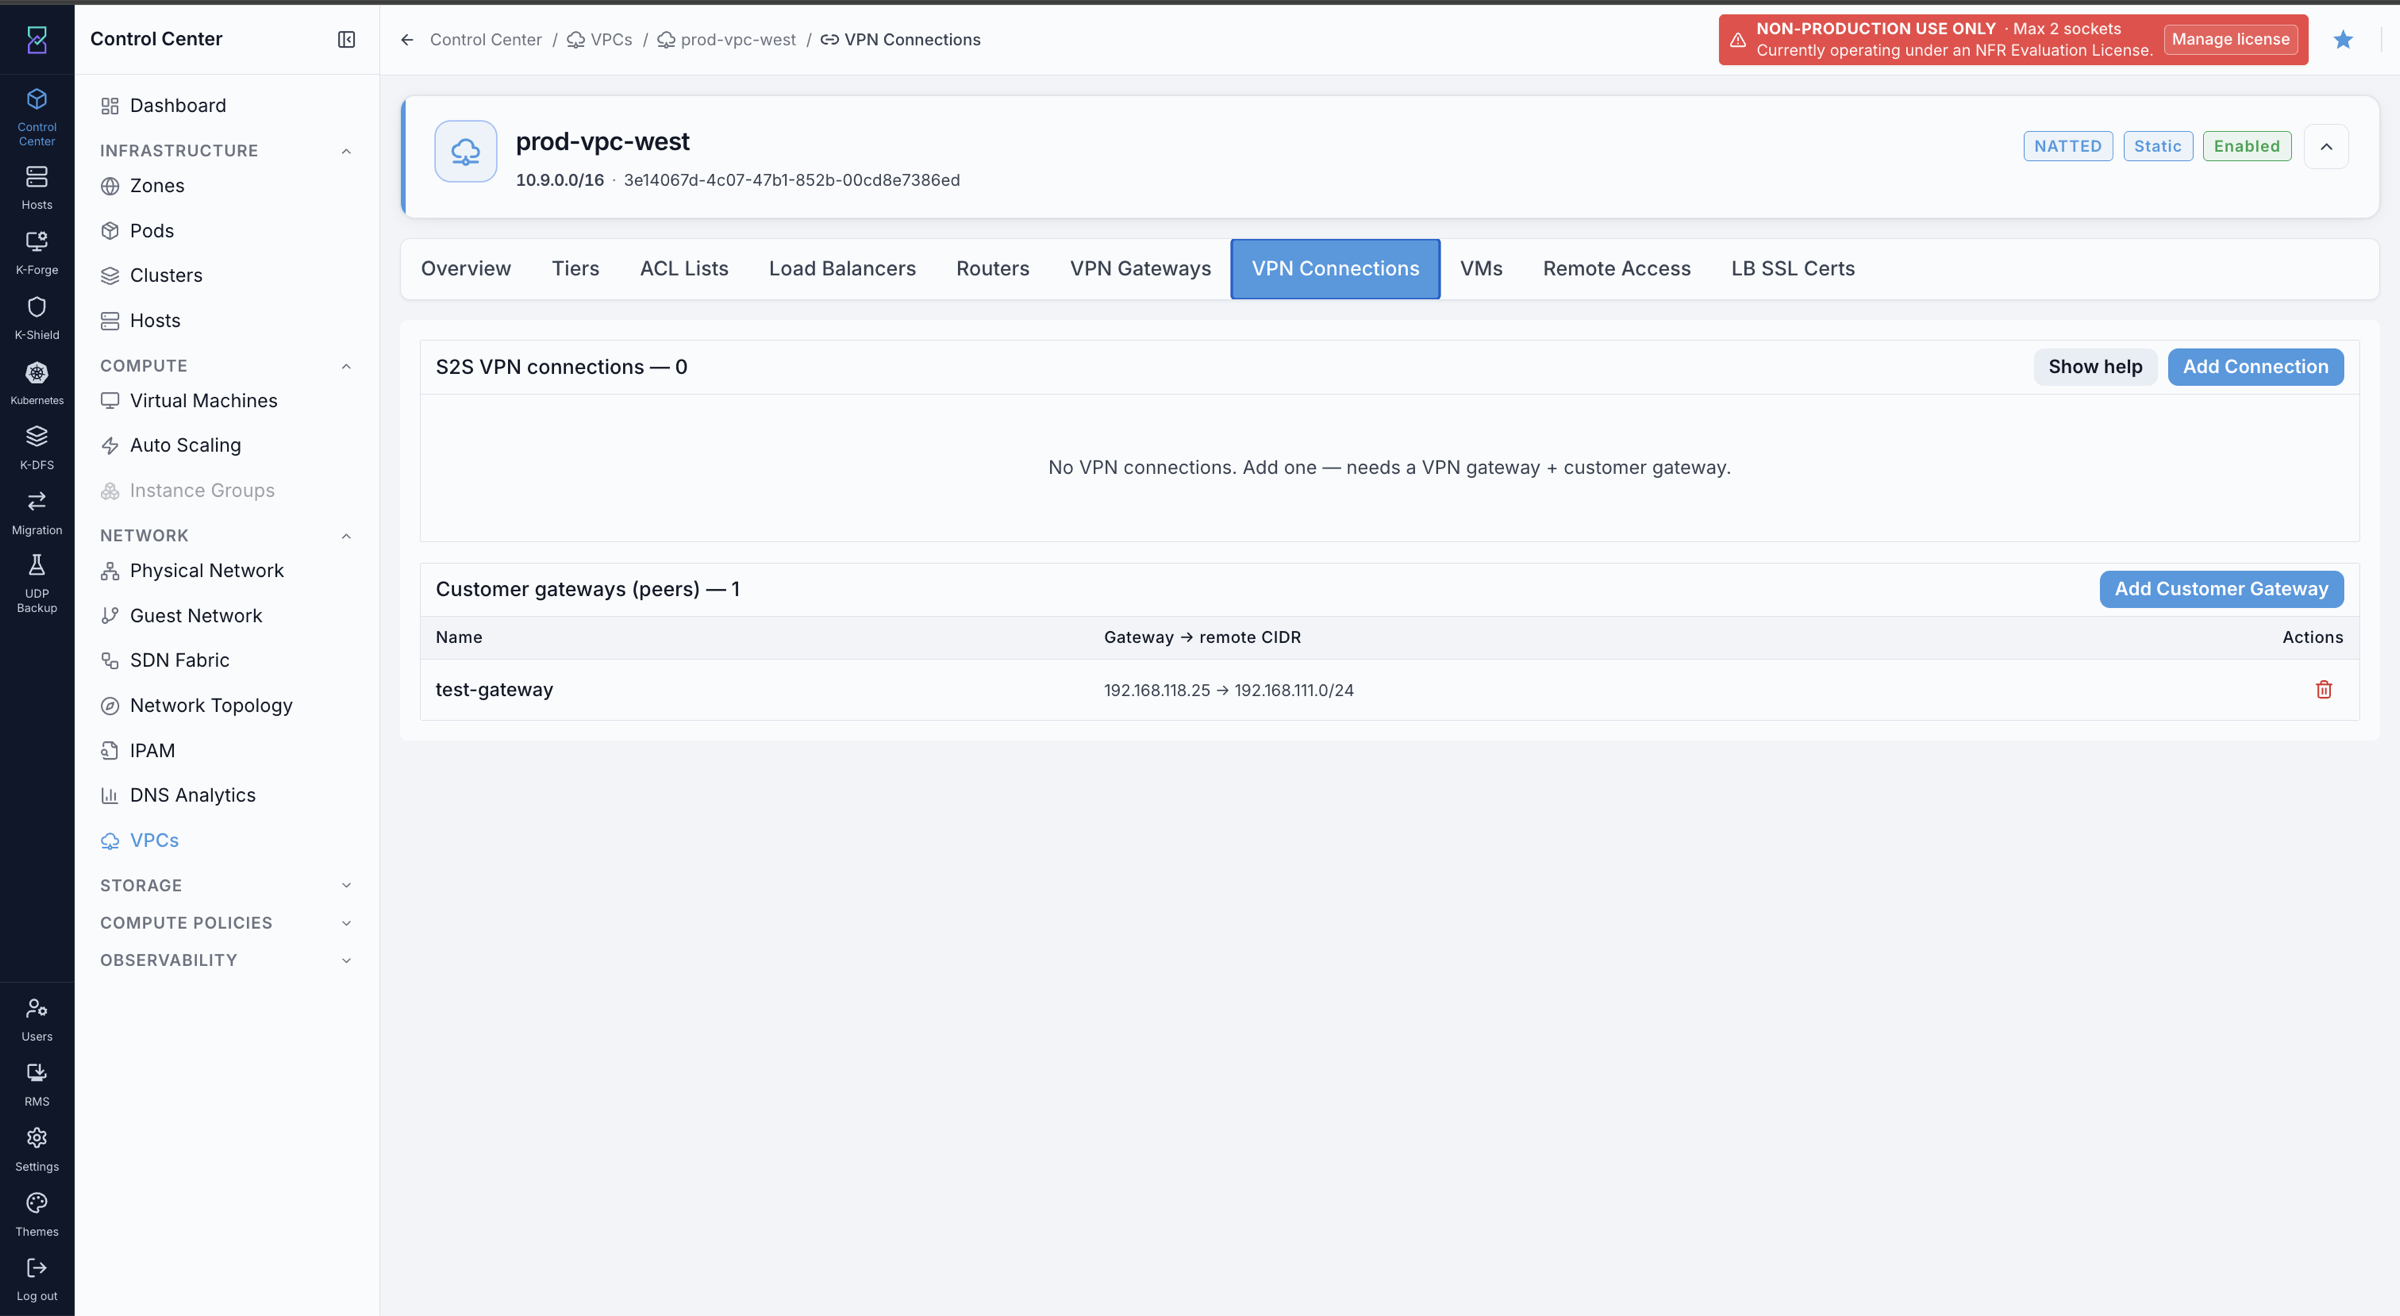
Expected Outcome:
The S2S VPN connection appears in the list with an active state.
On-premises hosts can reach VMs in the VPC tiers over the tunnel.
If this fails:
Confirm the customer gateway public IP and remote CIDR are correct.
Confirm the VPC CIDR does not overlap the on-premises network CIDR.
Review the connection status for negotiation errors — the status field shows the current phase.
8.10.1. Remote Access VPN (L2TP / IPsec)
When to Use:
Use this when individual users need to dial in to the VPC from their device — not for connecting entire on-premises networks (use Site-to-Site VPN for that).
Purpose:
Enable a per-user L2TP/IPsec VPN endpoint on the VPC so remote users can reach VMs inside the VPC.
Compatible clients: macOS, Windows, iOS, Android, strongSwan / xl2tpd on Linux — all using the native L2TP/IPsec VPN client built into the OS.
Path:
Control Center -> Network -> VPCs -> [VPC name] -> Remote Access tab
Prerequisite:
The VPC must have a Source NAT public IP already acquired. The Remote Access endpoint is bound to this IP. If no source NAT IP exists, acquire one first from the
Public IPstab — the Enable RAS button will be unavailable until this is done.
Steps — Enable the RAS server:
Open the VPC detail page and click the
Remote Accesstab.In the RAS server section, click
Enable RAS.Note the public IP and the auto-generated pre-shared key (PSK) that appear after enabling.
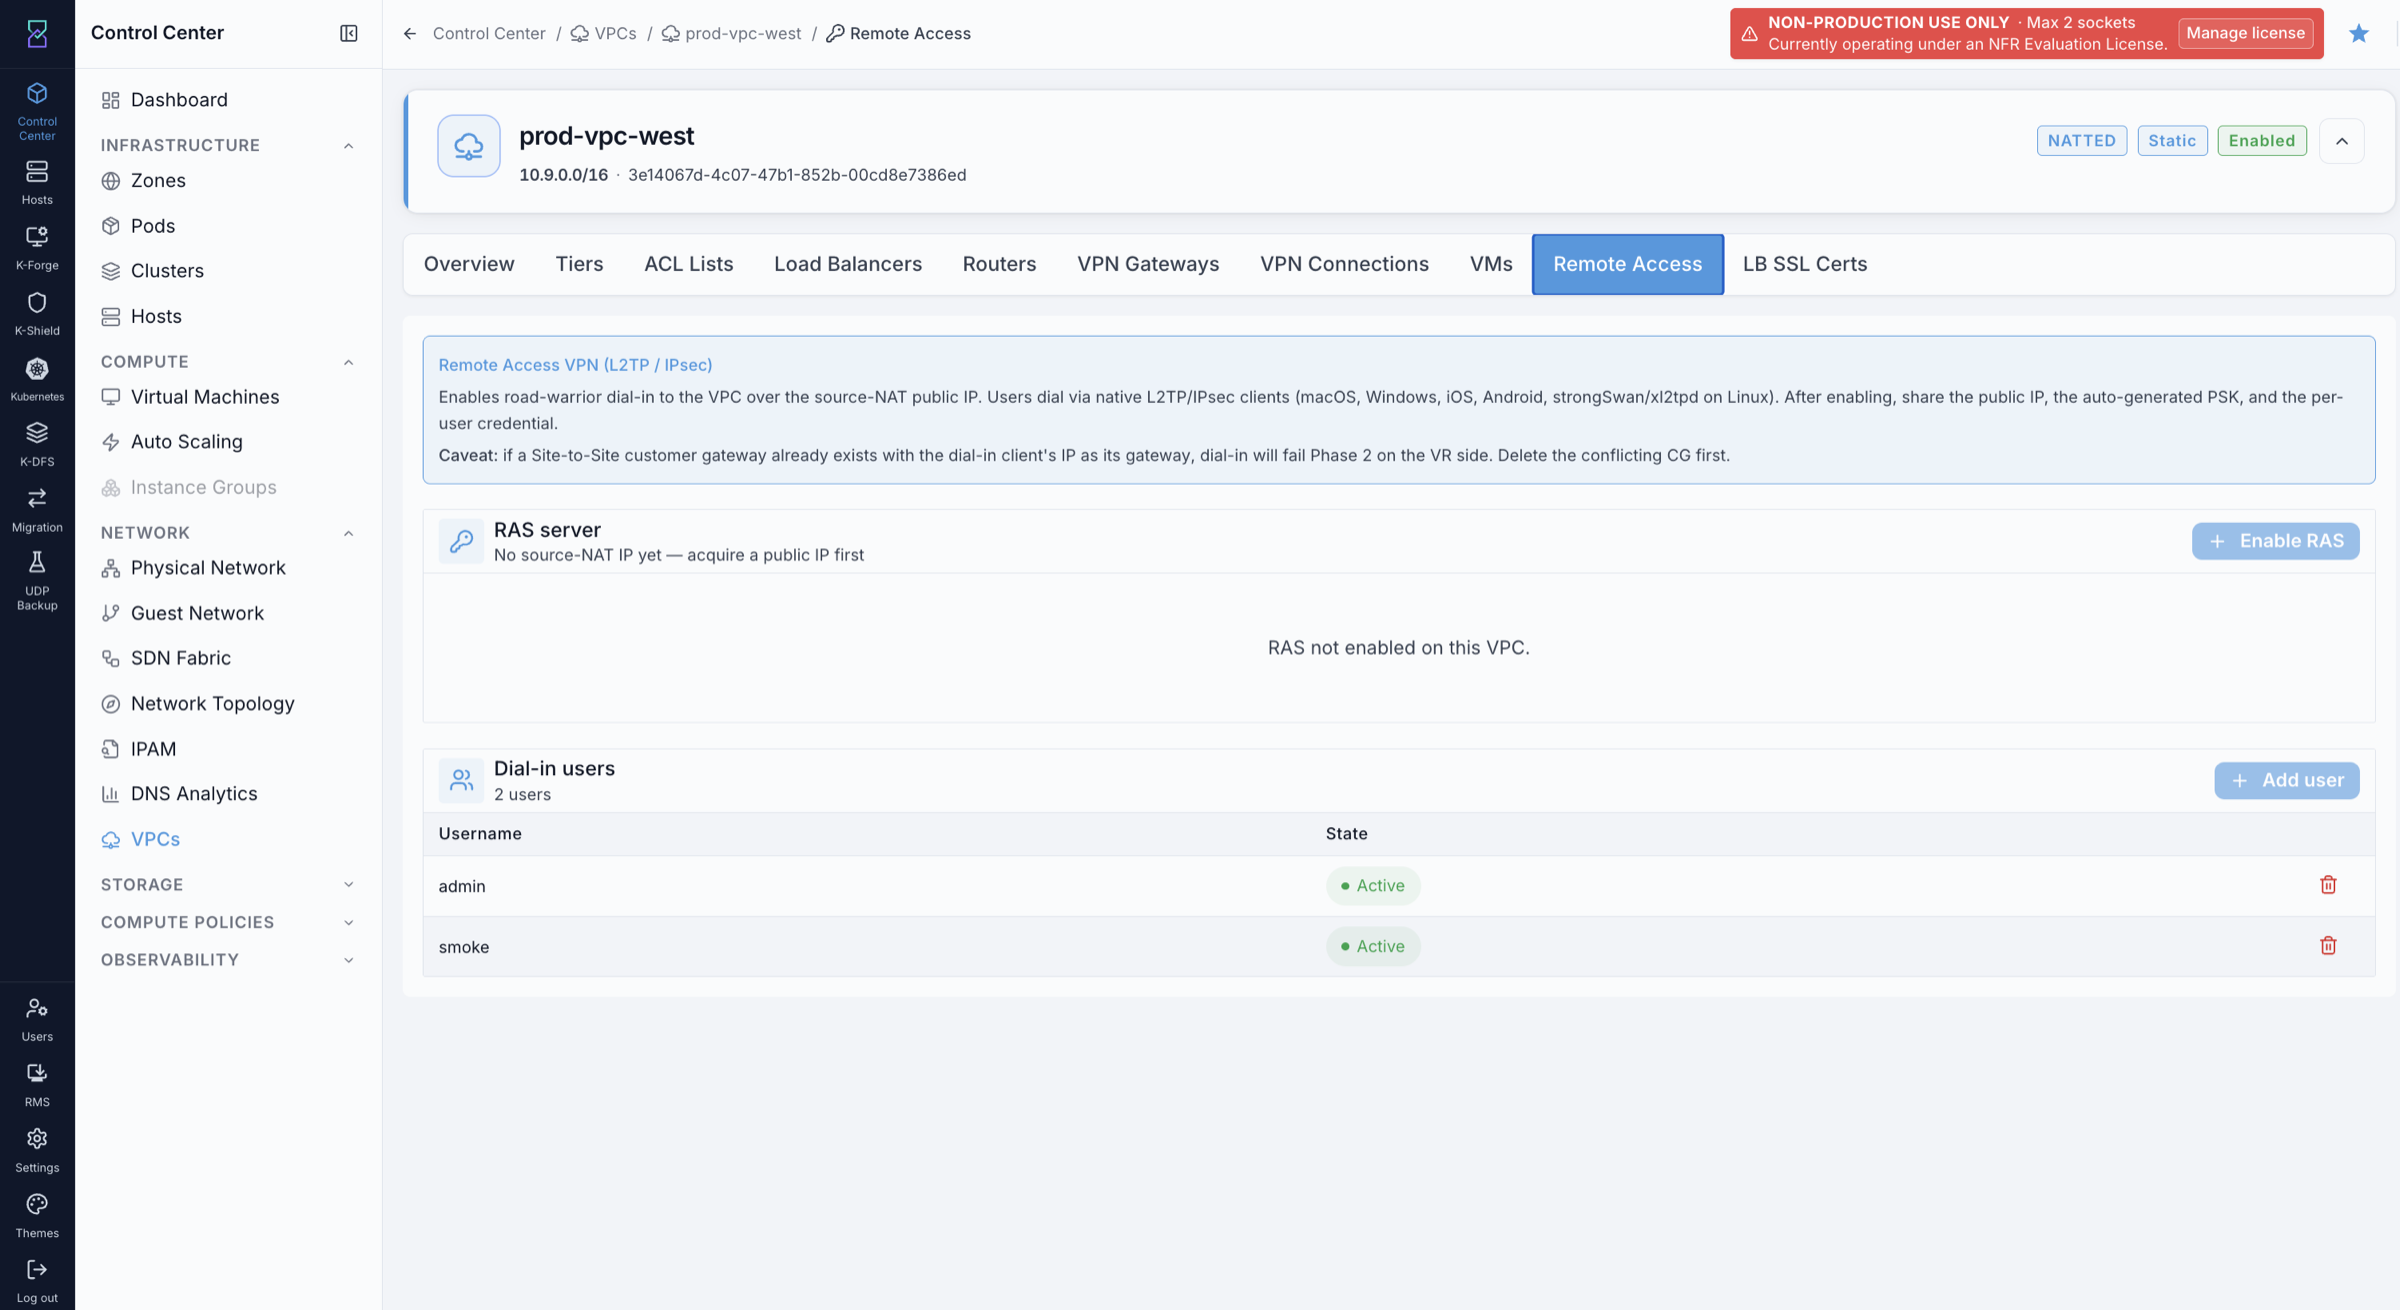
Steps — Add dial-in users:
In the Dial-in users section, click
Add user.Enter the username and password for the user.
Share the public IP, PSK, username, and password with the user so they can configure their VPN client.
Expected Outcome:
RAS server section shows the VPN as enabled with the public IP and PSK.
Dial-in users section lists added users with state Active.
Users can connect using the L2TP/IPsec client on their device with the public IP, PSK, and their credentials.
If this fails:
Confirm the VPC has a Source NAT public IP — the Enable RAS button is unavailable without one.
Confirm the VPC router is in state Running (check the Routers tab).
If a user cannot connect: verify the public IP, PSK, and credentials are correct. If a Site-to-Site customer gateway already uses the user’s IP as its gateway, remove the conflicting gateway first.
8.11. AutoScale
When to Use:
Use this when a public-facing tier needs to automatically add or remove VMs based on load.
Purpose:
Attach an AutoScale VM group to a Public Load Balancer rule on a Default tier so VM count adjusts automatically.
Requirements:
Tier must use the Karios VPC Tier – Default offering.
A Public Load Balancer rule must already exist on the tier.
Steps:
Open the Public Load Balancer rule on a Default tier.
Click
Attach AutoScale VM Group.Configure:
Min and max VM instance counts.
Scale-up and scale-down policies (CPU or memory thresholds).
VM template and service offering for new instances.
Save the AutoScale group.
Expected Outcome:
New VMs are provisioned automatically when scale-up conditions are met and removed when scale-down conditions are met.
If this fails:
Confirm the tier is Default — the
Attach VM Groupoption is not available on Hybrid or InternalLB tiers.Confirm a Public Load Balancer rule exists before attaching the AutoScale group.
8.12. Tier Offering Selection Guide
Use this guide to choose the correct tier offering before creating tiers:
Does this tier need a public IP (LB / Static NAT / Port Forwarding)?
├── Yes → Does it ALSO need an internal VIP for service-to-service traffic?
│   ├── Yes → Hybrid
│   └── No  → Default
└── No  → InternalLB
Examples:
Topology |
Tier Pattern |
|---|---|
3-tier web application |
web = Default, app = InternalLB, db = InternalLB |
App with public bastion and private database |
bastion = Default, db = InternalLB |
Mixed-mode tier (jumphost + internal service VIP) |
Hybrid |
8.13. Current Release Limitations
Feature |
Status |
|---|---|
Routed (BGP) mode VPCs |
Not supported. Only NAT’d mode is available. |
IPv6 |
Not supported. IPv4 only. |
Cross-zone VPCs |
Not supported. One VPC lives in one zone. |
VPC peering |
Not supported in current release. On the roadmap. |
CIDR resize after creation |
Not supported. Plan the supernet at create time. |
8.14. Troubleshooting
Symptom |
First Place to Check |
|---|---|
Tier create rejected |
Tier CIDR overlaps an existing tier or is outside the VPC supernet. The error message names the conflict. |
VM in tier cannot reach the internet |
Confirm the tier offering. InternalLB tiers have no outbound NAT by design. |
Public LB rule created but not reachable |
The public IP must have at least one rule bound to a tier. Wait up to 30 seconds for propagation after adding the rule. |
|
AutoScale requires a Default tier. Hybrid and InternalLB tiers do not support AutoScale. |
LB listener on port 443 but TLS is not terminating at the load balancer |
|
Quick Links
Use these quick navigation links:
Traffic Types for Management/Storage/Public/Guest traffic operations.
Network States for Allocated/Implementing/Setup behavior.
Create Guest Network for isolated/shared network creation fields.
SDN Fabric for routing observability (OSPF/BGP/EVPN/RIB).
Network Topology for dashboard, node, alert, and tab-level network health checks.
IPAM for IP, VLAN, and DHCP scope audit/capacity visibility.
DNS Analytics for DNS volume, response, client/domain, and protocol visibility.
Bridges for bridge-member and traffic/error visibility in node details.
Interfaces for NIC-level health and counters in node details.
VPCs for isolated virtual networks, tiers, public IPs, load balancing, ACLs, and VPN.
VPC Tier Selection Guide for choosing Default, Hybrid, or InternalLB tier offerings.
→ Next: Storage