Kubernetes on Karios
Karios Managed Kubernetes (k8s) lets you create and run production-grade Kubernetes clusters directly from Control Center. Karios provisions the control-plane and worker nodes, installs Kubernetes, and gives you a single place to view, connect to, scale, and test each cluster.
Overview
k8s and k3s on Karios
Karios offers Kubernetes in two forms, shown side by side as cards on the same Kubernetes dashboard. This page covers k8s (managed); the lightweight k3s has its own guide.
Option |
What it is |
Choose it when |
|---|---|---|
k8s |
Fully managed Kubernetes. Karios provisions the control-plane and worker VMs, installs Kubernetes, and runs the control plane for you. |
You want a production-grade cluster with high availability, autoscaling, and built-in cluster tests. |
A lightweight, self-managed Kubernetes distribution you run yourself. |
You want a small, low-overhead cluster for development, edge, or lightweight production. |
How to access Kubernetes
Sign in to Control Center (the Karios web console).
Open Kubernetes from the left sidebar.
The Kubernetes dashboard opens with two cards, Kubernetes (k8s) and k3s. All managed-Kubernetes work in this guide starts from the k8s card.
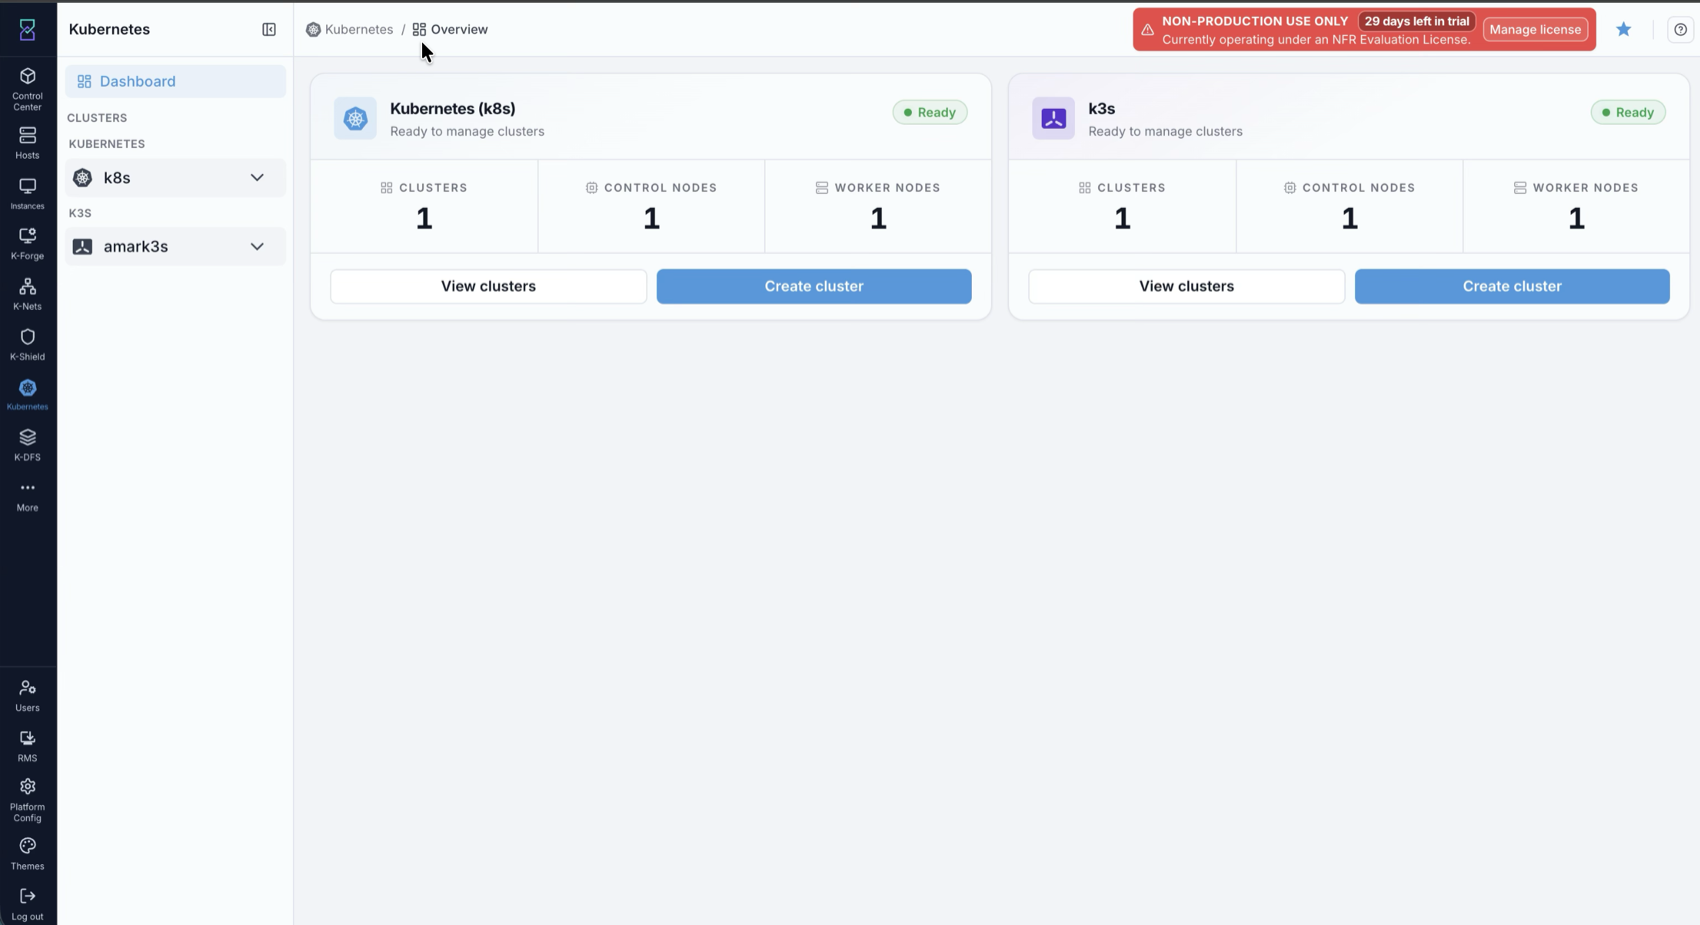
What you’ll see in the screenshot above:
On each card you also see a Ready badge once it is initialized, Clusters /
Control nodes / Worker nodes counts, and View clusters / Create cluster
actions.
Who can access it (RBAC)
Access to Kubernetes is governed by role-based access control (RBAC): your Karios role must carry Kubernetes permissions.
View clusters - Kubernetes and Node view permissions.
Create, scale, and delete clusters - Kubernetes and Node manage permissions.
These are typically carried by the DevOps and Admin roles. If the Kubernetes sidebar item or the k8s card is missing, your role does not have Kubernetes access yet - ask an administrator to enable it.
See also
Before creating clusters:
Infrastructure for healthy host capacity
Networking for guest/public network readiness
Instance Profiles and VM Templates for node sizing and images
Key concepts
Cluster - the control-plane and worker nodes Karios provisions to run your workloads.
Control nodes - run the cluster control plane; Karios uses a single control node by default, or an odd number when HA is enabled.
Worker nodes - run your application workloads; you set and scale their count.
Kubernetes version - the Kubernetes release Karios installs, chosen on the create form.
Zone - the Karios zone the cluster is deployed in.
Prerequisites
Before you create your first cluster, make sure the following are in place. Access (RBAC) is covered in Who can access it (RBAC) above.
Instance profile
Cluster nodes are sized by an instance profile. Before creating a cluster, make
sure an instance profile is available that meets the minimum of 2 cores, 1000 MHz
CPU, and 2048 MB RAM (create a dedicated k8s profile if your environment does not
have one). The chosen profile’s CPU and memory are shown on the cluster’s Details
tab.
Zone must be initialized
Kubernetes must be initialized once per zone before the first cluster can be
created there. On the Kubernetes dashboard, use Initialize Kubernetes (k8s) on
the k8s card and select the zone. Karios downloads and configures the Kubernetes Boot
Image and control components; this can take several minutes and progress is shown on
screen. The k8s card shows Setup required until it is ready and Ready when
clusters can be created. (This is the k8s equivalent of the k3s initialization in
k3s on Karios.)
Note
If all Kubernetes versions are being destroyed, wait for that process to finish before re-initializing.
Getting Started
The end-to-end flow for a first-time user is:
Initialize Kubernetes in your zone (one-time, from the k8s card).
Create a cluster (see Managing Clusters).
Fetch the kubeconfig from the cluster’s Access tab and connect with
kubectl(a successfulkubectl get nodeslists your cluster’s nodes).
From the k8s card, Create cluster opens the create form and View clusters opens the Kubernetes cluster list.
Managing Clusters
Creating a cluster
From the k8s card (or the + K8s cluster button on the cluster list), choose
Create cluster and fill in the Create Kubernetes Cluster form.
Field |
Required |
Notes |
|---|---|---|
Cluster Name |
Yes |
Name for the cluster; used to name each node VM ( |
Description |
Yes |
Short description shown in the cluster list and overview. |
Zone |
Yes |
Must be initialized for Kubernetes. |
Kubernetes Version |
Yes |
The Kubernetes release to install (for example |
Instance Profile |
Yes |
Compute size for the nodes; must meet the minimum (2 cores / 1000 MHz / 2048 MB). |
Network |
Yes |
The guest network the cluster attaches to. |
Cluster Size (Number of worker nodes) |
Yes |
Worker node count; minimum 1. The control plane runs on a single node by default; enable HA in Advanced Settings for multiple control nodes. |
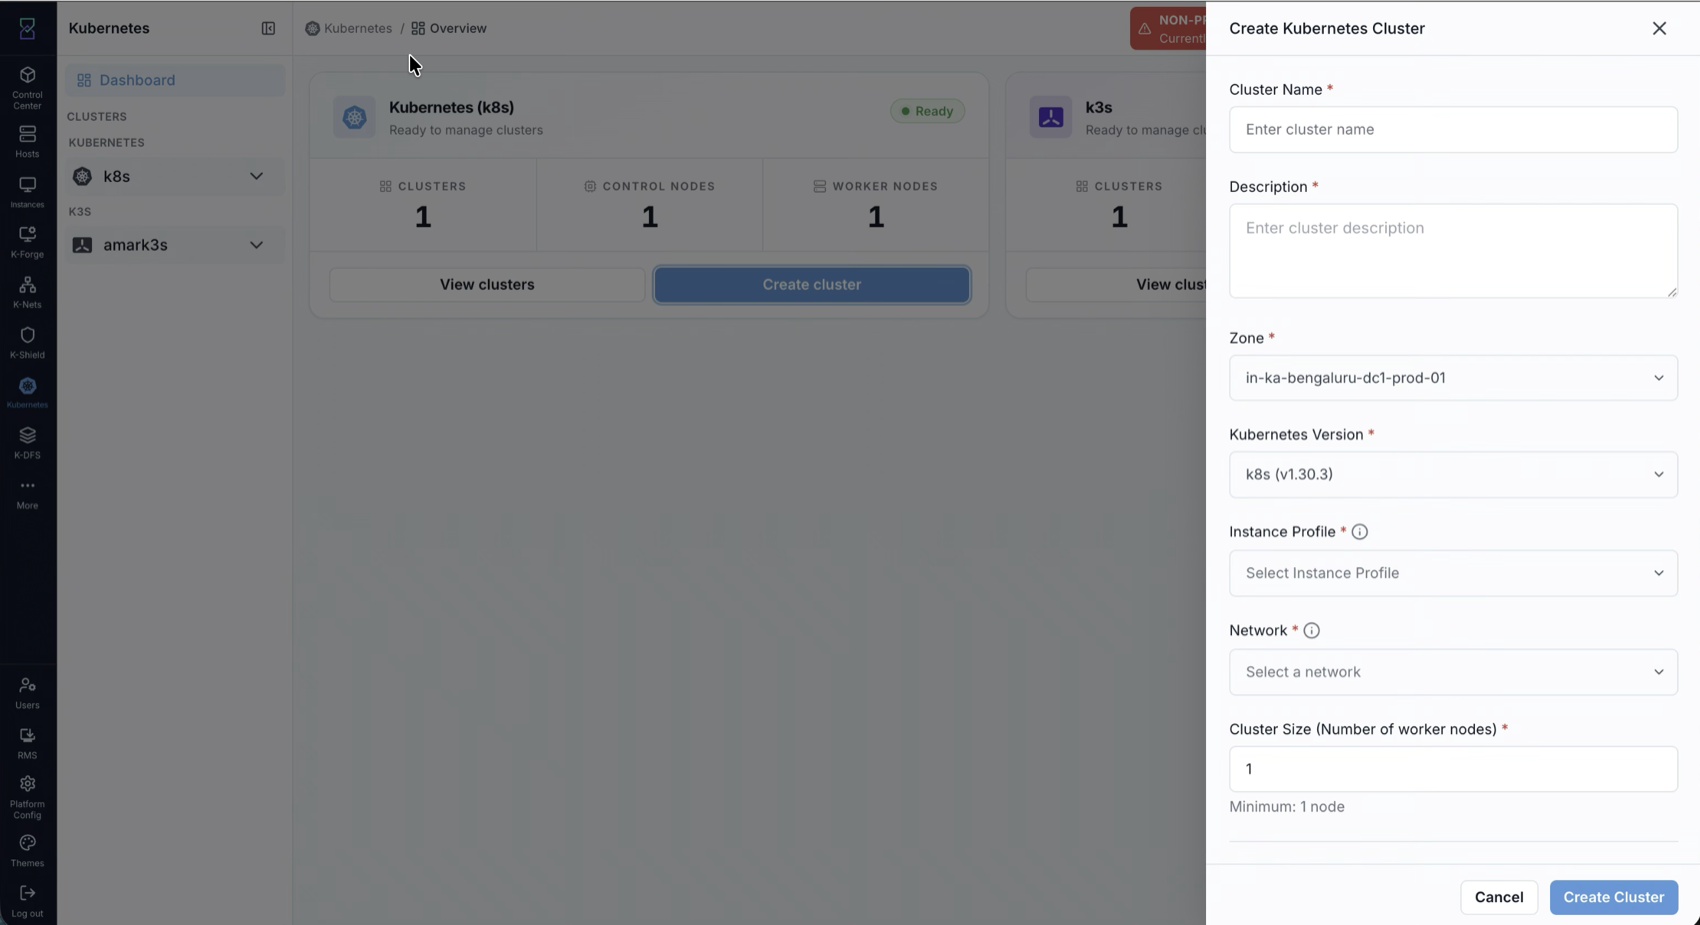
What you’ll see in the screenshot above:
The Create Kubernetes Cluster form is a right-side drawer with the fields above. At the bottom, use Create Cluster or Cancel. (The create action is hidden while Kubernetes versions are being destroyed.)
Advanced settings (high availability)
The create form includes an Advanced Settings section for running a highly available control plane:
Option |
Description |
|---|---|
HA Enabled |
Enable High Availability mode with multiple control-plane nodes. |
Number of Control Nodes |
Control-plane node count for HA; must be an odd number >= 3 (3, 5, 7). Only shown when HA is enabled. |
External Load Balancer IP |
IP that distributes traffic across the control-plane nodes. Must already be allocated in your environment. Required for shared networks when HA is enabled; not needed for isolated networks. |
Number of etcd Nodes |
Dedicated etcd nodes for cluster state; must be an odd number (1, 3, 5). Leave empty to use the default. |
Warning
When enabling HA on a shared network, provide an external load balancer IP that is already allocated and available; an unallocated IP will cause cluster creation to fail. For isolated networks the load balancer IP is not required (the network handles routing internally).
Watching provisioning
After you click Create Cluster, Karios provisions the control-plane and worker VMs
and installs Kubernetes. The cluster moves Creating -> Running on success (other
states: Starting, Stopping, Stopped, and Destroying). Once it is
Running, the cluster appears in the Kubernetes clusters list.
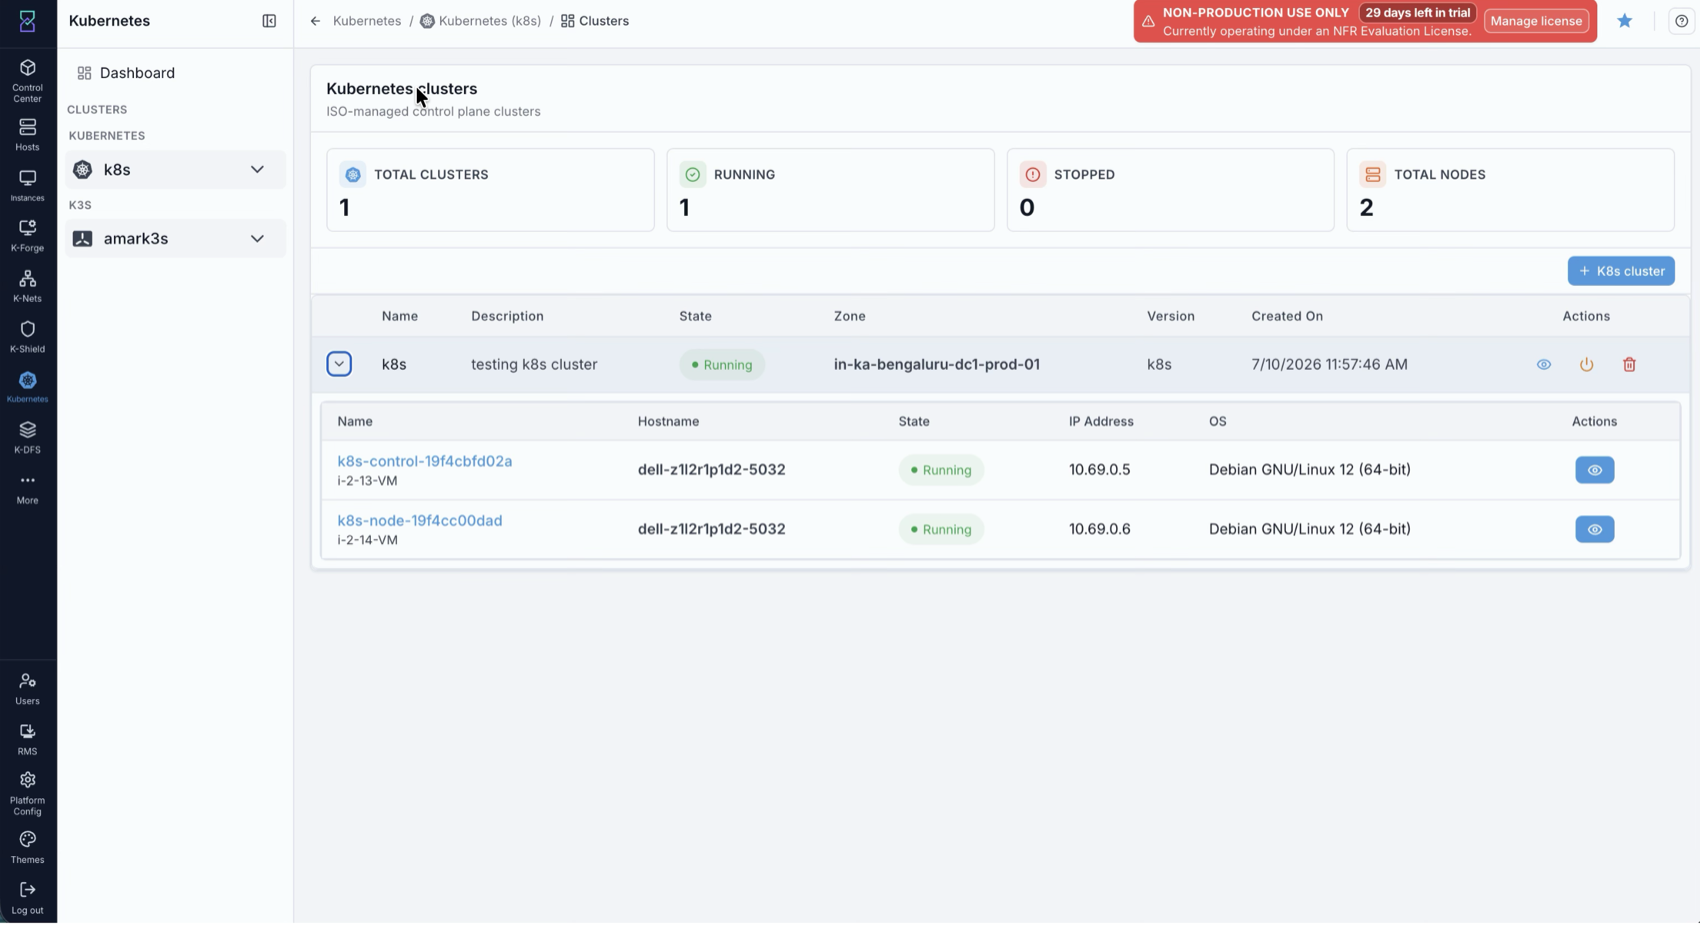
What you’ll see in the screenshot above:
The Kubernetes clusters list. Summary cards show Total Clusters, Running,
Stopped, and Total Nodes. The table lists each cluster with its name,
description, state, zone, version, and created time, row quick actions (view,
stop/start, delete), and a + K8s cluster button. Expanding a row lists the
cluster’s nodes (for example k8s-control-… and k8s-node-…) with hostname,
state, IP, and OS.
Viewing a cluster
Open a cluster (click the row’s eye icon or select it in the sidebar) to see its detail page. It has six tabs, Details, VMs, Access, Services, Pods, and Tests, plus top-right quick actions to stop/start and delete.
Details tab
The Details tab shows four cards:
Cluster Overview - name, description, state, created time, and autoscaling status.
Network Configuration - network name and IP address.
Instance Profiles & Resources - the instance profile, CPU, memory, and VM template.
Ceph Storage - persistent-storage configuration status (with a
Configureaction).
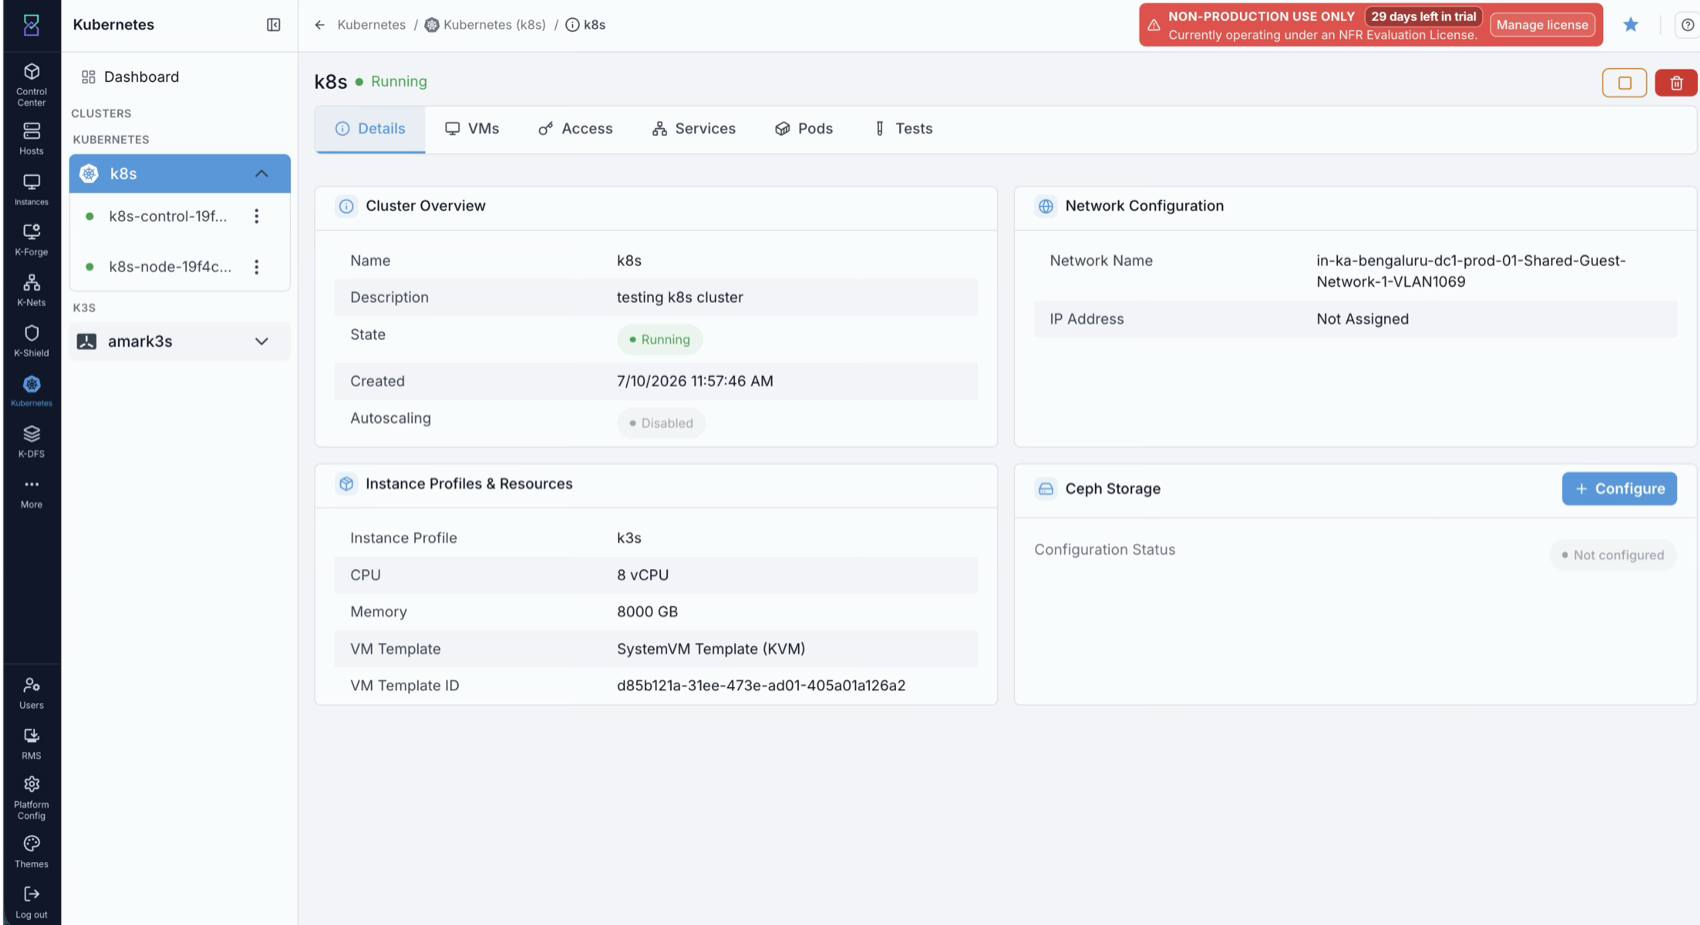
What you’ll see in the screenshot above:
The Details tab with the four cards above and the stop/start and delete actions in the top-right.
VMs tab and scaling
The VMs tab lists the cluster’s node VMs (name, hostname, zone, state, IP, network, OS) and a Scale button that opens the Scale Cluster dialog. Scaling changes the number of worker nodes; the control-plane size is fixed at creation (single node, or the HA count set in Advanced Settings).
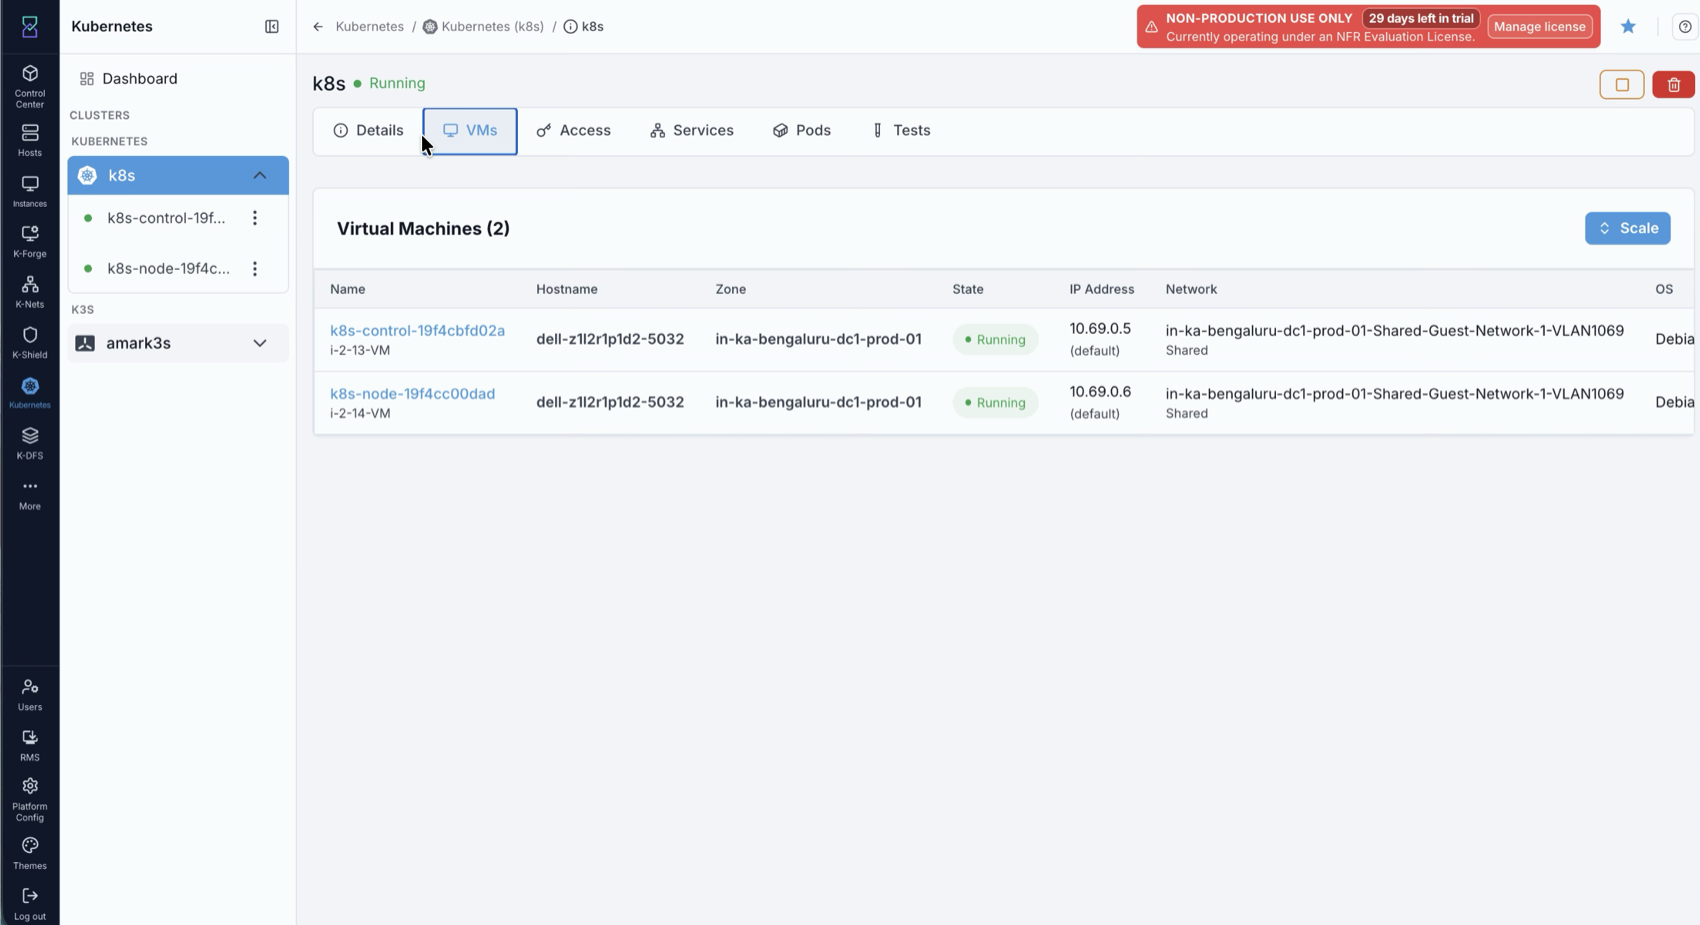
What you’ll see in the screenshot above:
The VMs tab, Virtual Machines for the cluster, with the node list and the
Scale button.
Manual scaling. On the Manual Scale sub-tab, choose Scale Up or Scale Down and a Number of Nodes. The cluster must keep at least 1 worker node (scale-down is blocked below that).
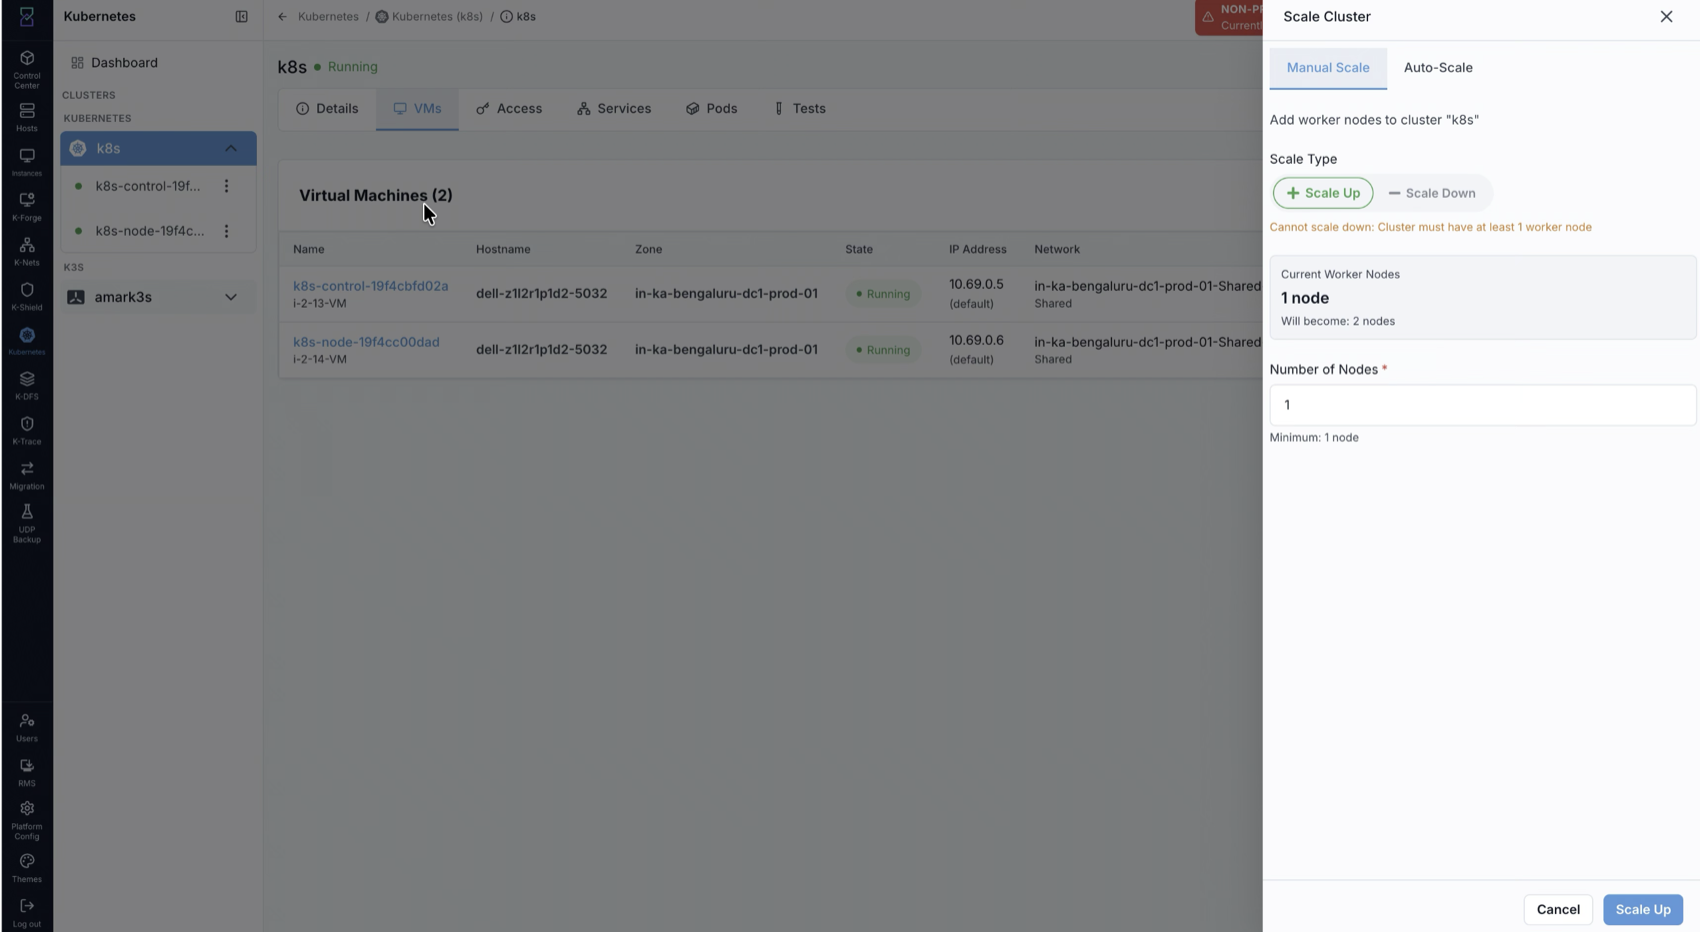
What you’ll see in the screenshot above:
The Scale Cluster dialog on Manual Scale: a Scale Up / Scale Down toggle, the current worker count, the resulting total, and a Number of Nodes input.
Auto-scaling. On the Auto-Scale sub-tab, set Minimum Nodes and Maximum Nodes and choose Enable Autoscaling. The cluster then automatically adjusts worker nodes between the min and max based on workload demand. Autoscaling status is shown on the Details tab.
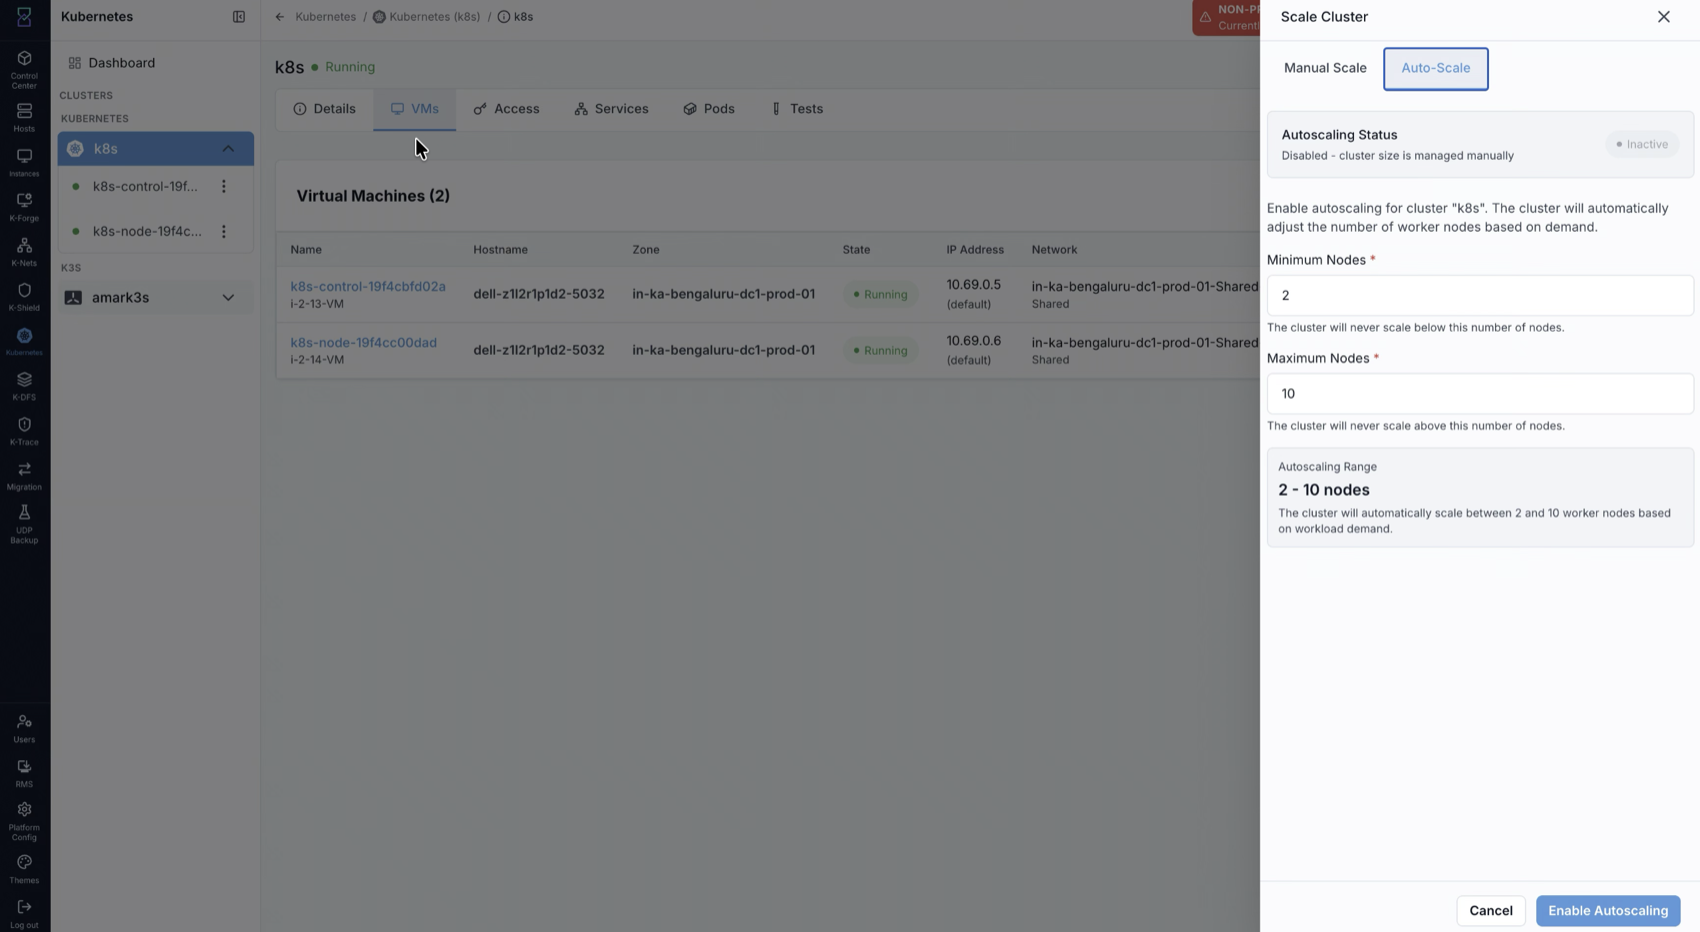
What you’ll see in the screenshot above:
The Auto-Scale sub-tab with Minimum Nodes and Maximum Nodes inputs, the resulting autoscaling range, and the Enable Autoscaling button.
Access tab (kubeconfig)
The Access tab shows the cluster’s kubeconfig inline with Copy and Download
Kubeconfig actions, plus How to use this kubeconfig and expandable Using CLI
and K8S Dashboard UI sections. Wait until the cluster is Running before using
it.
# save the downloaded kubeconfig to ~/.kube/config (or point --kubeconfig at it), then:
kubectl --kubeconfig ~/.kube/config get nodes
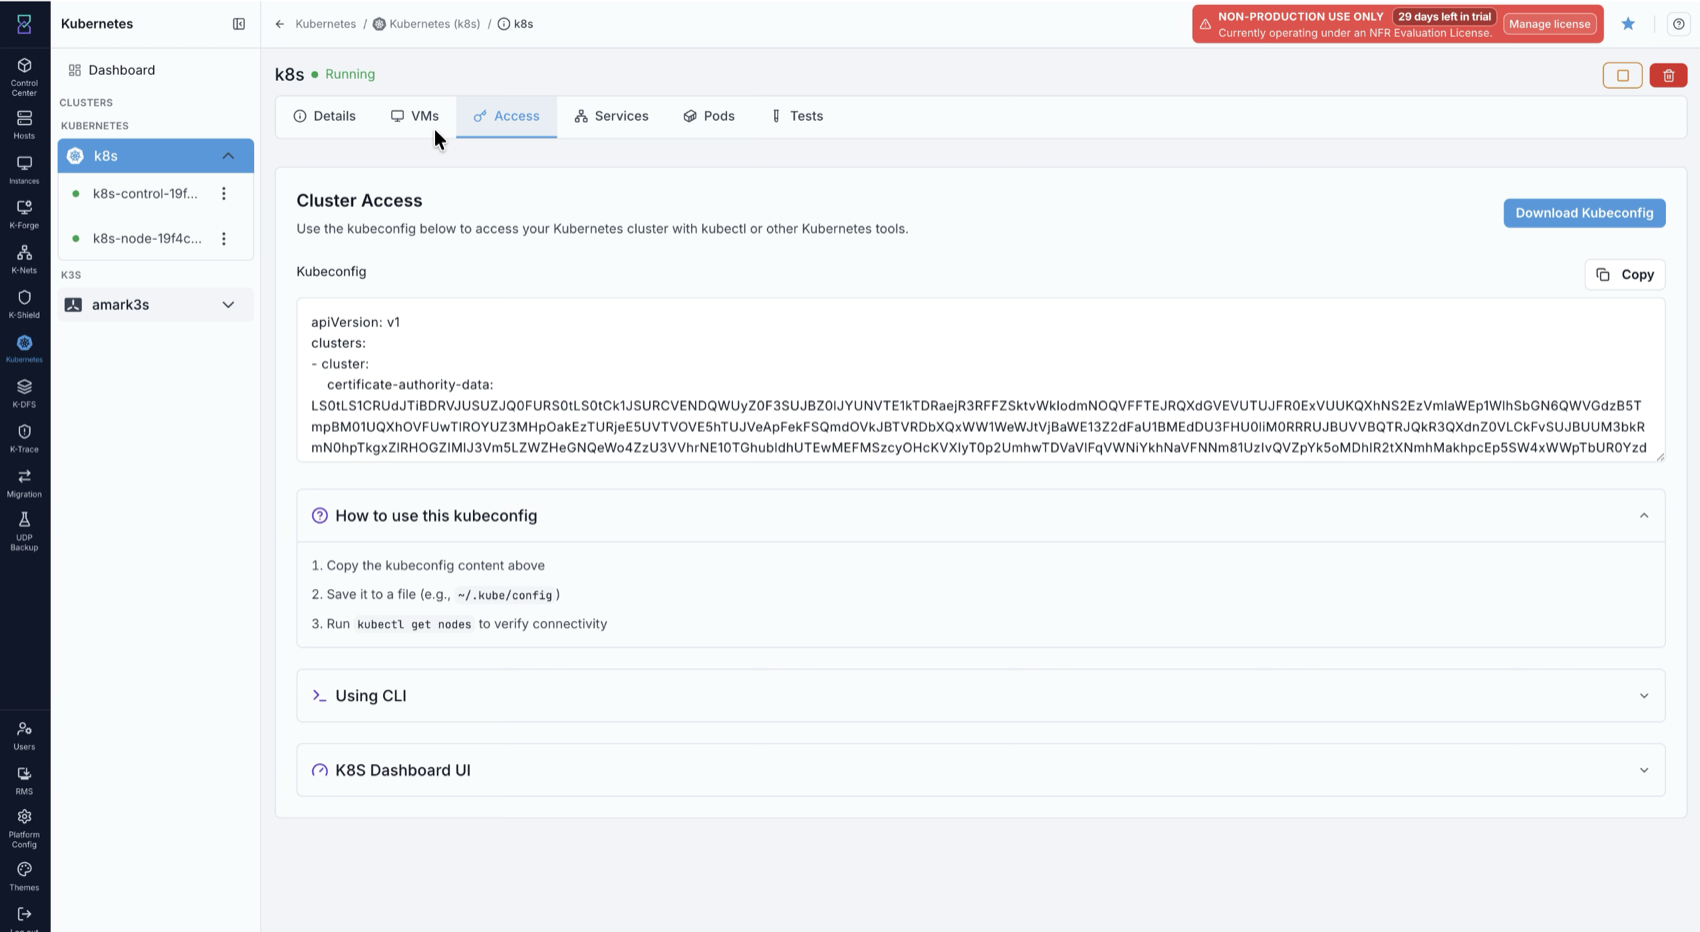
What you’ll see in the screenshot above:
The Access tab, Cluster Access, with the kubeconfig content, Copy /
Download Kubeconfig buttons, the three-step usage guide, and the Using CLI and
K8S Dashboard UI panels.
Note
kubectl must be installed on the machine you connect from.
Services tab
The Services tab lists the Kubernetes Services running on the cluster (name,
namespace, cluster IP, external IPs, ports, created), with a namespace filter and
search. While the cluster is Running the list is live (Synced just now);
when the cluster is Stopped it shows the last-known services.
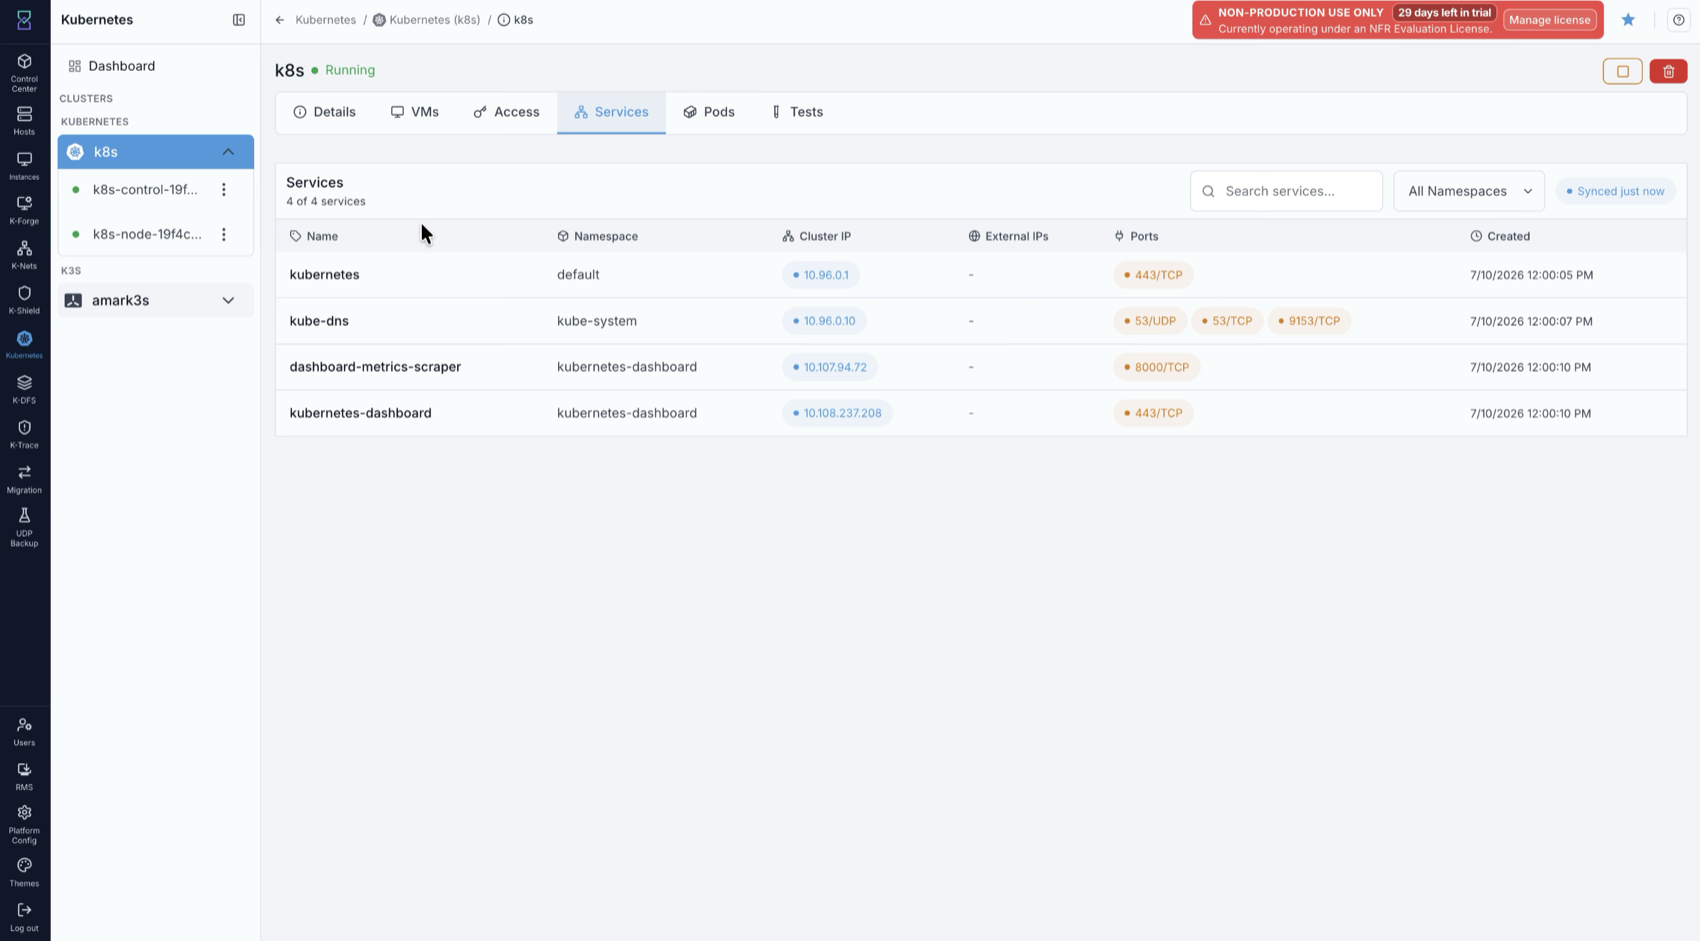
What you’ll see in the screenshot above:
The Services tab with the live service list, namespace filter, and search.
Pods tab
The Pods tab lists the cluster’s Pods (name, namespace, phase, pod IP, node,
ready count, restarts, created), with a namespace filter and search. It is live
while the cluster is Running and shows the last-known pods when Stopped.
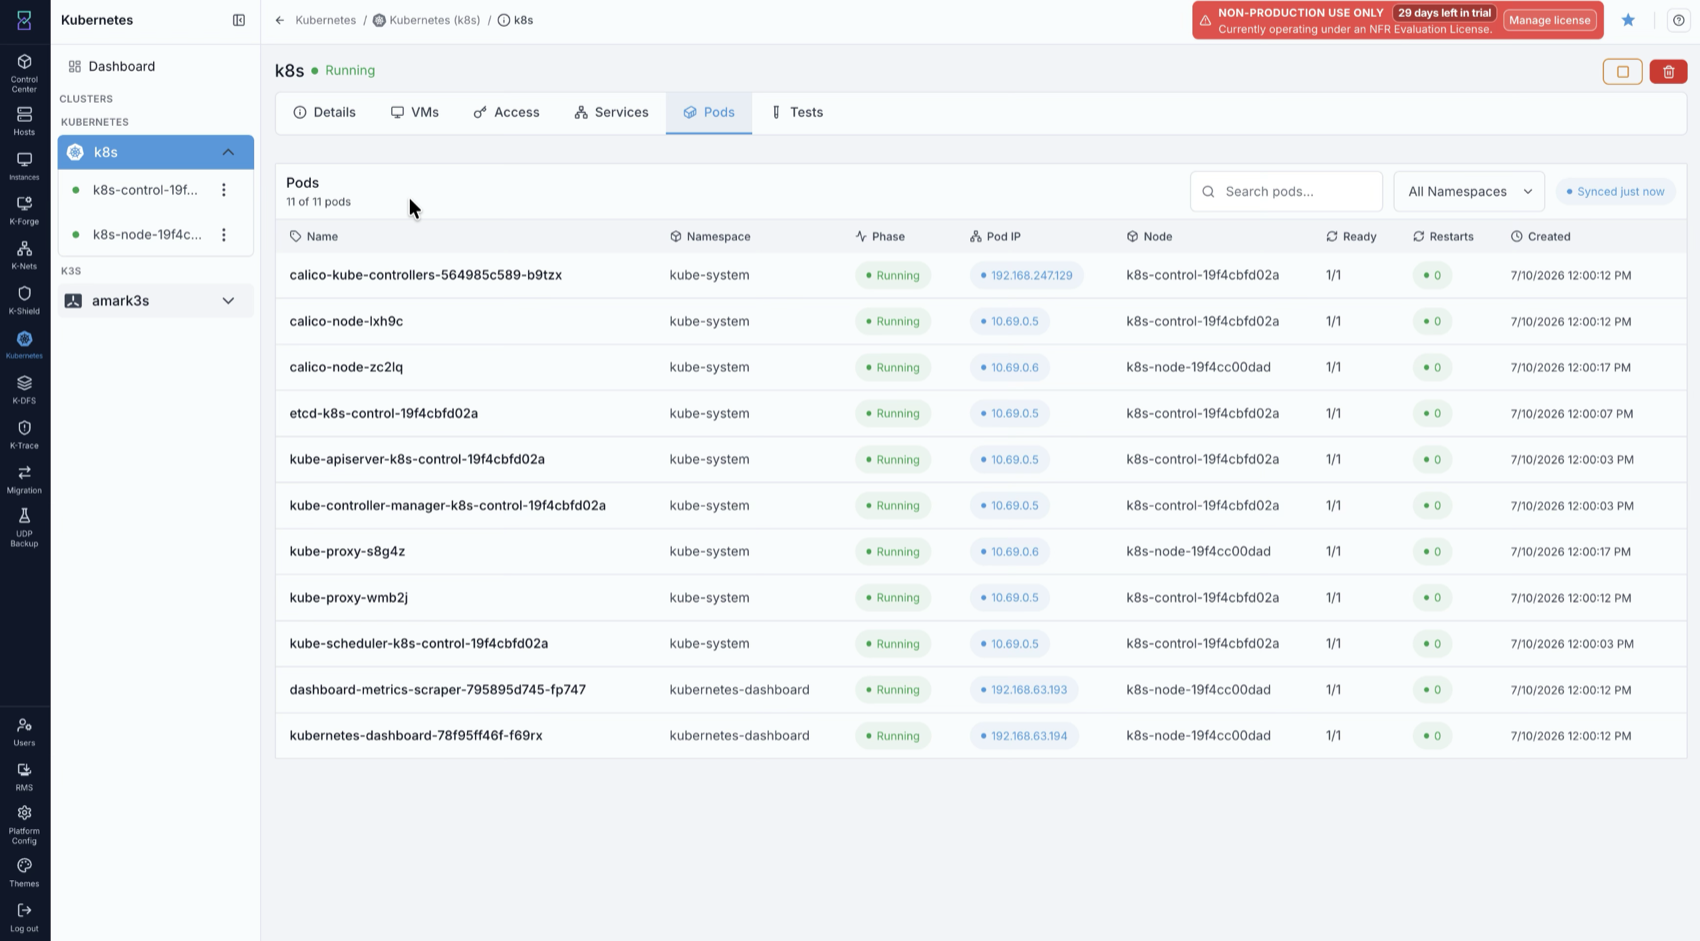
What you’ll see in the screenshot above:
The Pods tab with the live pod list, phase, node placement, ready/restart counts, namespace filter, and search.
Tests tab
The Tests tab runs cluster tests. Choose one or more tests under Select Tests and click Run. Results show the pass rate, status, and a Test Breakdown (passed / failed / skipped / total), a Pass Rate Trend chart, and a Test History table with downloadable reports.
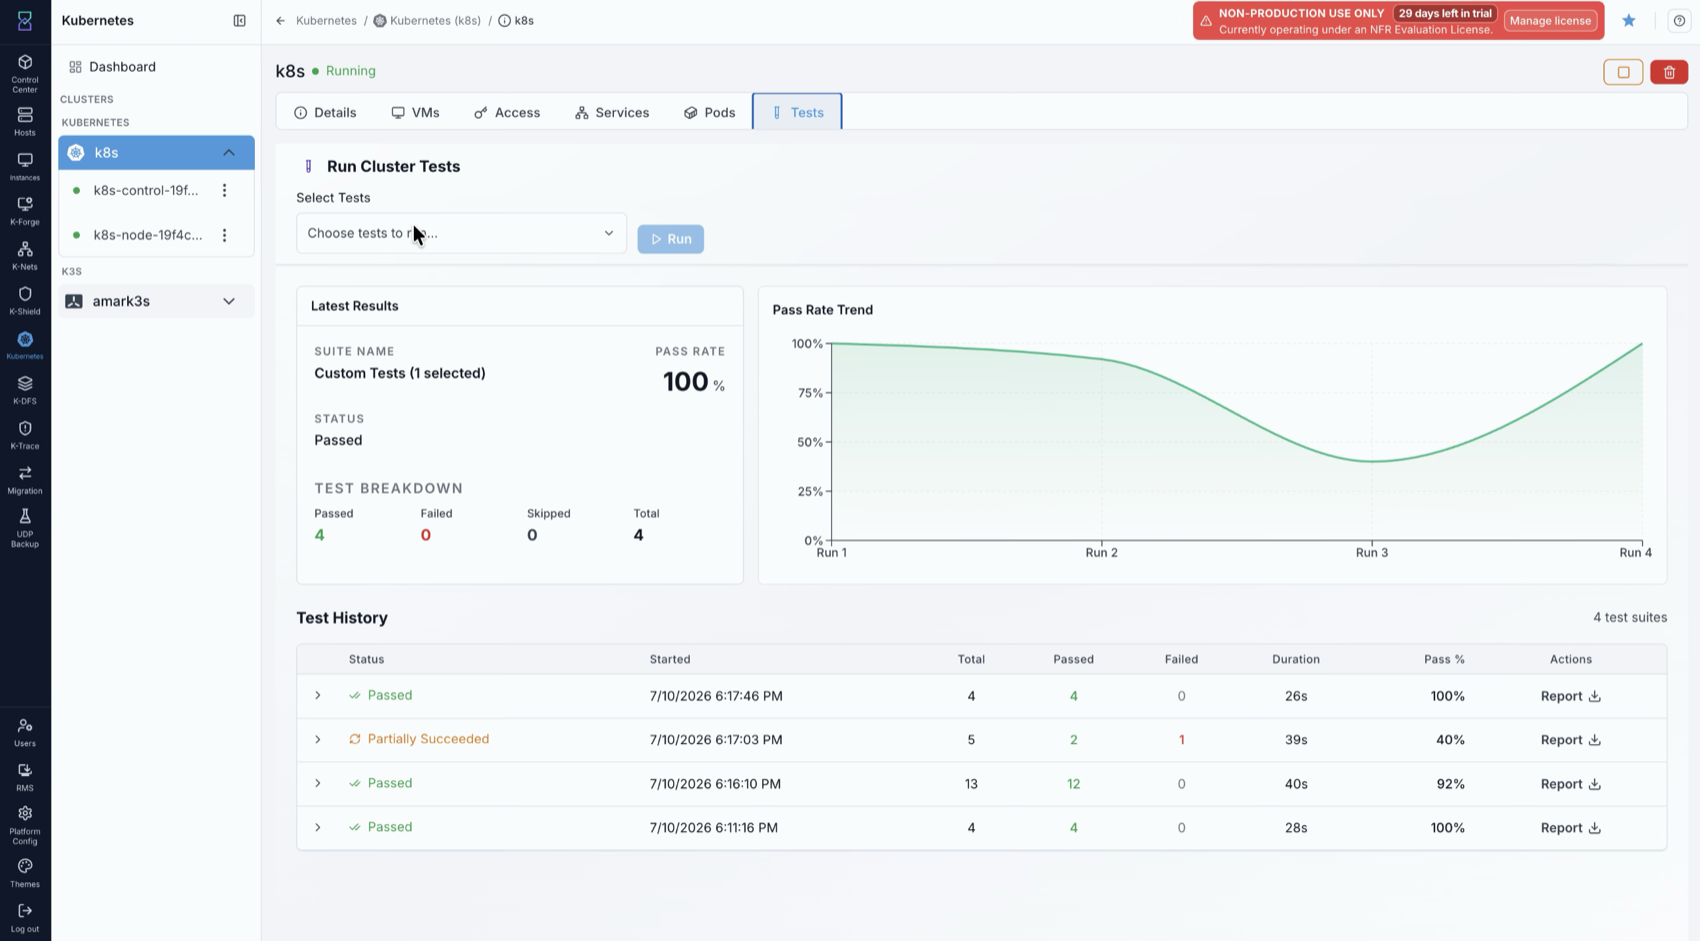
What you’ll see in the screenshot above:
The Tests tab: the test selector and Run button, the latest-run pass rate and breakdown, the pass-rate trend, and the test history with per-run Report downloads.
Starting, stopping, and deleting a cluster
Use the row quick actions or the cluster detail’s top-right actions:
Stop gracefully shuts down the cluster’s node VMs (
Running -> Stopped) and pauses its workloads; Start powers them back on (Stopped -> Running). While stopped, the Services and Pods tabs show the last-known state.Delete destroys the cluster and its node VMs after a confirmation dialog. This cannot be undone. A cluster in a transitioning state (
Starting,Stopping, orDestroying) cannot be deleted.
Warning
Deleting a cluster permanently destroys its nodes and their data. Download any kubeconfig or back up anything you need first.
Node (VM) Management
Each node is a standard Karios instance named <cluster>-control-… or
<cluster>-node-…. The cluster’s VMs tab lists them; to manage a node’s console,
snapshots, volumes, metrics, or firewall / port-forwarding rules, use the standard
Karios areas:
Compute -> Instances - console, start/stop/reboot, metrics, snapshots, and volumes.
Network - port forwarding, firewall (ingress/egress) rules, and ACLs.
Tip
Filter the Instances list by your cluster name to find all of its nodes quickly.
Troubleshooting
Symptom |
What to do |
|---|---|
Create is blocked / k8s card shows |
Initialize Kubernetes for the zone first (k8s card -> Initialize Kubernetes (k8s)). |
No instance profile can be selected |
Create a |
Cluster does not reach |
Open the cluster Details and VMs tabs to find the failed node; retry, or delete and recreate. |
HA cluster creation fails on a shared network |
The external load balancer IP is not allocated. Allocate the IP first, or use an isolated network (no load balancer IP needed). |
Scale-down rejected |
The cluster must keep at least 1 worker node. |
Cluster cannot be deleted |
Clusters in a transitioning state ( |
Services / Pods tabs are empty or stale |
They are live only while the cluster is |
|
Confirm the cluster is |
Quick Reference
Setting |
Value |
|---|---|
Worker nodes |
Minimum 1 (manual), or a min/max range (auto-scaling). |
Control plane |
Single node by default; enable HA in Advanced Settings for an odd number (>= 3) of control nodes. |
Minimum instance profile |
2 cores / 1000 MHz / 2048 MB. |
Kubernetes version |
Selected at create time (for example |
Cluster detail tabs |
Details, VMs, Access, Services, Pods, Tests. |
Scaling |
Manual (Scale Up/Down) or Auto-Scale (min/max worker nodes). |
Access |
kubeconfig from the Access tab (Copy or Download). |
→ Next: k3s on Karios