Performance
Path: Left sidebar > Monitoring > Performance
When to Use:
During performance incidents, workload validation, or before and after maintenance.
When you need to isolate whether a bottleneck is cluster-wide or limited to one service layer.
Purpose:
This page explains how to move from cluster-wide performance signals into the affected OSD, RGW, pool, or CephFS layer.
Steps:
Open
Monitoring > Performance.Start with
Cluster Overviewand set the correct time range.Drill into the tab that matches the symptom.
Compare the charts and counts across the same time window.
Expected Outcome:
You can identify the affected performance layer and the next page to use for remediation.
What You See:
A time-range selector, multiple performance tabs, summary cards, and service-specific charts.
What This Screenshot Shows:
The screenshots on this page show the main performance tabs used to compare cluster, OSD, gateway, pool, and CephFS behavior.
Actions in This Screen:
Change the timeline window.
Switch between performance tabs.
Compare chart behavior across layers.
If this fails:
Check whether the monitoring stack is current and returning fresh data.
Compare the same time window across multiple tabs before assuming root cause.
Use Alerts, Logs, or the related infrastructure page if charts stay empty or stale.
Performance Overview
The Performance page provides tabbed metric views for each layer of the cluster. Use the time range selector in the top-right corner to change the analysis window across all charts.
The Performance page offers tabbed metric views for each layer of the cluster. Use the tabs to drill into a specific service or pool rather than the cluster-wide aggregates only.
Purpose:
To locate bottlenecks across cluster, OSD, gateway, pool, and CephFS layers.
To validate health and performance before and after operational changes.
When to Use:
During performance incidents or user-reported slowness.
During pre/post maintenance validation.
During capacity and workload planning reviews.
Steps:
Start with
Cluster Overviewfor global health signals.Drill into
OSD,RGW,Pool Stats, orMDS / CephFSbased on symptom.Use time-range controls to isolate the incident window.
Expected Outcome:
You identify the affected performance layer and the likely next remediation path.
Time Range Selector (Top-Right)
The top-right action control (shown as Last 1 hour by default) lets the
user switch timeline windows for all performance graphs.
Purpose:
To compare short spikes versus long-term trends.
To isolate the exact window where an incident occurred.
When to Use:
During any performance investigation.
Before and after maintenance changes to compare impact.
Steps:
Click the top-right
Last 1 hourselector.Choose the required timeline window.
Review graph changes across current tab.
Switch tabs as needed; keep same timeline for cross-layer comparison.
Expected Outcome:
You view metrics in the exact time window needed for accurate diagnosis.
Performance Tabs
Tab |
What It Covers |
|---|---|
Cluster Overview |
High-level cluster health summary, IOPS, throughput, and latency |
OSD Performance |
OSD capacity, status, and recovery metrics |
RGW Performance |
Gateway request rates, bandwidth, and failed requests |
Pool Stats |
Per-pool bytes used, objects, IOPS, and throughput |
MDS / CephFS |
Metadata server request rate for CephFS workloads |
Cluster Overview Tab
Path: Monitoring > Performance > Cluster Overview
High-level read/write IOPS, throughput, and latency for the entire cluster. Use this as the baseline tab before drilling into other performance tabs.
Purpose:
To validate real-time cluster health and top-level performance behavior.
When to Use:
As the first step for any performance investigation.
Before and after maintenance or scale changes.
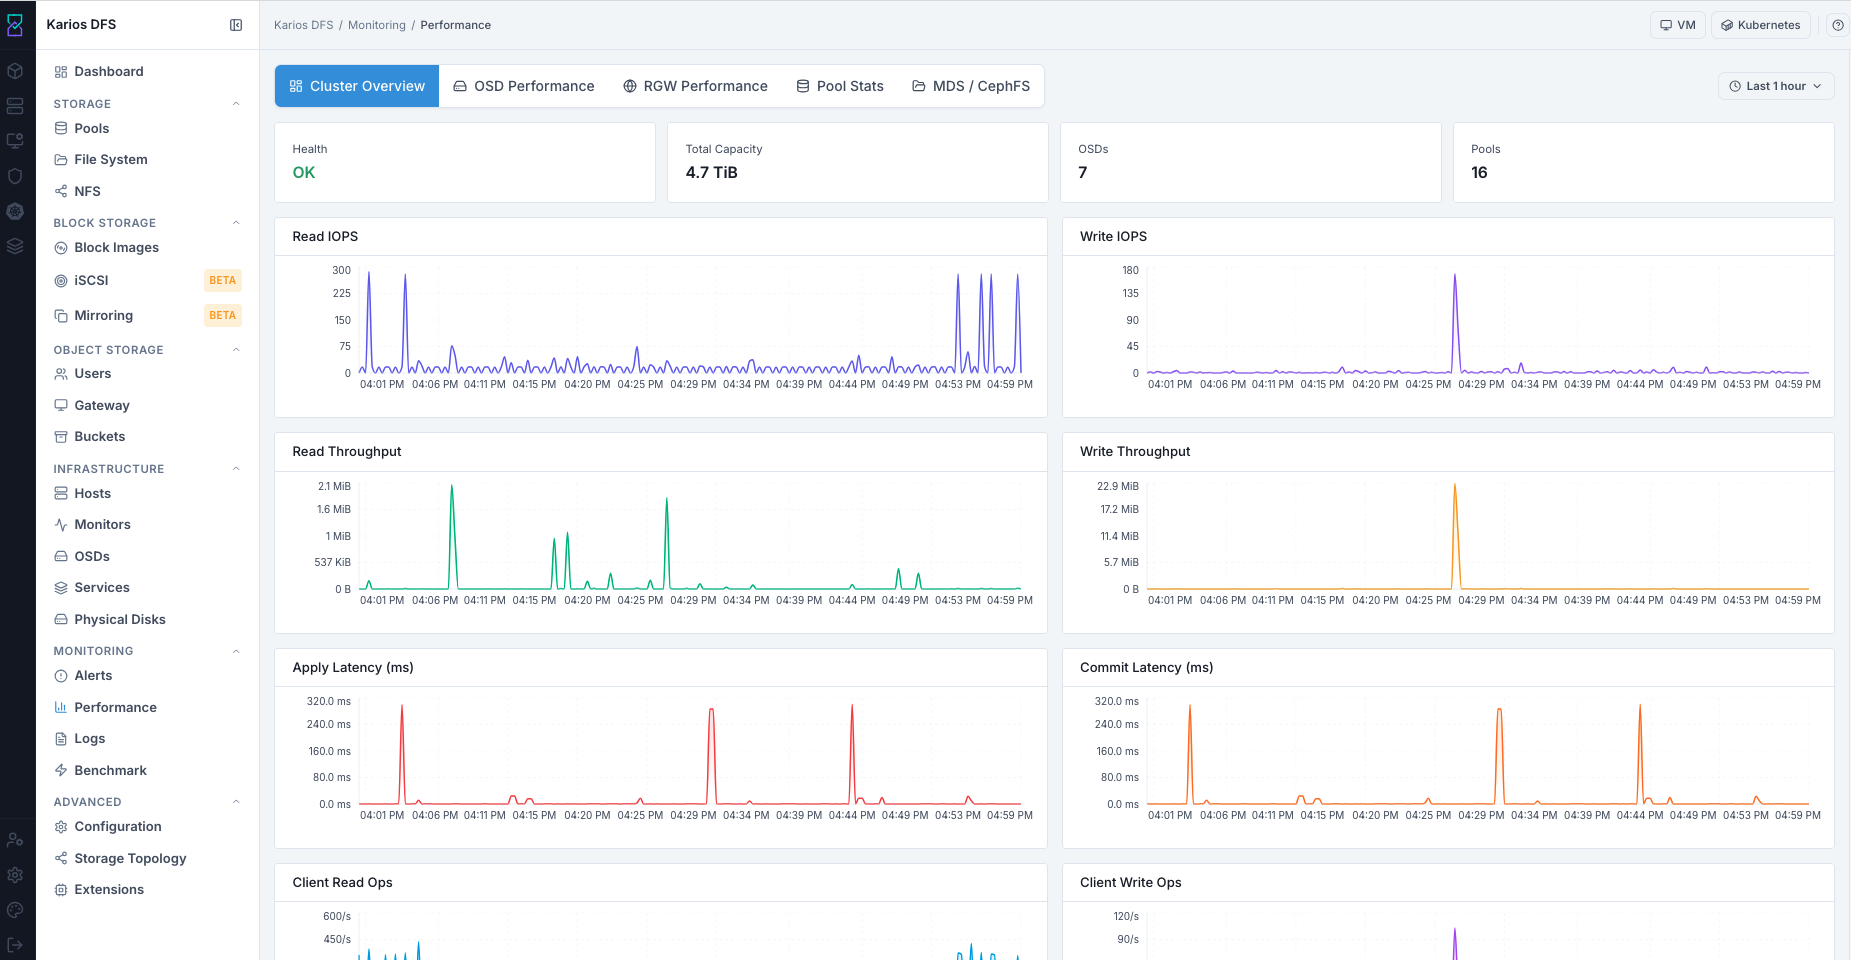
What This Screenshot Shows: Performance - Cluster Overview Tab (UI Reference; Values Depend On Your Environment).
Top-Right Last 1 hour Selector: Use this to change the timeline window for
these graphs so you can isolate incident periods and compare baseline behavior.
Summary Cards - Top Row
Card |
What It Shows |
Example Value |
|---|---|---|
Health |
Current cluster health state |
|
Total Capacity |
Total raw capacity across all OSDs |
|
OSDs |
Total OSD daemon count |
|
Pools |
Total configured pool count |
|
Performance Graphs
Graph |
Color |
What It Shows |
|---|---|---|
Read IOPS |
Blue/Purple |
Total read operations per second cluster-wide |
Write IOPS |
Blue/Purple |
Total write operations per second cluster-wide |
Read Throughput |
Green |
Total cluster read bandwidth |
Write Throughput |
Orange/Yellow |
Total cluster write bandwidth |
Apply Latency (ms) |
Red |
Time to commit write intent; sustained spikes suggest pressure |
Commit Latency (ms) |
Orange |
Time to flush writes to disk; sustained elevation suggests disk slowness |
Steps:
Open
Cluster Overview.Confirm Health state.
Validate OSD/capacity/pool counts.
Review IOPS/Throughput trend baseline.
Check Apply and Commit latency for sustained elevation.
Adjust time range to isolate incident windows.
Expected Outcome:
You establish cluster-wide performance baseline and detect broad anomalies.
Tip
If latency spikes occur without corresponding OSD anomalies, investigate monitor or network health in Infrastructure.
OSD Performance Tab
Path: Monitoring > Performance > OSD Performance
Per-OSD latency, IOPS, and throughput charts. Use this tab to identify a single slow or overloaded disk.
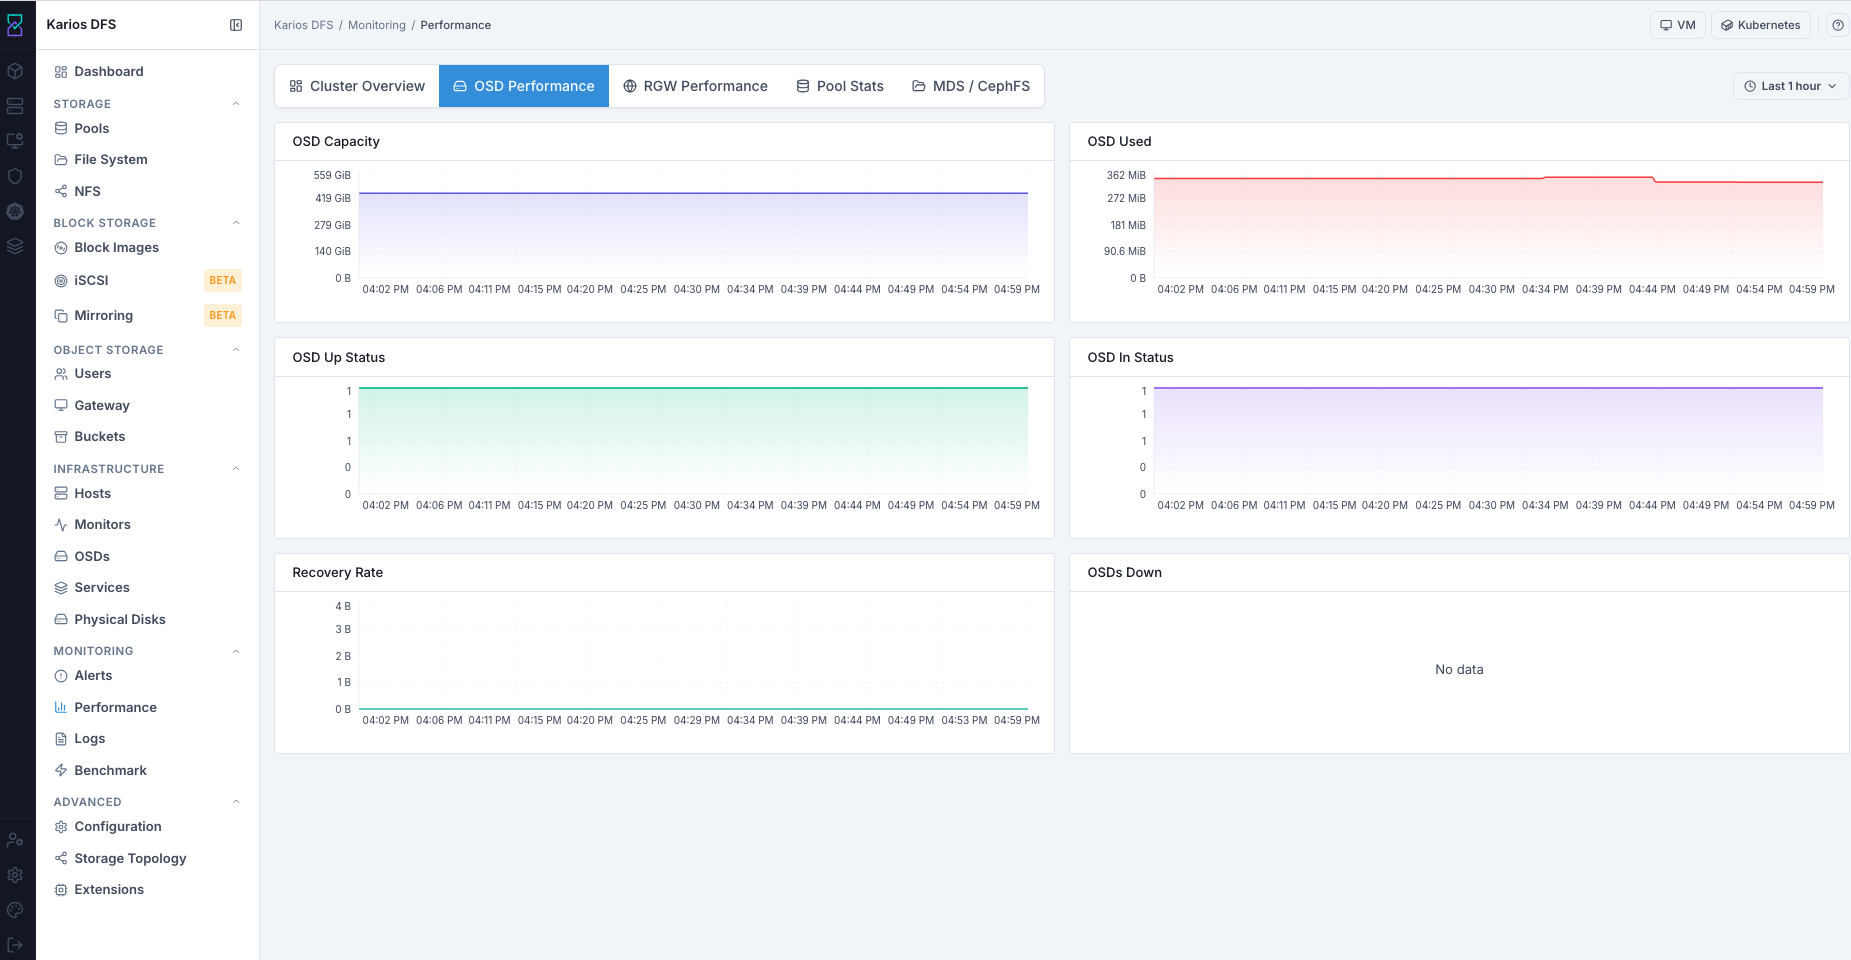
What This Screenshot Shows: Performance - OSD Performance Tab (UI Reference; Values Depend On Your Environment).
Top-Right Last 1 hour Selector: Use this to change the OSD graph timeline
so you can match dips/spikes with specific outage or recovery windows.
OSD Performance Graphs
Graph |
Color |
What It Shows |
|---|---|---|
OSD Capacity |
Blue |
Total raw OSD capacity trend |
OSD Used |
Red/Pink |
Raw capacity currently consumed |
OSD Up Status |
Green |
Count of OSDs in |
OSD In Status |
Purple |
Count of OSDs in |
Recovery Rate |
Blue/Green |
Data recovery throughput after OSD events |
OSDs Down |
List of currently down OSDs; no data means all up |
OSD Panel Reference
Panel |
Description |
|---|---|
Apply Latency |
Time for an OSD to commit a write to the journal |
Commit Latency |
Time for an OSD to flush to disk |
Read / Write IOPS |
Per-OSD operation rate |
Steps:
Confirm
OSD Up Statusstays at expected count.Confirm
OSD In Statusstays at expected count.Review
Recovery Ratefor active recovery periods.Check
OSDs Downlist for named failures.Correlate dips with Alerts and Infrastructure > OSDs.
Expected Outcome:
You identify OSD availability events and recovery progress.
Tip
Up and In dropping together means daemon outage. In
dropping while Up stays stable indicates manual mark-out.
Tip
High apply latency on a single OSD indicates a failing or slow disk. Cross-reference with SMART data on the Hosts page.
RGW Performance Tab
Path: Monitoring > Performance > RGW Performance
Use this tab when troubleshooting S3/Swift behavior.
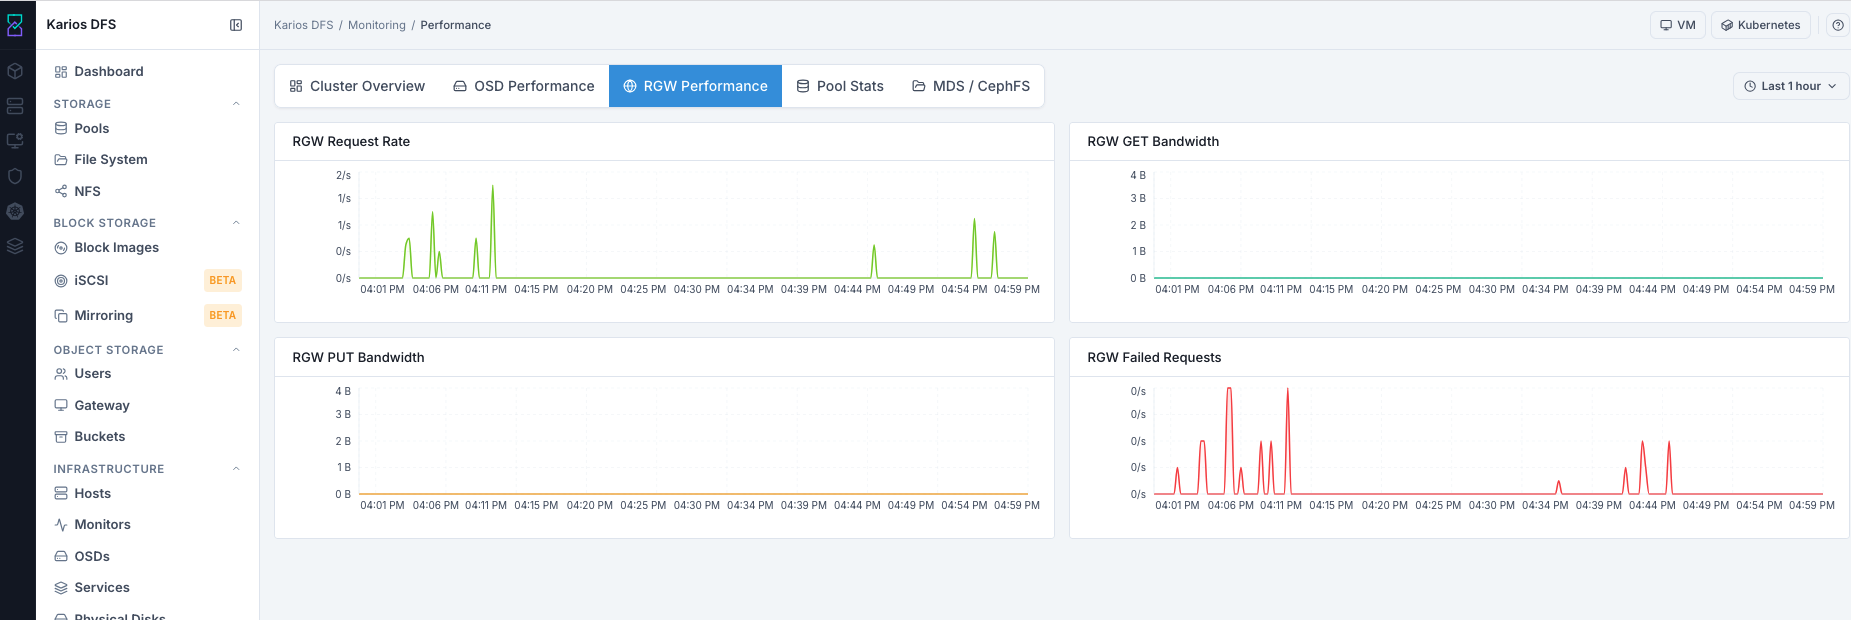
What This Screenshot Shows: Performance - RGW Performance Tab (UI Reference; Values Depend On Your Environment).
Top-Right Last 1 hour Selector: Use this to adjust the RGW timeline and
pinpoint exactly when request failures or latency spikes began.
RGW Performance Graphs
Graph |
Color |
What It Shows |
|---|---|---|
RGW Request Rate |
Green |
Total API requests per second across gateways |
RGW GET Bandwidth |
Teal/Blue |
Download bandwidth |
RGW PUT Bandwidth |
Yellow/Orange |
Upload bandwidth |
RGW Failed Requests |
Red |
Failed request rate; sustained non-zero indicates client errors |
RGW Panel Reference
Panel |
Description |
|---|---|
GET / PUT Requests |
Object read and write rates per gateway |
Request Latency |
Average and 95th-percentile latency |
Error Rate |
4xx and 5xx HTTP errors per second |
Steps:
Check request rate for inbound traffic presence.
Check GET/PUT bandwidth for data movement.
Check failed requests for sustained error periods.
Correlate errors with Monitoring > Logs and RGW service state.
Expected Outcome:
You validate object API traffic health and identify failure spikes.
Tip
Non-zero request rate with near-zero bandwidth often indicates auth/policy failures rather than transport failure.
Pool Stats Tab
Path: Monitoring > Performance > Pool Stats
Shows pool-level storage and I/O distribution.
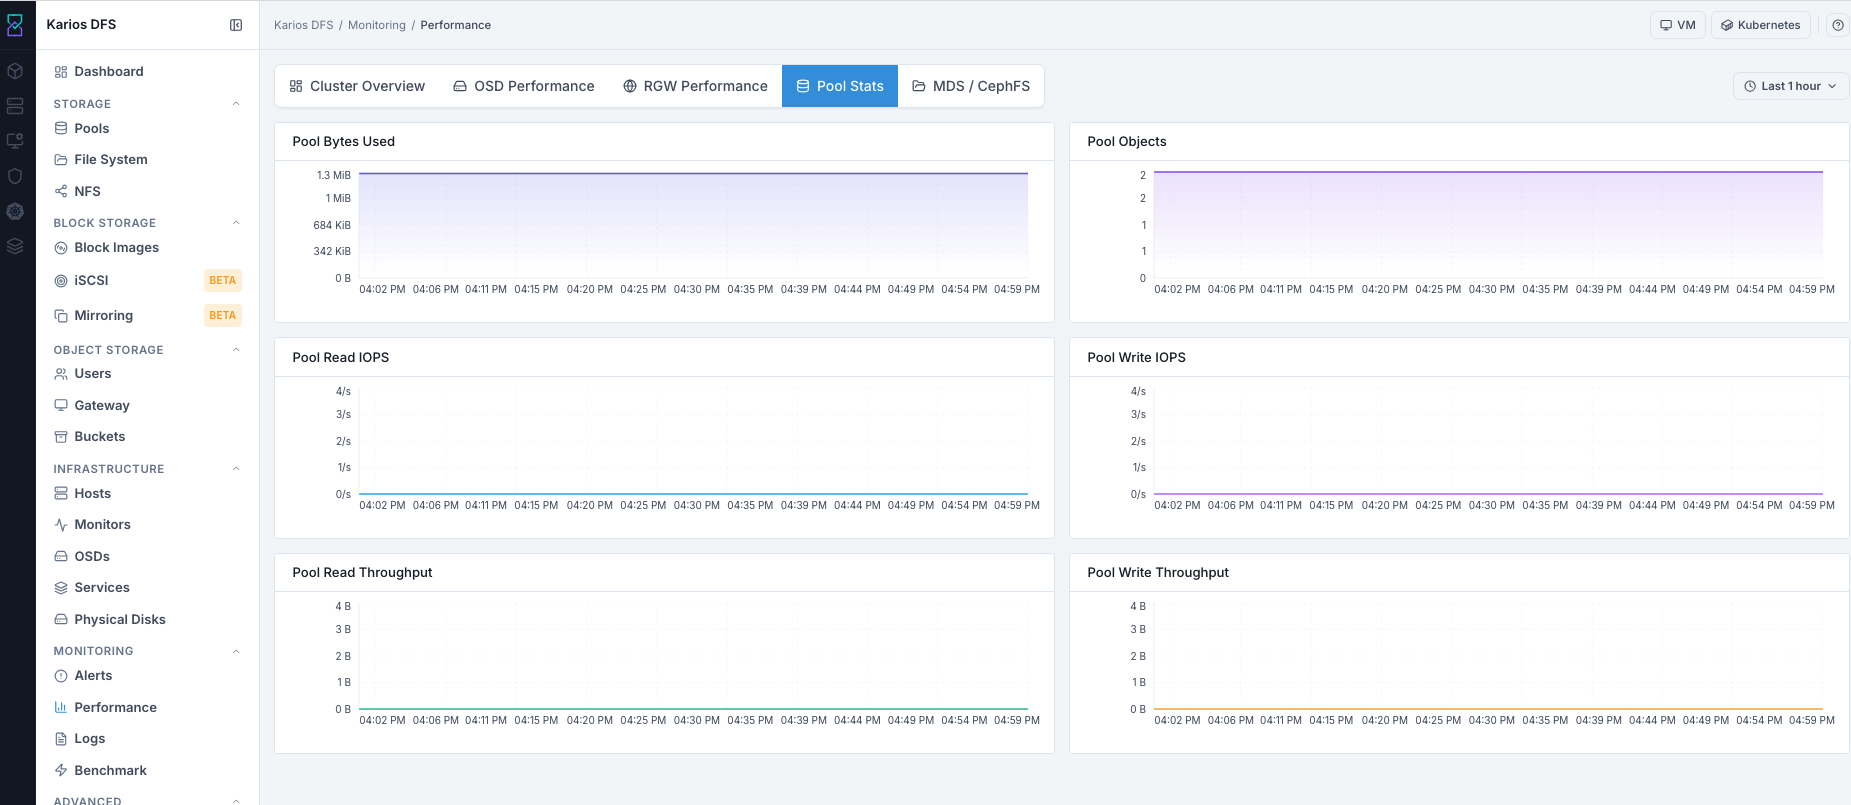
What This Screenshot Shows: Performance - Pool Stats Tab (UI Reference; Values Depend On Your Environment).
Top-Right Last 1 hour Selector: Use this to adjust pool timelines and
identify which pool dominated IOPS/throughput during a target time range.
Pool Stats Graphs
Graph |
What It Shows |
|---|---|
Pool Bytes Used |
Total bytes consumed across pools |
Pool Objects |
Total object count across pools |
Pool Read IOPS |
Read operations per second by pool |
Pool Write IOPS |
Write operations per second by pool |
Pool Read Throughput |
Read bandwidth by pool |
Pool Write Throughput |
Write bandwidth by pool |
Pool Stats Panel Reference
Panel |
Description |
|---|---|
Read / Write IOPS |
Per-pool operation rate |
Read / Write Throughput |
Per-pool data rate (bytes/sec) |
Steps:
Review bytes and objects growth trend.
Identify dominant pools in read/write IOPS charts.
Identify dominant pools in throughput charts.
Decide whether noisy workloads require isolation strategy.
Expected Outcome:
You identify pool-level workload concentration and capacity trends.
MDS / CephFS Tab
Path: Monitoring > Performance > MDS / CephFS
Shows metadata service activity for CephFS.
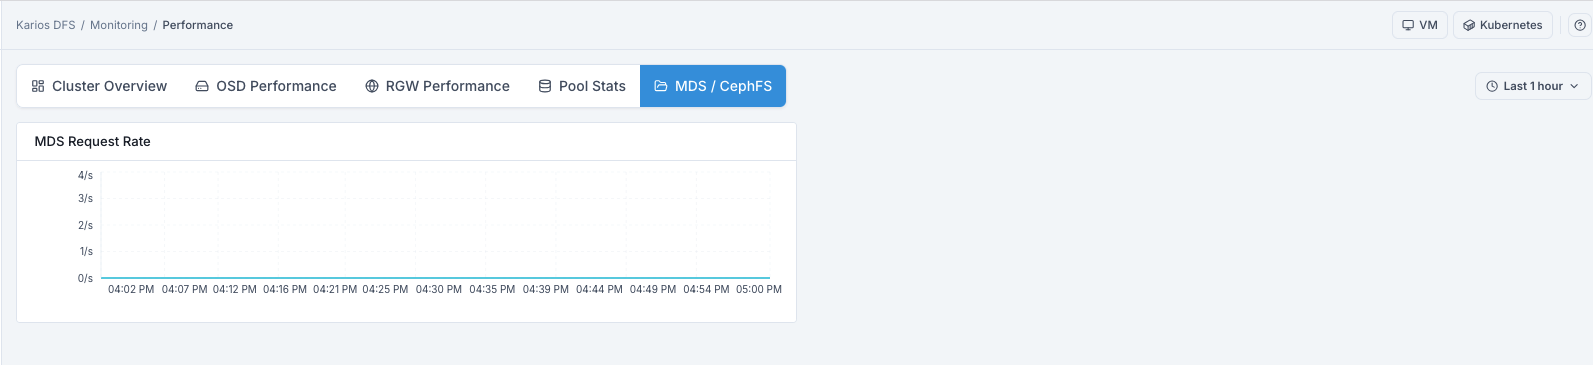
What This Screenshot Shows: Performance - MDS / CephFS Tab (UI Reference; Values Depend On Your Environment).
Top-Right Last 1 hour Selector: Use this to change the CephFS metadata
timeline so you can correlate client activity with MDS load changes.
MDS / CephFS Graph
Graph |
Color |
What It Shows |
|---|---|---|
MDS Request Rate |
Teal/Green |
Metadata operations per second (open, readdir, create, delete, and related ops) |
MDS / CephFS Panel Reference
Panel |
Description |
|---|---|
Metadata Ops/sec |
Rate of directory lookups, creates, and deletes |
MDS Cache |
Metadata cache hit ratio; low hit rate can increase latency |
Client Sessions |
Active CephFS client count |
Steps:
Review request rate for active CephFS metadata load.
Treat flat
0/sas normal when no clients are active.Correlate sustained high rates with File System active/standby MDS state.
Expected Outcome:
You validate CephFS metadata load and detect potential MDS pressure.
Performance - Interpreting Results
Use these quick patterns during diagnosis:
Cluster latency spike without OSD-level spike -> network or monitor issue.
Single OSD high latency -> suspect disk failure; check SMART data.
RGW error rate increase -> check gateway logs for 5xx causes.
Pool IOPS concentrated on one pool -> consider workload move or dedicated CRUSH rule.
Observation |
Likely Meaning |
What To Do |
|---|---|---|
Cluster latency spike without OSD-specific spike |
Network or monitor issue |
Check Infrastructure > Monitors quorum and host network. |
Single OSD high latency in OSD detail views |
Possible disk degradation |
Check SMART in Infrastructure > Hosts > Device Health. |
RGW Failed Requests increasing |
Auth/permission/backend issue |
Check Logs and RGW service health. |
Pool IOPS concentrated in one pool |
One workload dominates cluster I/O |
Evaluate dedicated OSD/CRUSH isolation strategy. |
Recovery Rate stays non-zero for long periods |
OSD recovery still in progress |
Minimize extra load until recovery returns to zero. |
Tooltips - Performance
Tip
Top-right Last 1 hour selector changes graph timelines on every tab.
Keep the same window while switching tabs to compare signals accurately.
Tip
Short spikes can be normal. Focus on sustained trends before concluding a component is degraded.
Tip
Use Cluster Overview first, then drill down to OSD/RGW/Pool/MDS tabs to
avoid misdiagnosis from isolated charts.
Warnings - Performance
Warning
Performance graphs are observational. They do not apply fixes. Always verify root cause in Infrastructure/Alerts before making placement or capacity changes.
Warning
Interpreting data from mismatched time ranges can produce false conclusions. Set the same time window before cross-tab comparisons.
Warning
Recovery/backfill periods can temporarily degrade latency and throughput. Avoid aggressive tuning changes until recovery activity returns to baseline.
Troubleshooting - Performance
Problem You See |
Most Likely Cause |
What To Do |
|---|---|---|
Graphs show no recent movement |
Low workload or incorrect time window |
Expand timeline using top-right selector and verify active client load. |
Cluster latency high but OSD charts look normal |
Network or monitor-path issue |
Check Infrastructure > Monitors and host network connectivity. |
OSD tab shows drops in Up/In counts |
OSD outage or mark-out event |
Correlate with Alerts and Infrastructure > OSDs state/events. |
RGW request errors rising |
Gateway auth/policy/backend issue |
Check Monitoring > Logs and Object Storage > Gateway status. |
One pool dominates IOPS/throughput |
Workload concentration |
Rebalance workload placement or evaluate dedicated CRUSH strategy. |
MDS request rate remains high for long periods |
Metadata-heavy client behavior |
Check File System MDS state and plan metadata-path optimization. |
Note
If issues persist, escalate through Monitoring > Alerts and include the
exact time window and affected tab screenshots for faster triage.