Logs
Path: Left sidebar > Monitoring > Logs
Log Overview
The Logs page streams recent log entries from the Ceph cluster. Use it to diagnose errors, audit configuration changes, and track operational events.
Use this page to diagnose failures, track change activity, and build a timestamped incident timeline.
Tabs
Tab |
Description |
|---|---|
Cluster Logs |
General daemon logs from monitors, OSDs, and managers, filtered to |
Audit Logs |
Records of user actions and configuration changes, filtered to the |
Purpose:
To identify failure messages and health transitions.
To trace administrative actions and change history.
To build evidence for escalation and compliance.
When to Use:
During incidents and post-incident analysis.
After unexpected behavior or configuration drift.
During compliance and audit evidence collection.
Steps:
Start with
Cluster Logsfor operational context.Use
Audit Logsto correlate actions with timestamps.Filter and download only the relevant window.
Expected Outcome:
You get a timestamped operational and change timeline for diagnosis.
If this fails:
Confirm the relevant daemon or audit event has had time to reach the log stream.
Broaden the time window, search term, or priority filter before assuming the event is missing.
Check related Alerts or host-level journals if the expected entry still does not appear.
Actions in This Screen
These controls apply to both tabs.
Use the filter bar to narrow log output:
Control |
Location |
What It Does |
|---|---|---|
Log Level (shown as |
Top-left dropdown |
Show only entries at a selected severity (all, debug, info, warning, error, critical) |
Search logs… |
Top-left search field |
Free-text search across message content and daemon name |
Download |
Top-right button |
Export currently visible filtered entries as a |
Steps:
Set
All Prioritiesbased on urgency.Use
Search logs...with scoped keywords.Click
Downloadto export filtered evidence.
TOOLTIP - Filter Strategy:
Use
ERRandWRNfirst to isolate impact quickly during incidents.Use
Search logs...with daemon identifiers (for exampleosd.3) to narrow blast radius.
Cluster Logs Tab
Path: Monitoring > Logs > Cluster Logs (default tab)
Shows general daemon logs from monitors, OSDs, and managers, filtered to the
cluster and cephadm channels.
Purpose:
To identify operational failures and health transitions.
When to Use:
During active incidents and post-incident timeline reconstruction.
Warning
Cluster Logs reflect the Ceph monitor log buffer and not the full host-level daemon journals. If an expected entry is missing, validate on the host with system journals.
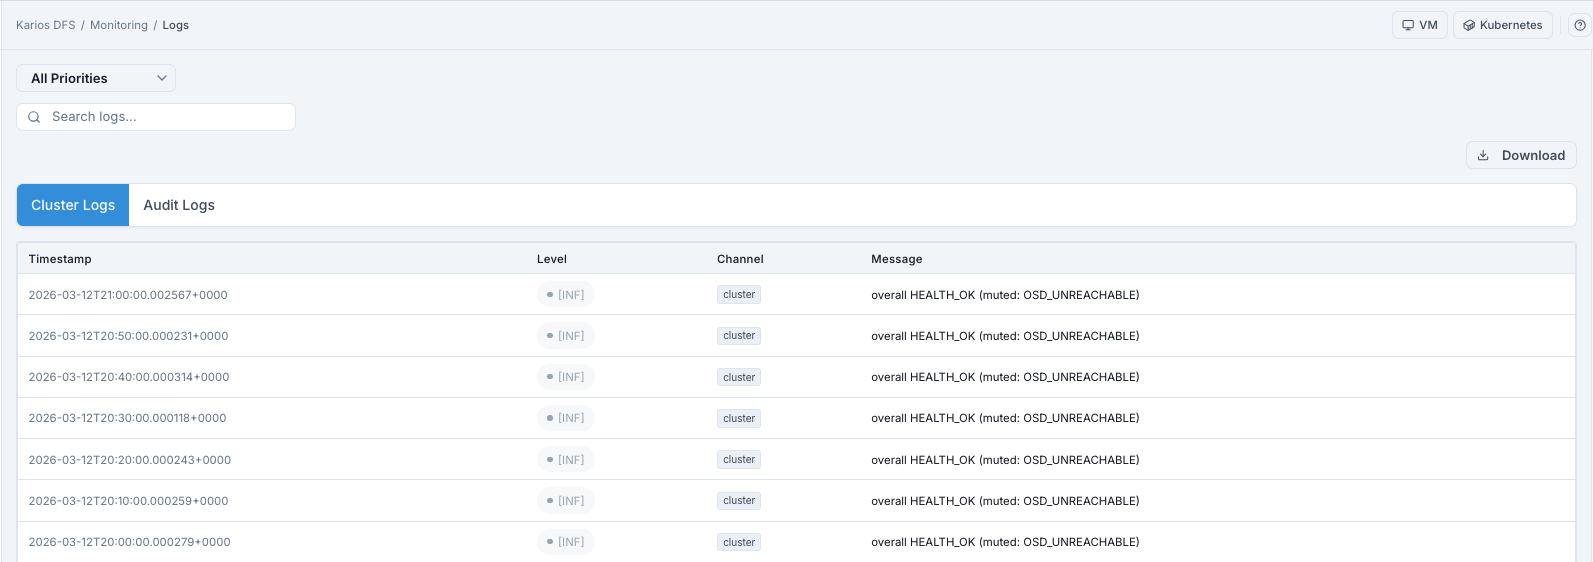
What This Screenshot Shows: Logs - Cluster Logs Tab (UI Reference; Values Depend On Your Environment).
Cluster Logs - Column Reference
Column |
What It Shows |
|---|---|
Timestamp |
Event time (UTC format) |
Level |
Entry severity (debug, info, warning, error, critical) |
Channel |
Log channel classification (for example |
Message |
Log message text and context |
How To Use Cluster Logs
Open
Cluster Logs.Filter by priority (start with
ERRandWRNfor incident triage).Search by keywords such as
HEALTH_ERR,slow request,osd.X.Scroll and isolate first occurrence time window.
Download filtered output when escalation evidence is needed.
Expected Outcome:
You identify error pattern, onset time, and impacted components.
Common Cluster Log Patterns
Pattern In Message |
Likely Meaning |
|---|---|
slow request |
OSD disk or network latency |
health HEALTH_ERR |
Critical cluster condition; check dashboard health banner |
osd.X is down |
OSD daemon stopped or host unreachable |
failed to authenticate |
Incorrect keyring or capability |
pg is not clean |
PG recovery in progress after OSD failure |
Audit Logs Tab
Path: Monitoring > Logs > Audit Logs
Shows records of user actions and configuration changes, filtered to the
audit channel.
Purpose:
To answer who changed what and when.
When to Use:
After unexpected config/state changes or during compliance review.
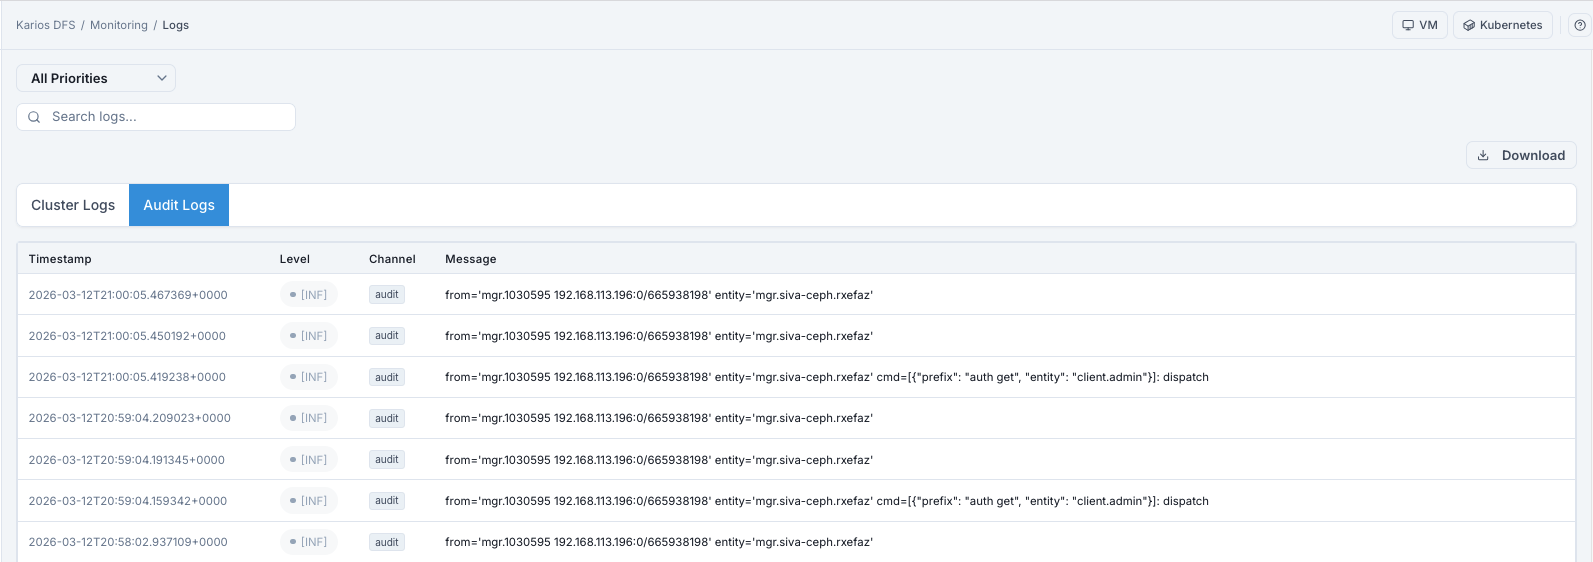
What This Screenshot Shows: Logs - Audit Logs Tab (UI Reference; Values Depend On Your Environment).
Audit Logs - Column Reference
Column |
What It Shows |
|---|---|
Timestamp |
Time action occurred |
Level |
Severity level (often |
Channel |
Always |
Message |
Executed command/API context including source entity and command payload |
How To Read An Audit Entry
Each entry includes fields like:
from: source daemon/address issuing commandentity: daemon/user identitycmd: command payload and prefix
How To Use Audit Logs
Open
Audit Logs.Search for target entity, command prefix, or source IP.
Filter priorities if needed.
Click
Download(top-right) to export filtered entries for compliance/change review.
Expected Outcome:
You identify who changed what, when, and via which command path.
When To Use Audit Logs
After unexpected configuration changes
During compliance or change-control review
During incident analysis to correlate admin actions with impact
Tip
UI create/edit/delete operations are represented as Ceph manager API actions and can be traced in Audit Logs.
Troubleshooting - Logs
Problem You See |
Most Likely Cause |
What To Do |
|---|---|---|
Cluster Logs show no entries |
Filter too restrictive or quiet buffer |
Reset to |
Audit Logs show no entries |
No recent admin actions |
This can be normal; widen time and filter scope. |
Repeated HEALTH_ERR entries |
Persistent unresolved cluster issue |
Note time window, then check Alerts > Firing. |
|
Active health check is muted |
Verify muted checks in Dashboard/alert controls. |
Cannot download logs |
Browser download restriction |
Allow downloads for site or use alternate browser. |
Tips
CLI Diagnostic Context
The journalctl example below is an optional host-level diagnostic path.
Before running it:
SSH to the target host.
Use an account with sudo/administrative privileges.
Use UI logs first, then host logs only when deeper daemon detail is required.
For daemon-level debug logs, SSH to the host and use
journalctl -u ceph-osd@<id>.Audit Logs are the best source for “who changed this?” questions.
Use
Downloadto save filtered results for sharing or offline analysis.