Infrastructure
See also
Prerequisites for infrastructure setup:
ISO Install completed (including Bootstrap) with Control Center access
Karios Forge if you are onboarding bare-metal nodes
Networking (optional in this phase; use when network customization is required)
0. Quick Overview
If you are new, use this section before the detailed steps.
Scope in this guide:
Control Center -> Infrastructurepages only (Dashboard, Zones, Pods, Clusters, Hosts)
What you will do in this section:
Validate dashboard health.
Verify zone baseline, then configure
Pod -> Cluster -> Hostin that order.Confirm host readiness, then continue to VM workflow.
New-user flow at a glance:
Login -> Dashboard check -> Zone -> Pod -> Cluster -> Host -> Final validation -> VM workflow
Tooltips and help drawer:
When available on a page, use the page help icon (top-right) when field labels are unclear.
Start with the Zones page help drawer for terms like
Allocation StateandNetwork Type.Confirm each required field meaning before creating or editing infrastructure objects.
Critical warnings before you change anything:
Do not continue if dashboard cards are all zero (fix Bootstrap first).
Do not create overlapping pod subnets or invalid IP ranges.
Do not delete clusters with attached hosts or running/stopped VMs.
Do not proceed to workload onboarding while host state is
Down,Disconnected, orAlert.
Quick troubleshooting entry points:
Dashboard issues: go to Dashboard Troubleshooting.
Zone issues: go to Zone Troubleshooting.
Pod issues: go to Pod Troubleshooting.
Cluster issues: go to Cluster Troubleshooting.
Host issues: go to Host Troubleshooting.
Common screen checks
Use these checks for read-only dashboard, overview, and details screens in Infrastructure before retrying a page action:
Confirm you are in the correct site, zone, pod, cluster, or host context.
Verify the parent object for the page exists, is healthy enough to load, and is visible to your role.
Open Observability and review recent Events/Alerts for the resource name and timestamp before retrying.
1. Overview
This section is the first Control Center workflow after ISO install, Bootstrap, and login.
Goal:
Understand Infrastructure pages
Configure core objects in correct order
Validate readiness before VM setup
Tip
Always follow this sequence: Zone -> Pod -> Cluster -> Host.
1.1. HA Proxy (Default System Behavior)
Note
For first-time infrastructure setup, focus on Zone -> Pod -> Cluster -> Host completion first.
HA proxy is enabled by default and is not a user-configurable toggle in the UI.
What is HA Proxy:
HA proxy is the traffic-handling layer that helps distribute service requests and improve availability across backend services.
Why it matters:
It improves service continuity during host/service changes.
It reduces single-path dependency for service traffic handling.
Current behavior:
Traffic handling is more resilient
Service interruption risk is reduced during changes/failures
HA proxy is enabled by default for clusters.
Users cannot enable or disable HA proxy from cluster actions.
Production implications:
Validate failover behavior in a maintenance window before production cutover.
Keep topology and ownership documentation current for incident response.
Validation:
Cluster view shows HA proxy state as active/default.
No user HA toggle action is expected in cluster actions.
2. Prerequisites
Before starting, confirm:
Karios ISO install is complete
Bootstrap completed without critical errors
You can log in to Karios portal
Your role has access to
Control Center
Role note:
Zone baseline is created by the platform administrator during Bootstrap. New operators verify zones and then create pods/clusters/hosts as permitted.
Pre-check table:
Check |
Where to verify |
Expected result |
|---|---|---|
Login access |
Portal login page |
Successful login |
Control Center access |
Left navigation |
|
Bootstrap state |
Dashboard cards |
Cards are not all zero |
RBAC action map (minimum expected access):
Page |
Needed action access |
If missing |
|---|---|---|
Dashboard |
View infrastructure |
Request dashboard visibility access from admin |
Zones |
View zone details |
Request |
Pods |
Create/update pod |
Request |
Clusters |
Create/update cluster |
Request |
Hosts |
Add/manage hosts |
Request |
Warning
If all cards are zero and no infrastructure objects exist, do not continue with pod/cluster/host creation. Fix Bootstrap first.
3. Infrastructure Basics (For New Users)
If this is your first time with infrastructure terms, use these simple meanings:
Term |
What it means |
Why it matters |
|---|---|---|
Zone |
Top-level boundary for a location or environment (for example, |
Pods, clusters, and hosts are scoped under a zone. If the zone is wrong, all child resources are placed in the wrong environment. |
Pod |
Network grouping inside a zone. A pod defines host-side networking values such as gateway, netmask, and management IP allocation range. |
Hosts consume IPs from pod ranges. Good pod design prevents IP conflicts and simplifies scale-out. |
Cluster |
Logical group of hosts sharing the same hypervisor type and management model. Clusters are where capacity and scheduling decisions are made. |
VMs are placed on hosts through cluster capacity, so cluster sizing and health directly impact workload stability. |
Host |
Physical server with hypervisor and BMC management access. It contributes CPU, memory, storage connectivity, and runtime execution for VMs. |
This is the actual compute layer. If hosts are down or misconfigured, clusters cannot run workloads. |
Simple hierarchy:
Zone -> Pod -> Cluster -> Host -> Virtual Machine
Real-world analogy:
Zone: Building
Pod: Floor/network segment
Cluster: Room of servers
Host: One physical server in that room
How these topics connect:
You choose the
Zonefirst (where resources belong).You define
Podnetworking (how hosts get management addresses).You create a
Cluster(where hosts are grouped for scheduling).You onboard
Hosts(actual hardware capacity for VMs).
4. New User Flow
Use this first-time flow:
Login -> Control Center -> Dashboard check
-> Verify Zone exists
-> Create/verify Pod
-> Create/verify Cluster
-> Add/verify Host
-> Final validation -> move to VM workflow
Decision branch for first-time setup:
If no zone exists: verify Bootstrap from
Control Center -> Dashboardand Bootstrap logs first. Then follow your operating model: delegated infra roles can create the baseline zone; admin-owned environments should request administrator creation.If zone exists but disabled: request enablement before creating pods/clusters.
5. Control Center Dashboard
Open Dashboard Page
When to Use:
Use this at the start of an Infrastructure check or before making Infrastructure changes.
Purpose:
Open the Dashboard and verify site health, capacity, and active alerts from one page.
This baseline check helps you avoid changes during degraded conditions.
Path:
Control Center -> Dashboard
Steps:
Click the Control Center icon in the far-left rail.
Click
Dashboard.The Control Center dashboard opens on the infrastructure overview page.
Expected Outcome:
You confirm baseline infrastructure health, capacity headroom, and alert posture before moving to object-level actions.
What you see first:
Top summary cards (Zones, Pods, Clusters, Hosts, VMs, Services).
Overview capacity widgets for compute, storage, and network.
Estimated time: 1-2 minutes
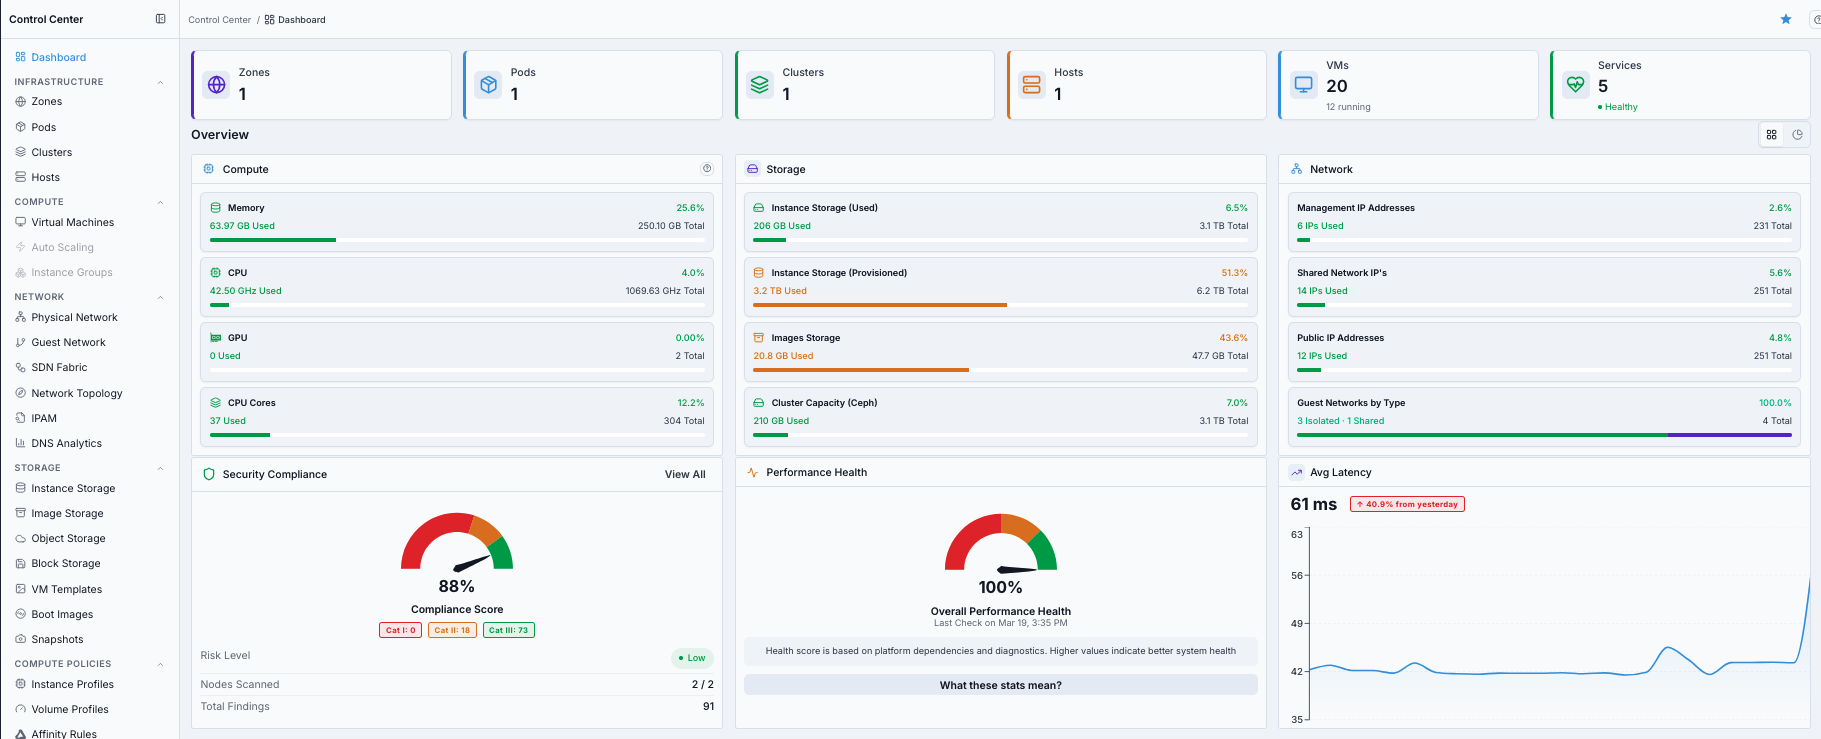
What this screenshot shows:
Control Center Dashboard with top summary cards for
Zones,Pods,Clusters,Hosts,VMs, andServicesOverviewsection withCompute,Storage, andNetworkutilization widgetsHealth widgets for
Security Compliance,Performance Health, andAvg Latency
Action in this screen:
Verify summary-card counts match expected environment footprint
Verify compute, storage, and network utilization values are within normal range
Verify compliance/health/latency widgets do not show abnormal risk trends
If this fails:
See Common screen checks before retrying this screen.
5.1. Summary and Overview Components
Component |
What it shows |
What new users should do |
|---|---|---|
|
Current infrastructure object counts. |
Confirm baseline objects exist before continuing to Zones/Pods/Clusters/Hosts pages. |
|
Total VMs and running count. |
Confirm workload activity matches expectation before maintenance changes. |
|
Platform service count and current service health state. |
If service health is not healthy, validate dependency health before making changes. |
|
Memory, CPU, GPU, and CPU core usage vs total. |
Confirm there is enough compute headroom for new workloads. |
|
Instance storage used/provisioned, image storage, and cluster capacity usage. |
Confirm storage growth is controlled and not near critical thresholds. |
|
Management/shared/public IP usage and guest network type distribution. |
Confirm available IP capacity before adding hosts or deploying VMs. |
|
Compliance score and finding categories. |
Track trend and escalate if score drops unexpectedly. |
|
Overall platform health score from dependency checks. |
Use as a go/no-go signal before onboarding more infrastructure objects. |
|
Latency trend graph with day-over-day change indicator. |
Investigate sudden spikes before capacity or placement actions. |
When to Use:
Use this as the continuation view of the same Dashboard page, after reviewing the first screenshot view.
Purpose:
The same Dashboard page also includes management server health, dependency status, IPAM/DCIM inventory, and recent alerts.
Steps:
Stay on
Control Center -> Dashboard.Scroll further down the same Dashboard page.
Review management/dependency/site/inventory/alert components.
Continue only when there are no blocking health signals.
Expected Outcome:
You complete a full dashboard readiness check across both screenshot views of the same page before moving to object-level actions.
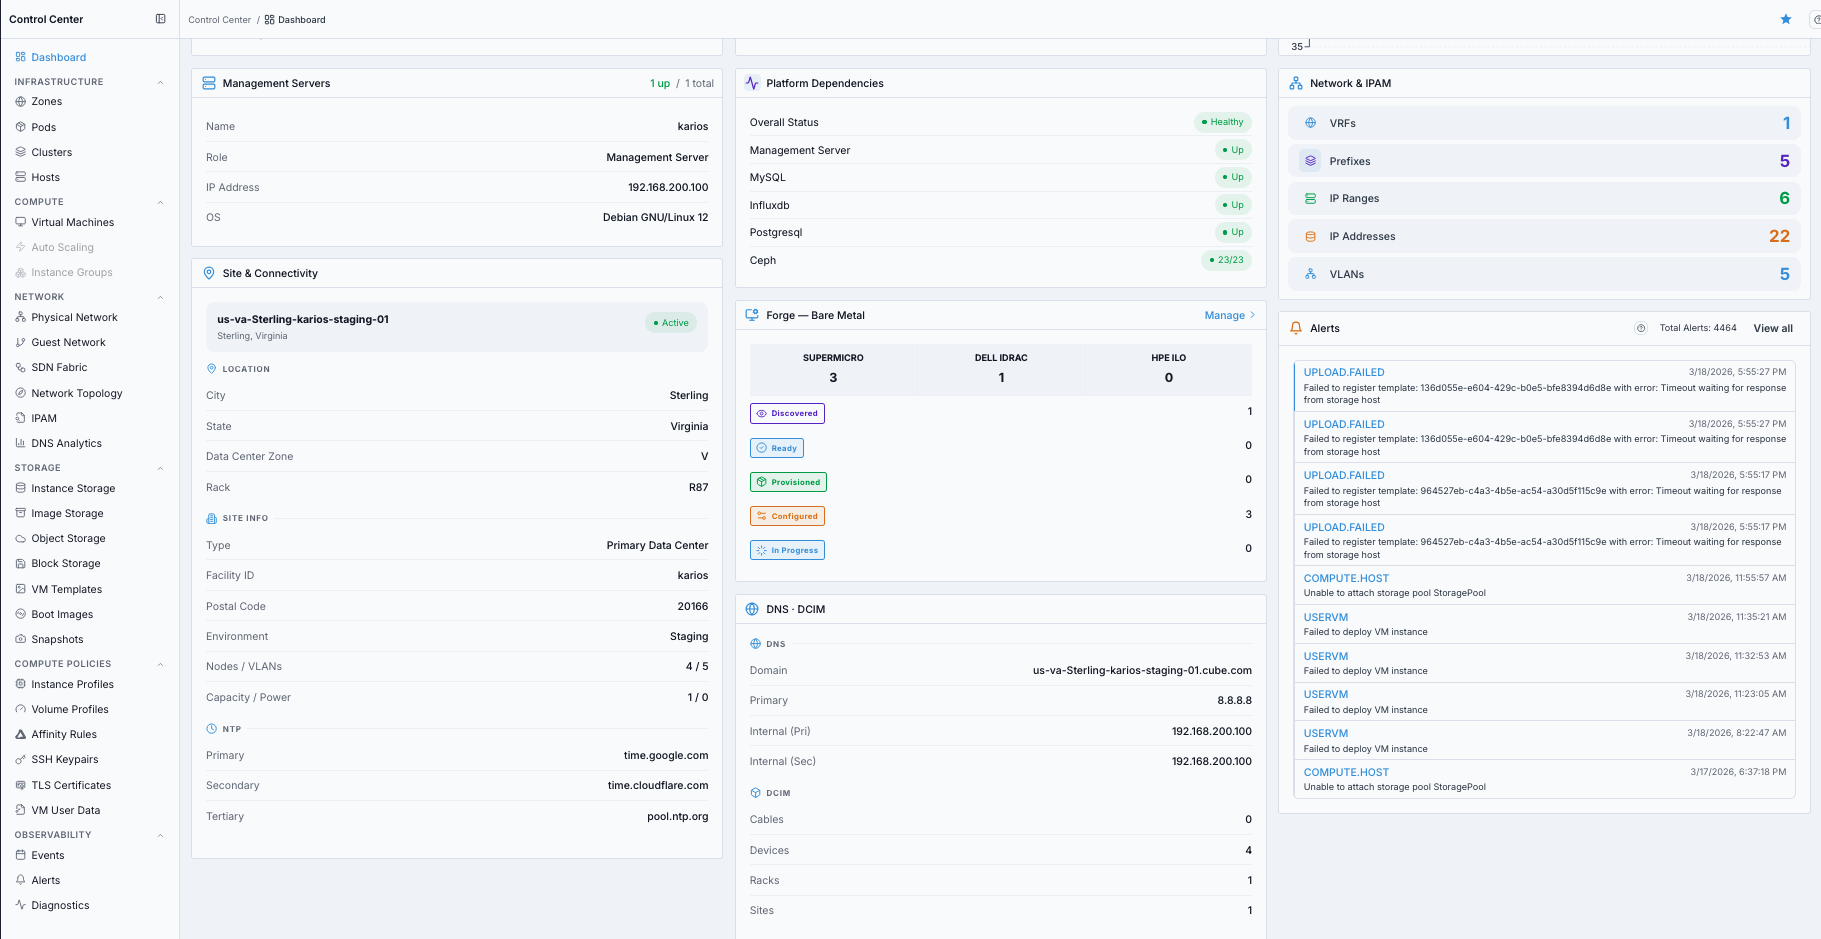
What this screenshot shows:
Control Center Dashboard continued view (second screenshot) from the same single page
Additional dashboard cards/widgets used for infrastructure validation and follow-up checks
What you can find:
Management-server status and core platform dependency health
Site, connectivity, IPAM, and DCIM inventory context
Bare-metal discovery/provisioning status and latest infrastructure alerts
If this fails:
See Common screen checks before retrying this screen.
5.2. Site, Operations, and Alert Components
Component |
What it shows |
What new users should do |
|---|---|---|
|
Active management node identity, role, IP, and OS. |
Confirm management plane is up before performing infrastructure operations. |
|
Dependency status for services such as management server, MySQL, InfluxDB, PostgreSQL, and Ceph. |
If any dependency is not |
|
VRFs, prefixes, IP ranges, IP addresses, and VLAN inventory counts. |
Validate address-management inventory before network or host expansion. |
|
Site identity, location, facility metadata, VLAN/node counts, and NTP endpoints. |
Confirm site metadata and NTP values are correct for operational consistency. |
|
Bare-metal lifecycle counters (discovered, ready, provisioned, configured, in progress) by vendor flow. |
Use this widget to track onboarding pipeline state before host assignment. |
|
DNS/domain details and DCIM inventory counters (devices, racks, sites, cables). |
Validate inventory visibility and DNS baseline before scaling infrastructure. |
|
Latest infrastructure-impact alerts with timestamp and |
Open |
5.3. How to Use the Dashboard
Open
Control Center -> Dashboard.Review summary cards and overview health widgets at the top.
Scroll on the same page to review management/dependency/site/inventory/alert widgets.
Continue to Zones only after dashboard checks are healthy.
5.4. Summary Cards (Click and Hover Behavior)
How to use summary cards:
Hover each card for a quick definition.
Click any card to open its resource list for detailed actions.
Use card counts as your first infrastructure health checkpoint before edits.
Clickable elements on this page:
Top summary card headings (
Zones,Pods,Clusters,Hosts,VMs,Services) are clickable and route to their respective pages.Component action labels such as
View All(for example in alerts/compliance areas when shown) open the related full page.On list pages (Zones, Pods, Clusters, Hosts), selecting a row opens the corresponding detail page.
When a widget or section title is rendered as a link in the UI, selecting it routes to that section’s full page.
5.4.1. Access Dashboard Help Page
When to Use:
Use this during dashboard review when a card/widget label or metric meaning is unclear.
Purpose:
Context help ensures you interpret dashboard health and capacity indicators correctly before taking action.
Navigation:
Control Center -> Dashboard
Steps:
Open the Dashboard page.
Click the page help icon in the top-right.
Search for the metric or field name you need.
Use inline info icons beside headings/labels for quick definitions.
Expected Outcome:
You can interpret dashboard metrics with consistent definitions before proceeding to infrastructure actions.
Quick card actions:
Zones: open zone boundaries and verify the target environment.Pods: open pod networking and capacity grouping.Clusters: open cluster readiness and placement context.Hosts: open host health and available compute capacity.VMs: open VM state and investigate total-vs-running gaps.Services: open dependency health details inObservability -> Diagnosticsbefore provisioning changes.
If this fails:
See Common screen checks before retrying this screen.
5.4.2. Summary Card Reference
When to Use:
Use this while reading top summary cards and deciding where to drill down next.
Purpose:
Provide a quick card-by-card mapping of meaning, click behavior, and most common user task.
Steps:
Read the card name and count.
Match it with the table below to confirm meaning and default action path.
Click the card to open the target page for detailed review.
Expected Outcome:
You can interpret each summary card correctly and navigate directly to the right operational page.
Card |
What it means |
Click action and common task |
|---|---|---|
|
Top-level infrastructure boundaries (datacenter/availability domains). |
Opens the Zones list. Use to validate zone readiness and allocation state. |
|
Rack-level groupings inside a zone. |
Opens the Pods list. Use to verify pod network ranges and capacity grouping. |
|
Host groups with shared hypervisor/storage behavior. |
Opens the Clusters list. Use to validate HA, managed state, and placement. |
|
Physical compute servers available for workload placement. |
Opens the Hosts list. Use to onboard hosts or review host health/utilization. |
|
Total VM count and running VM count. |
Opens |
|
Platform dependency service count and overall health. |
Opens |
Recent alerts visibility:
The dashboard can show alerts as a dedicated card or as a
Recent Alertswidget, depending on layout.Use
View allto openObservability -> Alertsand triage critical items first.
If this fails:
See Common screen checks before retrying this screen.
5.5. Dashboard Areas (What to Use and When)
The dashboard is one continuous page with multiple operational areas:
Dashboard Area |
What it gives you |
When to use it |
|---|---|---|
Top summary and overview area |
Summary cards, capacity widgets (compute/storage/network), and health widgets. |
Use for daily readiness checks and pre-change validation. |
Site and inventory area |
Management server, site/connectivity metadata, IPAM, and DCIM inventory context. |
Use before network, host, and capacity expansion work. |
Dependency and alert area |
Platform dependency health plus latest alert feed with drill-down action. |
Use when health is degraded or error/incident signals are visible. |
5.6. Capacity and Health Guidance
When to Use:
Use this during daily checks, before provisioning changes, and whenever dashboard health appears degraded.
Purpose:
Provide clear interpretation rules for capacity widgets and health indicators so decisions are consistent.
Steps:
Review display mode and color status for Compute, Storage, and Network.
Validate latency and performance health trends before making changes.
Check compliance and recent alerts, then proceed only when risk is acceptable.
Expected Outcome:
You make go/no-go infrastructure decisions using consistent thresholds and panel behavior.
Display controls used in capacity panels:
Donutview: quick utilization percentage.Listview: used/total breakdown in bar format.Expand: full-screen review for detailed inspection.
Color coding used across capacity views:
Green (0-69%): healthy headroom.
Orange (70-89%): monitor and plan expansion.
Red (90%+): action required immediately.
Compute panel guidance:
Why: verify CPU, memory, GPU, and core headroom before new VM placement.
How: hover donuts to read used/available/total and utilization.
Outcome: clear go/no-go decision for compute scaling.
Storage panel guidance:
Why: validate Instance Storage and Image Storage growth trends before provisioning.
How: review used vs total; expand panel if trend context is needed.
Outcome: avoid deployment failures caused by insufficient storage capacity.
Network panel guidance:
Why: ensure private and public IP pools can support upcoming deployments.
How: review used and total IP counts in panel tooltips.
Outcome: prevent VM provisioning blocks caused by exhausted IP ranges.
Ceph storage metric (if available):
Use as raw cluster storage trend visibility.
Interpret it as raw capacity, not directly usable capacity after replication overhead.
Security compliance and health widgets:
Security Compliance: use compliance score, risk level, and findings to prioritize remediation.Health: use overall status, service state, and uptime as operational readiness checks.Recent Alerts: use as immediate triage queue; openView Allfor full context and follow-up.
Avg latency panel guidance:
< 50 ms: healthy response times.50-100 ms: acceptable but monitor trend.> 100 ms: elevated; checkObservability -> Diagnosticsfor the slow dependency.Red upward day-over-day change badge means latency increased vs yesterday and should be investigated if sustained.
Green downward badge means latency improved vs yesterday.
Performance health gauge guidance:
The gauge score reflects dependency readiness and latency posture (higher is healthier).
What these stats mean?opensObservability -> Diagnosticsfor per-dependency status, latency, and errors.Use gauge drops as a stop signal for non-essential provisioning changes until dependency health stabilizes.
Forge bare metal panel guidance:
Vendor groups include
SUPERMICRO,DELL iDRAC, andHPE iLO.Lifecycle states:
Discovered: detected, not yet readyReady: inventoried and ready for provisioningProvisioned: OS/hypervisor installedConfigured: fully configured for workload useIn Progress: provisioning/configuration running
Use
Manageto open bare-metal orchestration for deeper lifecycle actions.
If this fails:
See Common screen checks before retrying this screen.
5.7. Site and Inventory Validation
Use these dashboard site/inventory cards when you need environment correctness checks before infrastructure changes.
What to validate:
LocationandSite Info: confirm correct site and environment context.DNS Configuration: confirm domain and resolver endpoints are correct.NTP Servers: confirm primary/secondary/tertiary time sources are configured.Site Statistics: check node and capacity counts for expansion readiness.IPAM: verify prefixes, ranges, and address inventory headroom.DCIM: verify physical inventory visibility (devices, racks, cables, manufacturers).
Why this matters:
Correct site metadata avoids wrong-site operations.
Correct DNS/NTP avoids service discovery and timestamp consistency issues.
Correct IPAM/DCIM baseline reduces expansion and troubleshooting errors.
5.8. Platform Dependency Checks
Use the Platform Dependencies card for real-time control-plane health checks.
Summary bar interpretation:
Service Ready: overall readiness state (Ready/Partial/Unavailable).Dependencies: total monitored dependency count.Healthy: healthy dependency count vs total.Avg Latency: average service response time.Errors: observed error count in the active window.
Dependencies table outcome model:
UPwith normal latency and low errors: healthy service path.DEGRADED: service reachable but at risk; monitor and stabilize.DOWN: service unavailable; investigate immediately and expect feature impact.
When to act immediately:
Service Readyis notReady.Any critical dependency is
DOWN.Latency and error trends spike together across dependencies.
5.9. Dashboard Warnings and Troubleshooting
Warning
Do not continue with provisioning or topology edits when dashboard health is degraded or critical alerts are active.
Problem |
Likely cause |
What to do |
|---|---|---|
High alert count on dashboard |
Active platform incidents |
Open |
Capacity panel above 90% |
Resource saturation |
Add capacity or reduce load before onboarding additional workloads. |
Platform Dependencies shows unhealthy state |
One or more dependencies are degraded/down |
Open the dependency list, identify affected services, then continue triage in |
VMs count much higher than running count |
Stopped or errored VM population |
Open |
IP-related deployment failures |
IP pool exhaustion or range mismatch |
Validate dashboard |
Time/certificate anomalies |
NTP configuration drift |
Validate dashboard site/connectivity NTP values and restore synchronized time sources. |
Expected Outcome:
Cards are populated
Metrics are visible (after host/storage onboarding)
Do not proceed if:
Cards remain all zero
Dashboard shows persistent load/errors
Tip
Check this page daily for capacity trend and health at a glance.
6. Zones
Zones are the top-level infrastructure boundary. As a new user, think of a zone as the place where all downstream compute and network objects live. Start here to confirm you are in the correct environment before creating pods and clusters.
Zone key concepts:
Zone: top-level infrastructure boundary, aligned to a datacenter or availability domain.Allocation State:Enabledallows new allocations;Disabledblocks new allocations while existing workloads continue.Network Type: networking model for the zone (Advanced).DNS: public and internal DNS settings used for resolution.Guest CIDR: guest network address space reserved for VM networking.
Verify-only flow:
Verify that Bootstrap already created your target zone.
If no required zone exists, stop and request administrator action to create it.
Note
Zones are created during the initial site Bootstrap and reflect your datacenter’s physical layout. All pods, clusters, and hosts reside within a zone.
Open Zones Dashboard
Note
The Add Zone (Create Zone) button is currently disabled in this release, so new zones cannot be created from the UI yet. The steps below are provided for when it is enabled.
When to Use:
Use this when validating zone readiness before pod/cluster work.
Purpose:
Zones define the top-level infrastructure boundary and allocation state for all downstream objects.
Path:
Control Center -> Zones
Steps:
Click the Control Center icon in the far-left rail.
Click
Zones.The Zones dashboard opens with the zone list and top summary widgets.
Expected Outcome:
You confirm the target zone exists, is enabled, and is ready for pod and cluster operations.
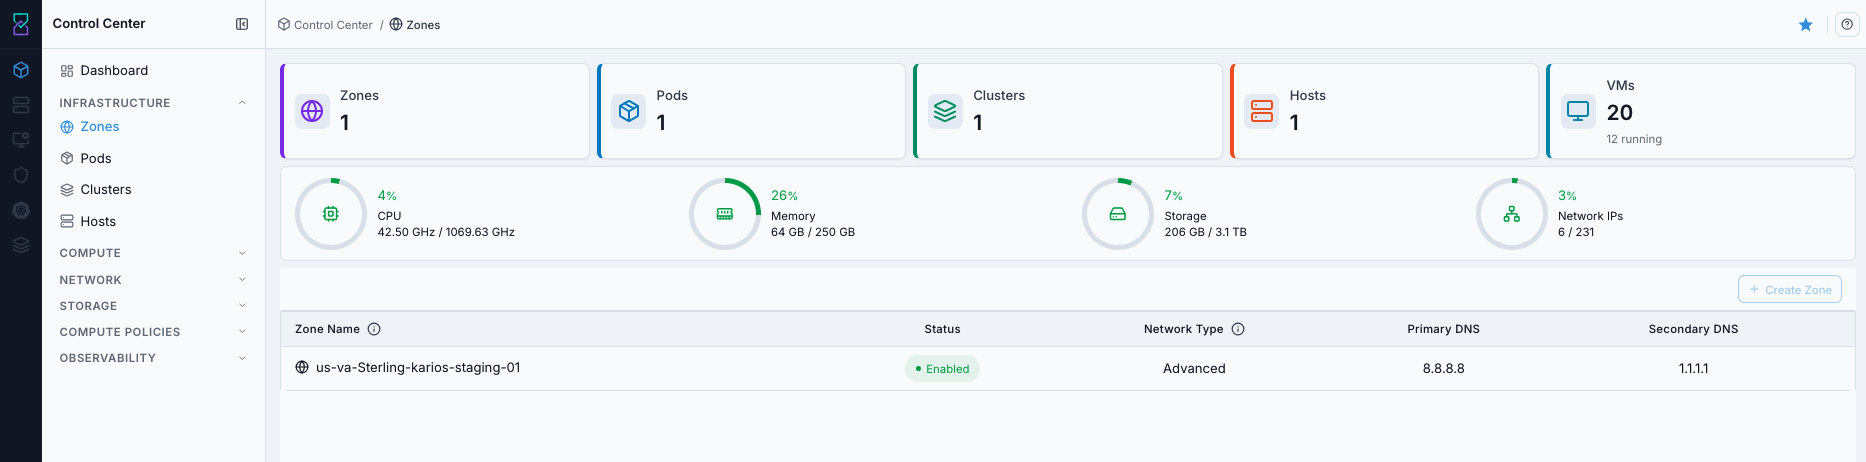
What you see first:
Zones table with zone name, status, and DNS/network columns.
Zone-level summary widgets above the table.
Estimated time: 2-3 minutes
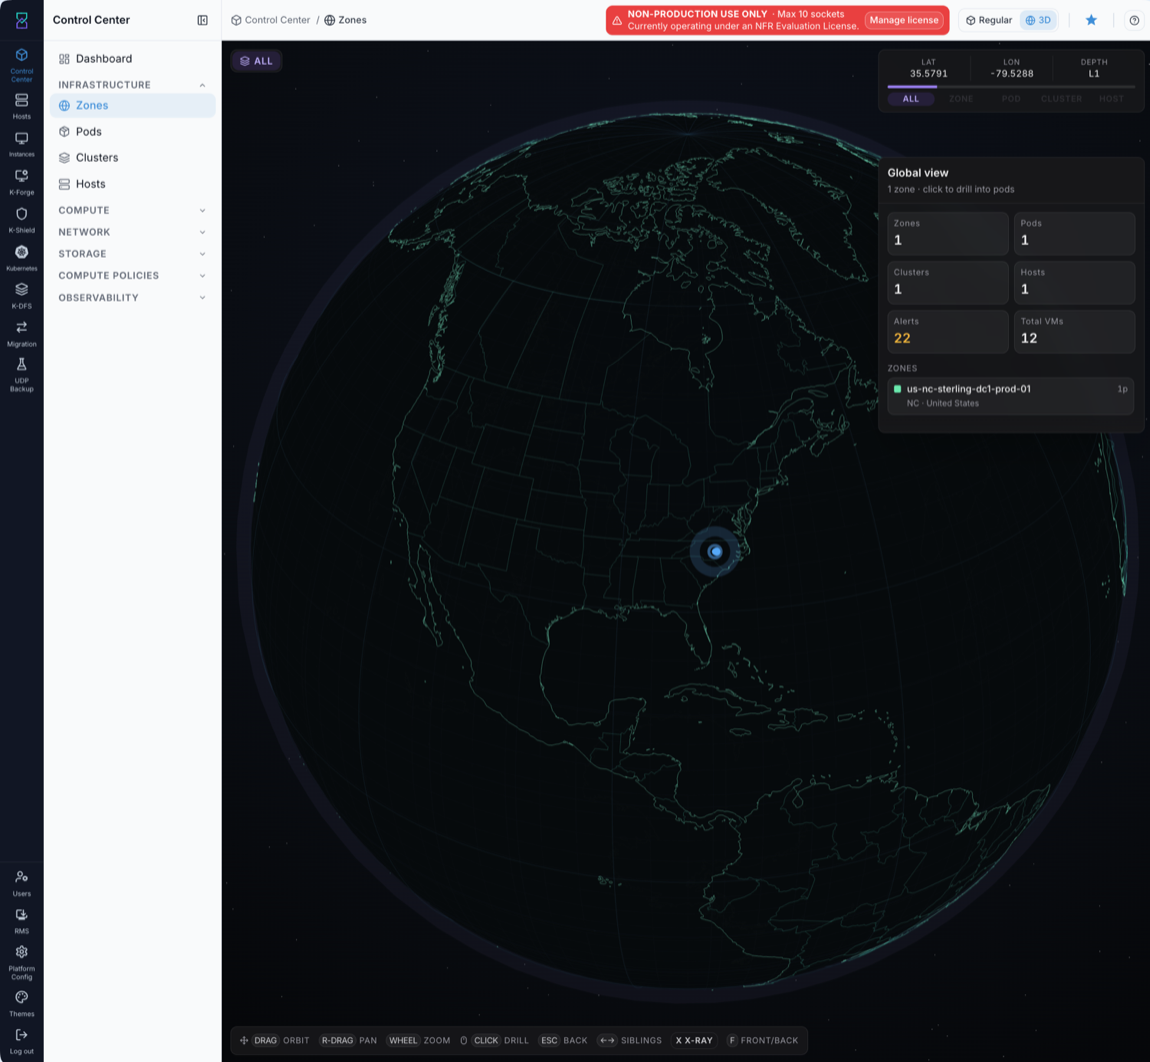
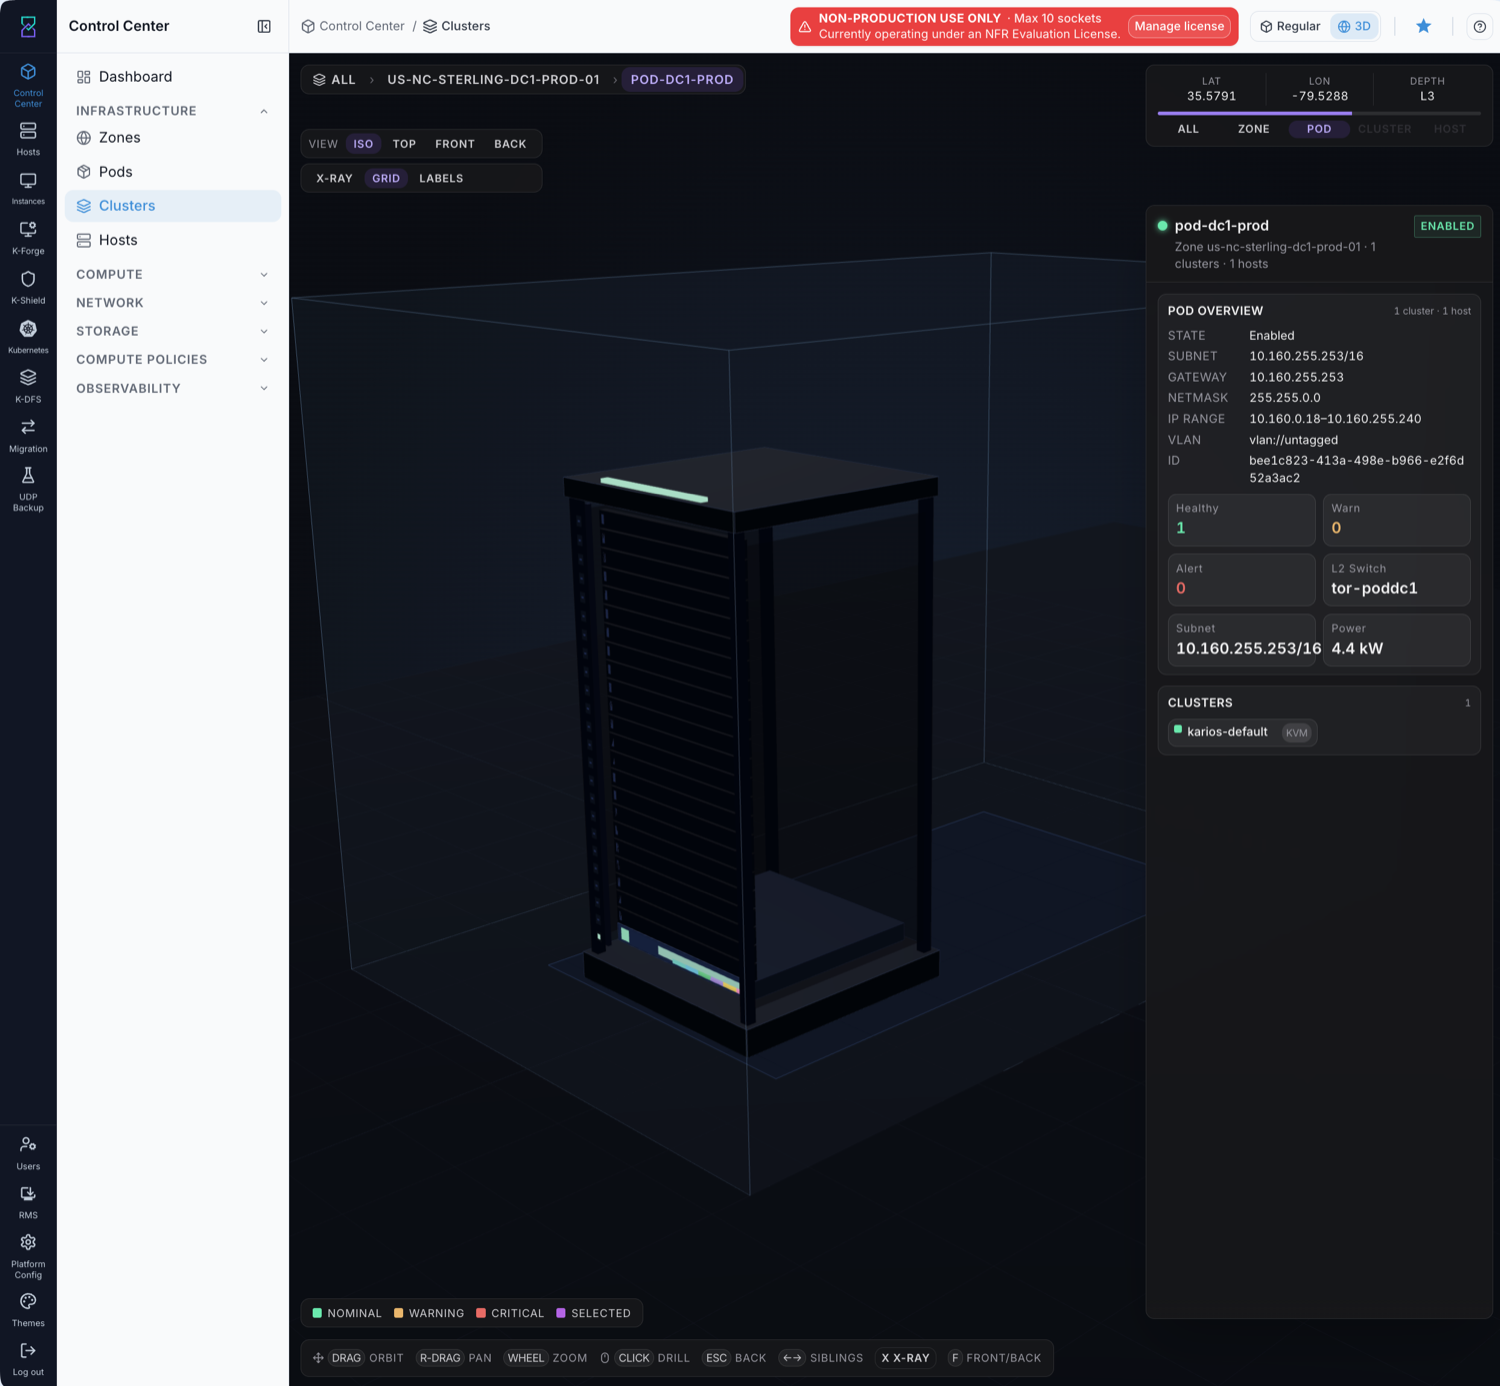
The 3D view of the same zones is shown below.
What this screenshot shows:
Zone list with columns for
Status,Network Type,Primary DNS, andSecondary DNSTop utilization summary rings for zone-level capacity/health context
Action in this screen:
Confirm zone exists and is
EnabledOpen zone details for DNS/network validation
Help on this page (use before changes):
Click the page help icon in the top-right to open the help drawer.
Use the help search box to find terms like
Allocation StateandNetwork Type.Use inline info icons beside labels to confirm field meaning.
If zone is missing:
Do not create a zone from this workflow.
Raise an administrator request to complete zone Bootstrap for the target site.
Continue only after the required zone appears and is enabled.
Zones table columns:
Column |
Description |
|---|---|
Zone Name |
Display name of the zone. Select the row to open zone details. |
Status |
Allocation state of the zone (enabled/disabled for new allocations). |
Network Type |
Zone networking model. |
Primary DNS |
Primary public DNS resolver. |
Secondary DNS |
Secondary public DNS resolver. |
If this fails:
See Common screen checks before retrying this screen.
6.1. Access Zone Help Page
When to Use:
Use this before editing zone-related settings or when you need field definitions.
Purpose:
The help panel provides immediate, page-specific definitions so you can validate terminology before taking action.
Navigation:
Control Center -> Zones
Steps:
Open the Zones dashboard.
Click the page help icon in the top-right.
In the help drawer, search for field names such as
Allocation StateorNetwork Type.Apply the guidance, then continue with validation or actions on the same page.
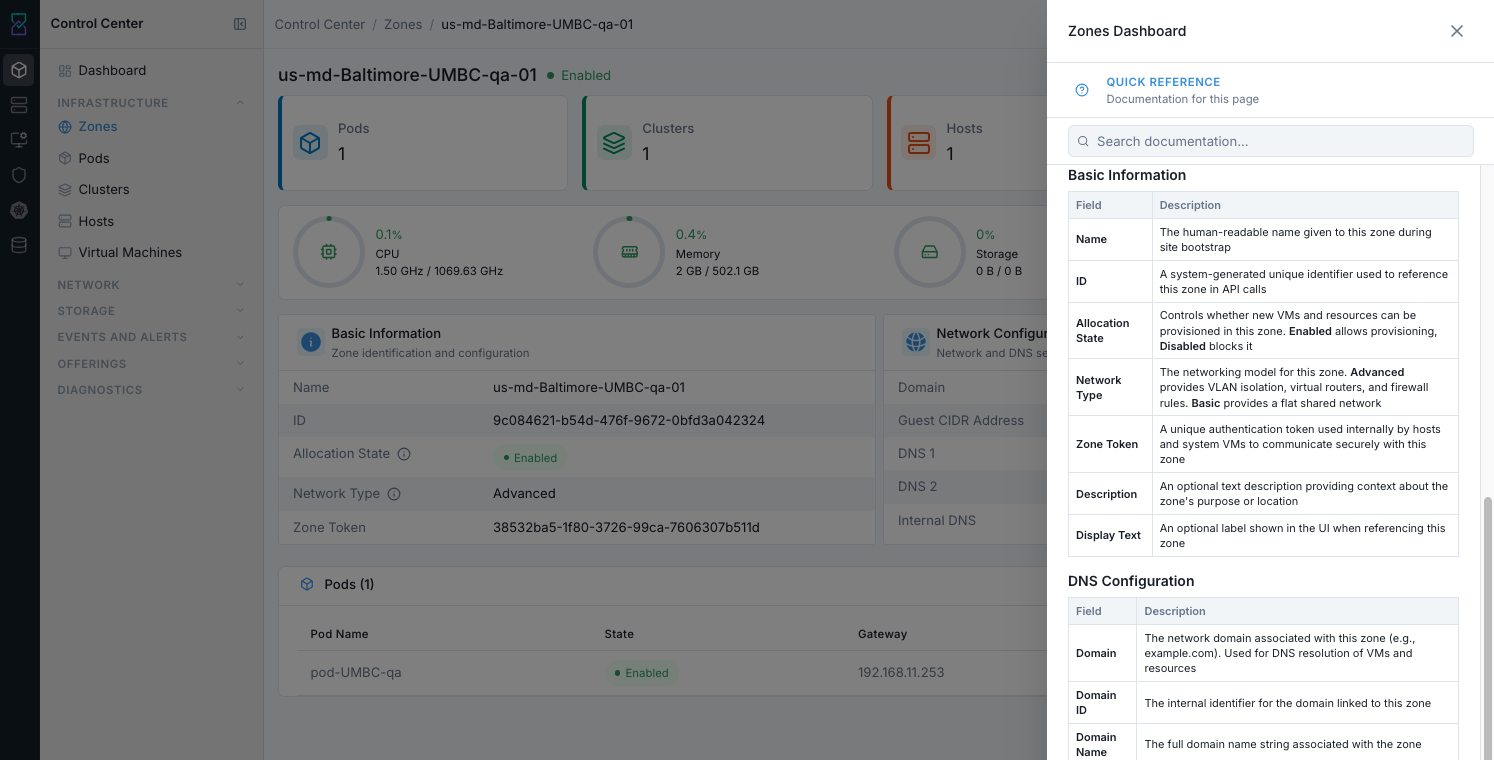
What this screenshot shows:
Built-in page help drawer with field-by-field definitions (for example allocation state and network type)
Search box to quickly find documentation for current page terms
Expected Outcome:
You confirm field meaning and avoid incorrect configuration decisions.
If this fails:
See Common screen checks before retrying this screen.
6.2. Access Zone Details Page
When to Use:
Use this before creating pods/clusters or when validating zone readiness.
Purpose:
Zone details confirms allocation state, DNS/domain settings, and guest CIDR scope.
Validating this first prevents downstream network and placement issues.
Navigation:
Control Center -> Zones
Steps:
Open the Zones list page.
Click the target zone row (
Zone Name) to open its details page.Review
Basic InformationandNetwork Configurationcards.Confirm
Allocation Stateis enabled and DNS/guest-network values match your plan.
Expected Outcome:
You confirm the selected zone is safe for pod/cluster onboarding.
You can catch zone-level misconfiguration before provisioning actions.
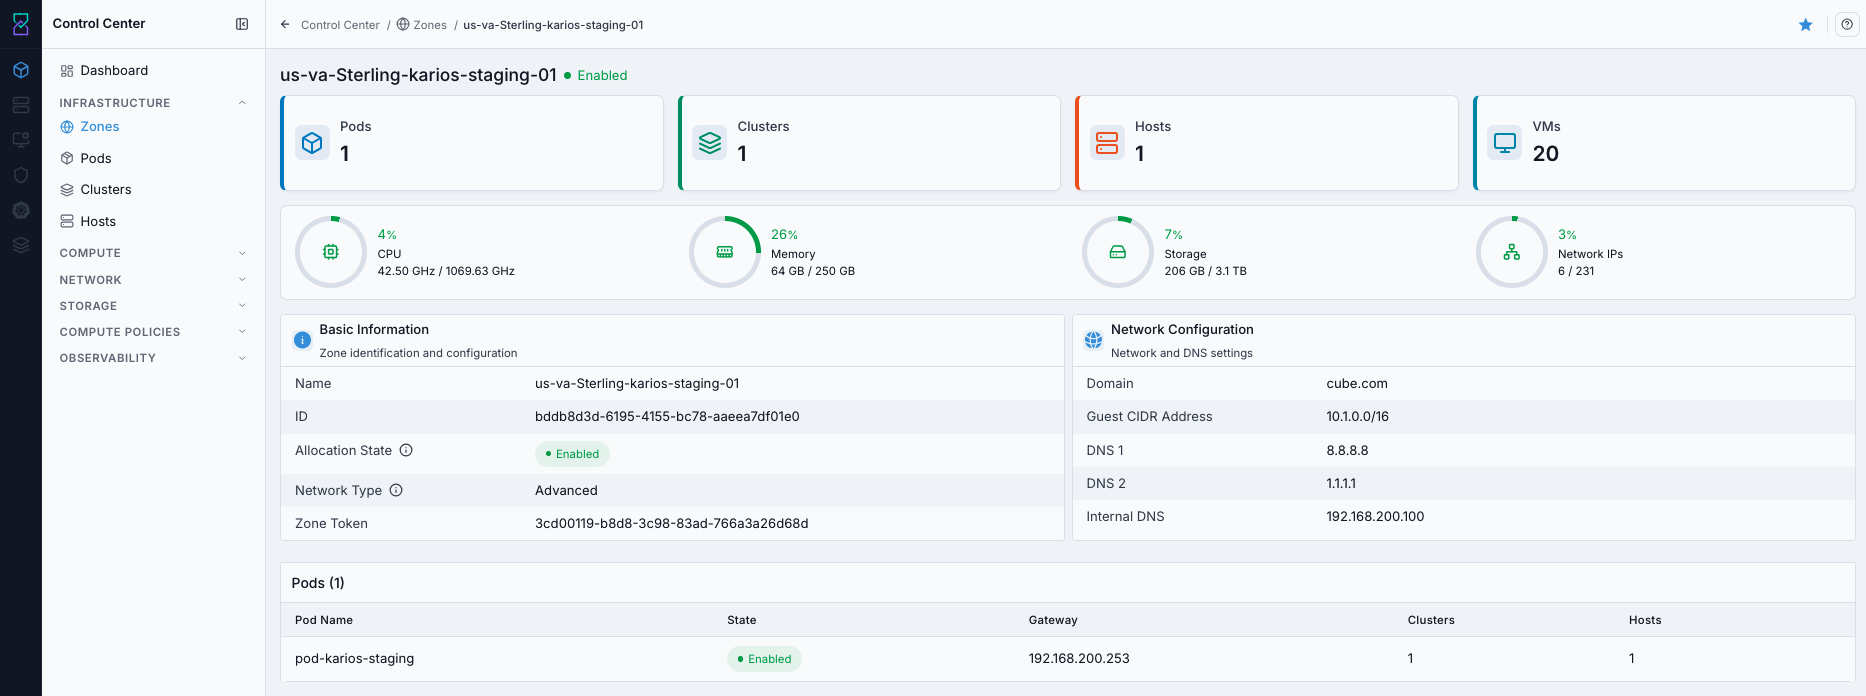
What this screenshot shows:
Zone detail header with enabled state
Basic InformationandNetwork Configurationcards (domain, guest CIDR, DNS, internal DNS)Embedded pod list with gateway and attached clusters/hosts counts
What you can find:
Zone state, network type, DNS/domain, and overall readiness
Zone detail cards and fields:
Basic Information:
Field |
Description |
|---|---|
Name |
Human-readable zone name. |
ID |
System identifier used for API and internal references. |
Allocation State |
Controls whether new resources can be provisioned in this zone. |
Network Type |
Networking model used by this zone. |
Zone Token |
Internal authentication token used for secure zone communication. |
Description / Display Text |
Optional descriptive labels if configured. |
DNS Configuration:
Field |
Description |
|---|---|
Domain / Domain ID / Domain Name |
Zone domain identity used for name resolution context. |
DNS 1 / DNS 2 |
Primary and fallback public DNS resolvers. |
Internal DNS |
Internal resolver used for management-domain name lookups. |
Network Configuration:
Field |
Description |
|---|---|
Guest CIDR Address |
Address space reserved for guest VM network allocation. |
Routed Mode Enabled |
Indicates routed networking mode where available. |
Router Private/Public Interface Max MTU |
Interface MTU values where exposed by your environment. |
Note
Some zone fields are deployment-dependent. If a field is not shown in your UI, treat it as not exposed in your current environment.
Expected Outcome:
At least one enabled zone is ready for pod placement
Do not proceed if:
No usable zone exists
Zone remains disabled
Zone checklist:
Item |
Validation |
|---|---|
Status |
|
DNS |
Primary DNS configured |
Scope |
Correct zone selected for your environment |
Next step:
Go to
Control Center -> Podsand verify/create the pod for this zone.
If this fails:
See Common screen checks before retrying this screen.
7. Pods
Pods define host management networking inside a zone. This is where you decide gateway, subnet, and host IP range. Correct pod values are required before onboarding hosts, because hosts consume these addresses.
Pod key concepts:
Zone: each pod belongs to one zone.Clusters: pods contain one or more clusters.Instance Storage: workload storage attached at pod/cluster scope.Image Storage: used for VM templates, Boot Images, and snapshots.
Pod operational tips:
Pods are created during initial zone setup.
Modifying a pod network configuration can impact all clusters and hosts inside that pod. Plan and validate changes carefully before applying.
If a pod allocation state is
Disabled, new VMs and additional resources cannot be provisioned in clusters under that pod.
Create vs verify:
Verify existing pod settings first.
Create a new pod only when you need a new network segment or no usable pod exists.
Open Pods Dashboard
When to Use:
Use this when validating existing pod network ranges or preparing to add a new pod.
Purpose:
Pod network settings (gateway, netmask, IP range) directly impact host onboarding and cluster growth.
Path:
Control Center -> Pods
Steps:
Click the Control Center icon in the far-left rail.
Click
Pods.The Pods dashboard opens with the pod list and create action.
Expected Outcome:
You can verify pod-to-zone mapping and network-range readiness before cluster and host actions.
What you see first:
Pod table with zone, gateway, netmask, and IP range columns.
Create Podaction in the top-right.
Estimated time: 3-5 minutes
The 3D view of the same pods is shown below.
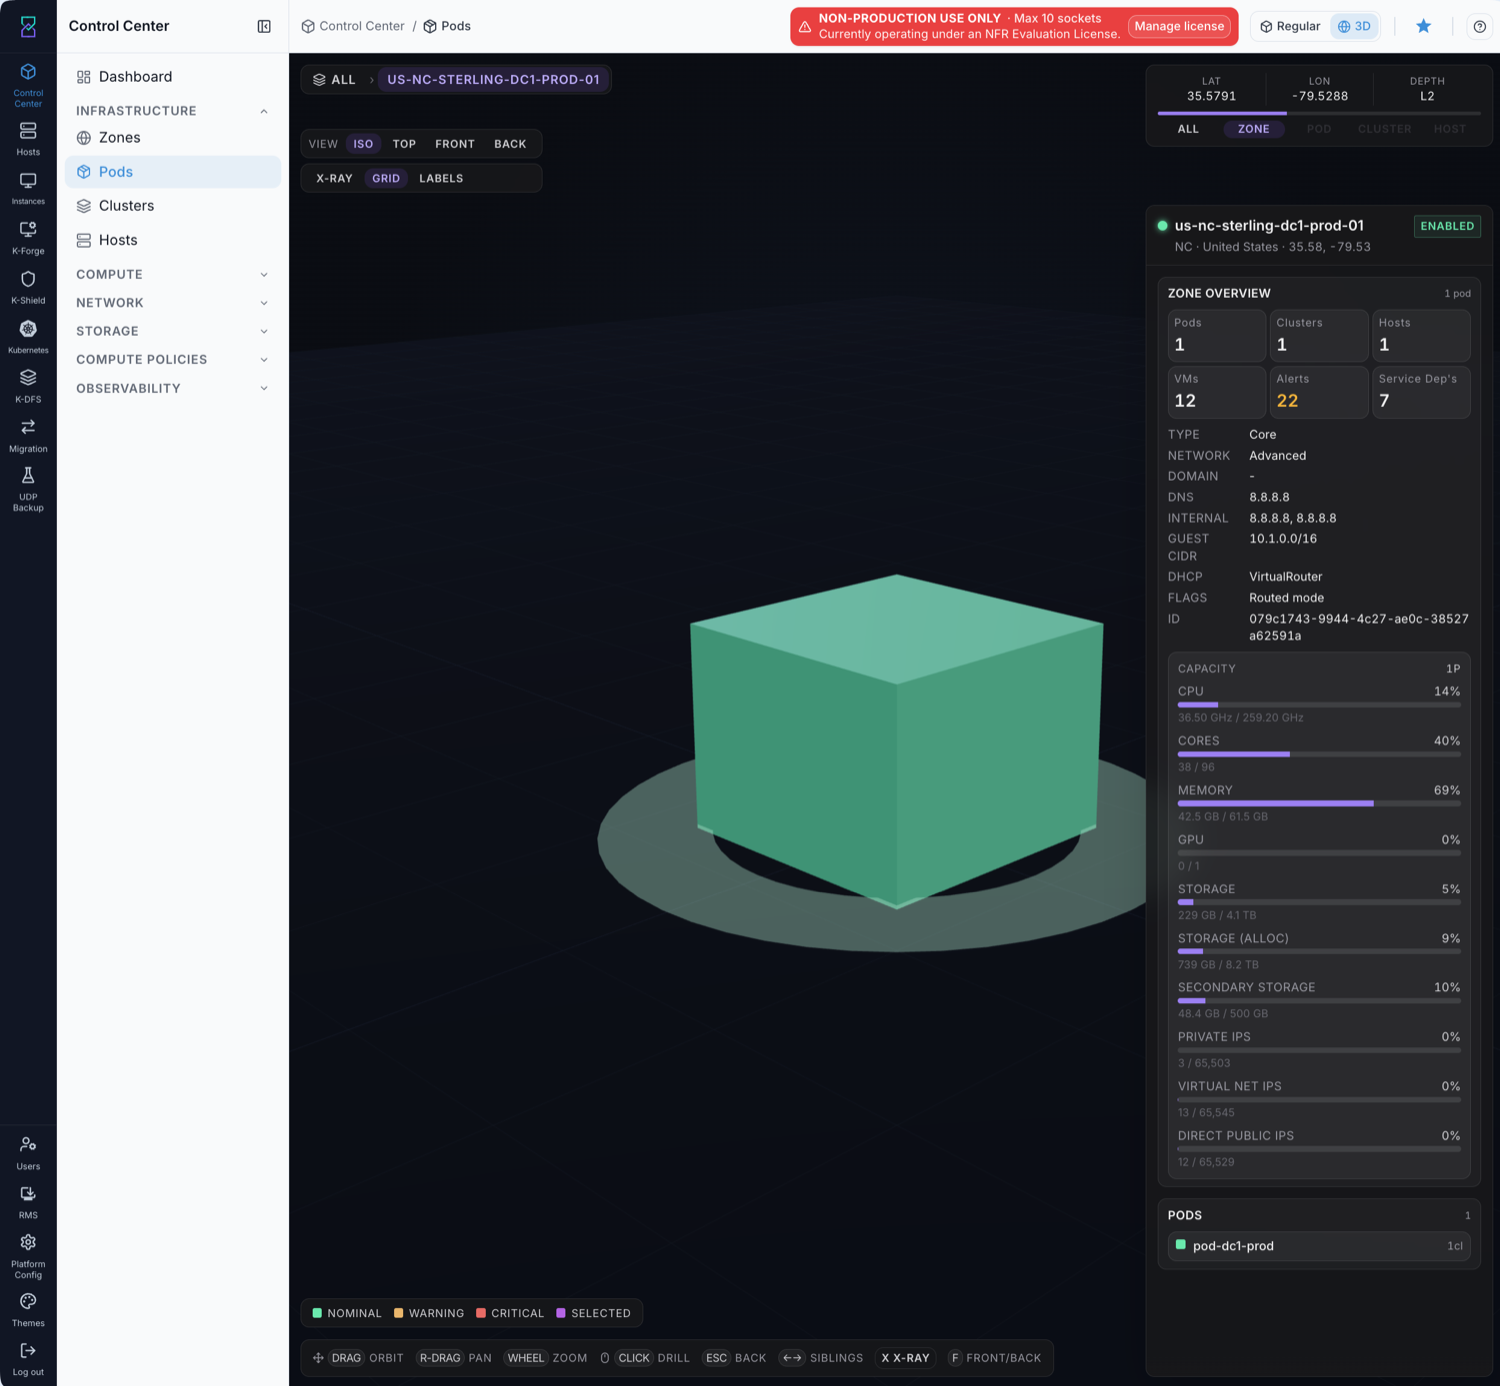
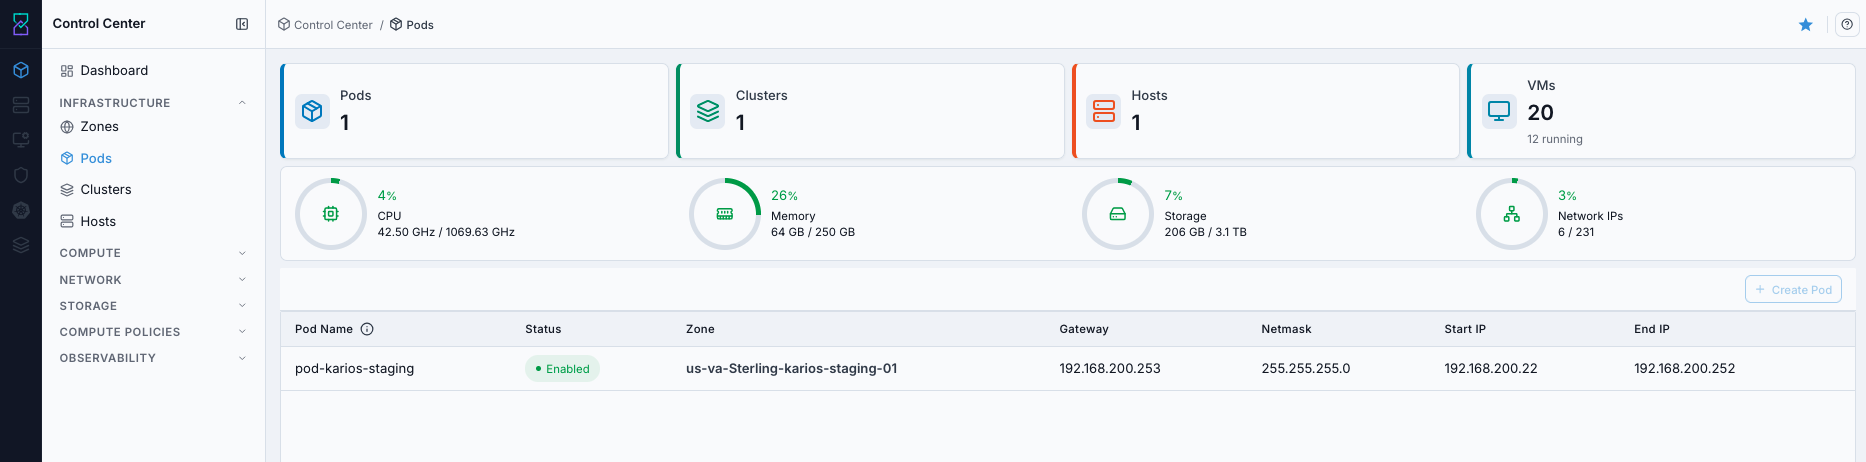
What this screenshot shows:
Pod list with
Zone,Gateway,Netmask,Start IP, andEnd IPCreate Podaction and top-level capacity indicators
Action in this screen:
Review existing pods
Click
Create Podto add a new pod
If this fails:
See Common screen checks before retrying this screen.
Create Pod (When Required)
Note
The Add Pod (Create Pod) button is currently disabled in this release, so new pods cannot be created from the UI yet. The steps below are provided for when it is enabled.
When to Use:
Perform this action when no existing pod satisfies the required management subnet and IP range for the target zone.
Purpose:
Create a pod when you need a new management network segment or when no existing pod matches your zone/network plan.
Navigation:
Control Center -> Pods
Steps:
On the Pods dashboard, click
Create Pod.In the
Create Poddrawer, selectZone.Enter
Pod Name.Enter
GatewayandNetmask.Enter
Start IPandEnd IP.Submit with
Create Pod.
What this screenshot shows:
Create Poddrawer with required fields: zone, pod name, gateway, netmask, start IP, and end IP.Form submit action for creating the pod after validation.
Expected Outcome:
The pod appears in the list under the selected zone.
Pod details show the configured gateway/netmask/IP range.
If allocation state is enabled, the pod is ready for cluster and host onboarding.
How to verify:
Confirm the new pod row appears in
Control Center -> Pods.Open pod details and verify
Zone,Gateway,Netmask,Start IP, andEnd IPmatch submitted values.Confirm
Allocation Stateis enabled.
If unavailable:
If
Create Podis not visible, verify role permissions and zone scope.If the button is disabled, correct mandatory field validation errors and retry.
If creation continues to fail, use Pod Troubleshooting.
If this fails:
See Common screen checks before retrying this screen.
7.1. Access Pod Help Page
When to Use:
Use this before submitting pod create/edit actions when field intent is unclear.
Purpose:
The help panel and info icons provide page-specific definitions that reduce network-value input errors.
Navigation:
Control Center -> Pods
Steps:
Open the Pods dashboard.
Click the page help icon in the top-right.
Search for field names such as
Gateway,Netmask, orAllocation State.Use inline info icons beside labels for quick field confirmation.
Expected Outcome:
You validate pod field expectations before submission and reduce avoidable validation failures.
Pods table columns:
Column |
Description |
|---|---|
Name |
Pod display name. |
Allocation State |
Pod enablement state for new allocations. |
Zone |
Parent zone of this pod. |
Gateway |
Pod network gateway. |
Netmask |
Pod subnet mask. |
Create Pod field map:
Field |
What to enter |
|---|---|
|
Target zone where hosts will be onboarded. |
|
Unique pod identifier aligned with your naming standard. |
|
Pod gateway IP for the selected subnet. |
|
Netmask matching the gateway and host allocation range. |
|
First host allocation IP in subnet (exclude gateway). |
|
Last host allocation IP in subnet (must be greater than |
Create Pod form behavior (UI):
The form opens from
Create Podand requires all mandatory fields before submission.Zoneselection drives pod placement; validate zone first to avoid rework.If validation fails, correct subnet/range inputs before retrying submission.
Example values (reference):
Gateway:
192.168.117.253Netmask:
255.255.255.0Start IP:
192.168.117.20End IP:
192.168.117.100
Validation of example:
Start and end are in same subnet as gateway
Range excludes gateway address
Enough free IPs remain for growth
If this fails:
See Common screen checks before retrying this screen.
7.2. Access Pod Details Page
When to Use:
Use this after pod creation or when validating existing pod network values.
Purpose:
Pod details confirms the zone mapping, allocation state, and final gateway/netmask/IP range values.
Navigation:
Control Center -> Pods
Steps:
Open the Pods dashboard.
Click the target pod row (
Name) to open pod details.Review
General InformationandNetwork Configuration.Confirm zone mapping and network range values are correct.
Expected Outcome:
You validate pod readiness before cluster creation and host onboarding.
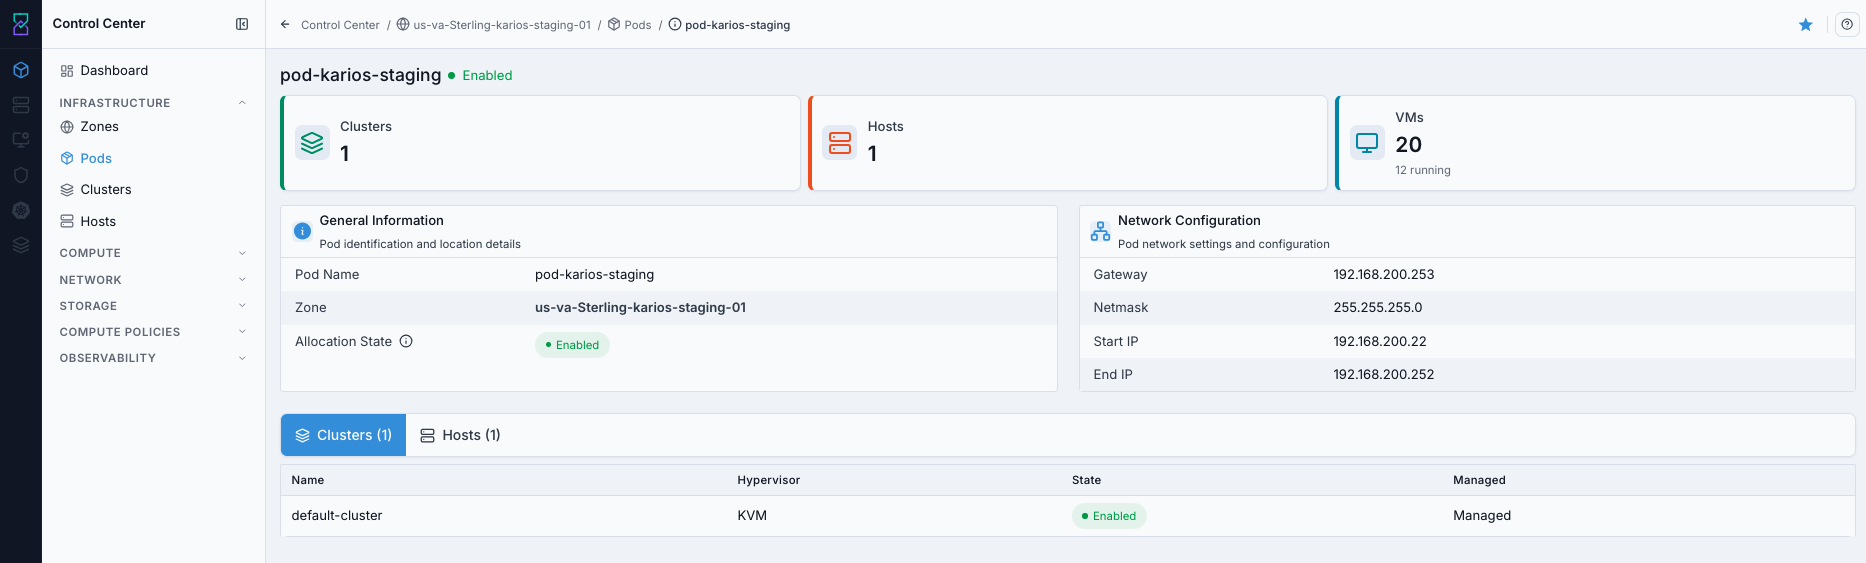
What this screenshot shows:
Pod detail header and allocation state
General InformationandNetwork Configurationcards with finalized pod valuesAttached
ClustersandHoststables for downstream dependency validation
What you can find:
Pod-to-zone mapping
Pod gateway/subnet and host allocation range
Pod detail cards and fields:
General Information:
Field |
Description |
|---|---|
Pod Name |
Pod identifier used in the infrastructure hierarchy. |
Zone / Zone ID |
Parent zone for this pod. |
Allocation State |
Controls whether new allocations can be made in the pod. |
Network Configuration:
Field |
Description |
|---|---|
Gateway |
Gateway address for the pod network. |
Netmask |
Subnet mask for pod addressing. |
Start IP / End IP |
Pod allocation IP range for infrastructure resources. |
Viewing and pagination:
Click any pod row to open pod details.
Use table pagination controls to navigate large pod lists.
Expected Outcome:
Pod appears in list
Pod state is enabled
Pod details match entered network values
Do not proceed if:
Pod create fails due to invalid network values
Pod state is not enabled after creation
Warning
Do not use overlapping subnets/IP ranges. Ensure Start IP < End IP and both are in the selected subnet.
Next step:
Go to
Control Center -> Clustersand verify/create the cluster in this pod.
If this fails:
See Common screen checks before retrying this screen.
8. Clusters
Clusters organize hosts into a workload-capable group. You select management type and hypervisor here. If you plan multiple environments, create separate clusters (for example, production vs testing) instead of mixing workloads in one cluster.
HA proxy note:
HA proxy helps distribute and maintain service traffic across available backend services.
HA proxy is enabled by default to improve resilience during node/service changes.
HA state is visible in cluster details, and HA actions can be available from the cluster actions menu based on role/policy.
Create vs verify:
Verify existing cluster health and mapping first.
Create a new cluster only when you need isolation, extra capacity, or a different workload boundary.
Open Clusters Dashboard
When to Use:
Use this when checking cluster health/placement or preparing to create a new cluster.
Purpose:
Cluster state determines whether hosts can be safely onboarded and whether workloads can be placed as expected.
Path:
Control Center -> Clusters
Steps:
Click the Control Center icon in the far-left rail.
Click
Clusters.The Clusters dashboard opens with cluster status and action controls.
Expected Outcome:
You confirm cluster mapping, status, and available actions before making cluster-level changes.
What you see first:
Cluster table with type, hypervisor, zone, pod, and health columns.
Create Clusteraction and row-levelActionsmenu.
Estimated time: 3-5 minutes
The 3D view of the same clusters is shown below.
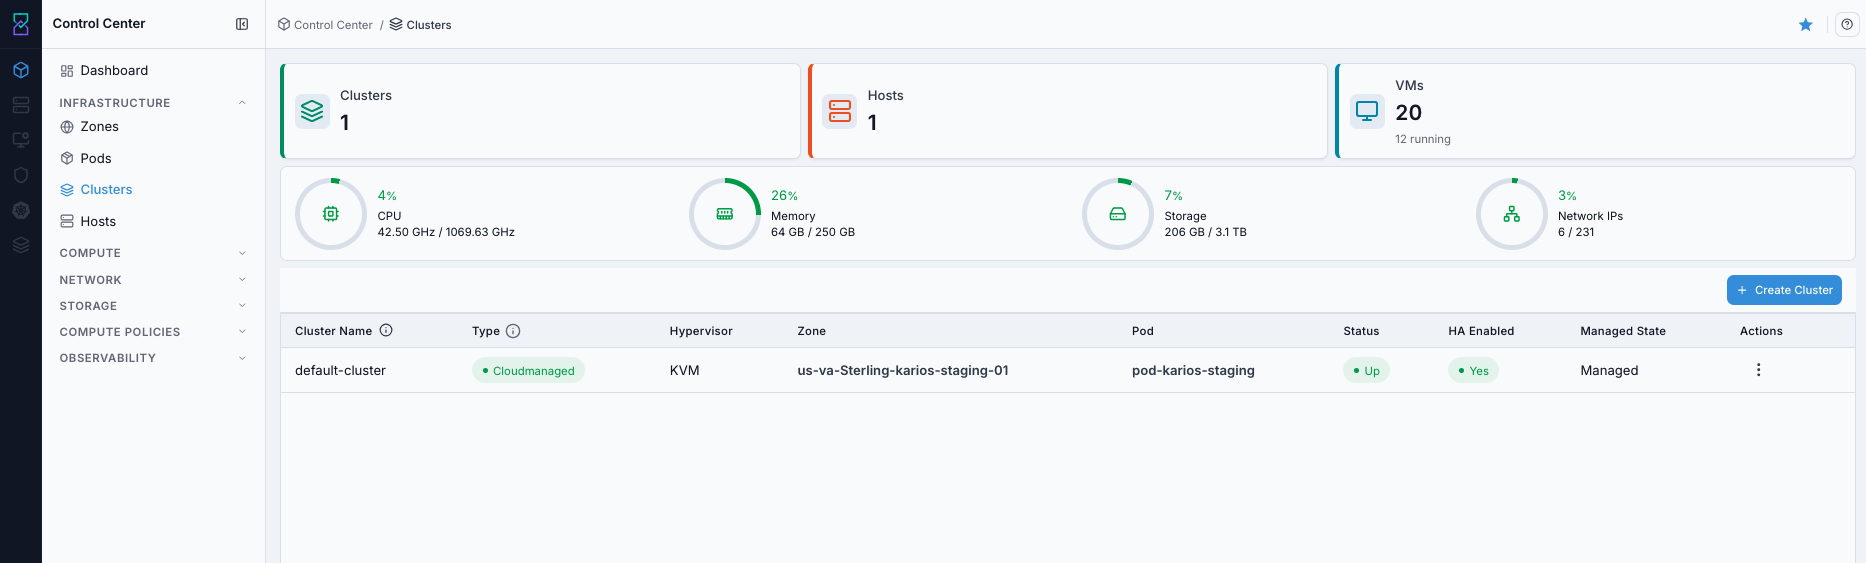
What this screenshot shows:
Cluster table with
Type,Hypervisor,Zone,Pod,Status,HA Enabled, andManaged StateCreate Clusteraction button and row-level actions menu
Action in this screen:
Review existing clusters
Click
Create Clusterto open the create panelUse row
Actionsfor available cluster operations such as delete (subject to policy/state)
If this fails:
See Common screen checks before retrying this screen.
Cluster Actions
When to Use:
Use this when you need to run cluster-level operations from the list view.
Purpose:
Row actions are the fastest operational entry point for cluster controls without opening full details first.
Steps:
Open
Control Center -> Clusters.Find the target cluster row.
Open the row
Actionsmenu.Select the required action (for example HA toggle or delete, based on policy/state).
Expected Outcome:
You access cluster operations directly from the dashboard list for faster day-to-day management.
Cluster actions are opened from the row Actions menu in the Clusters table. Some environments also expose equivalent actions in the cluster details header.
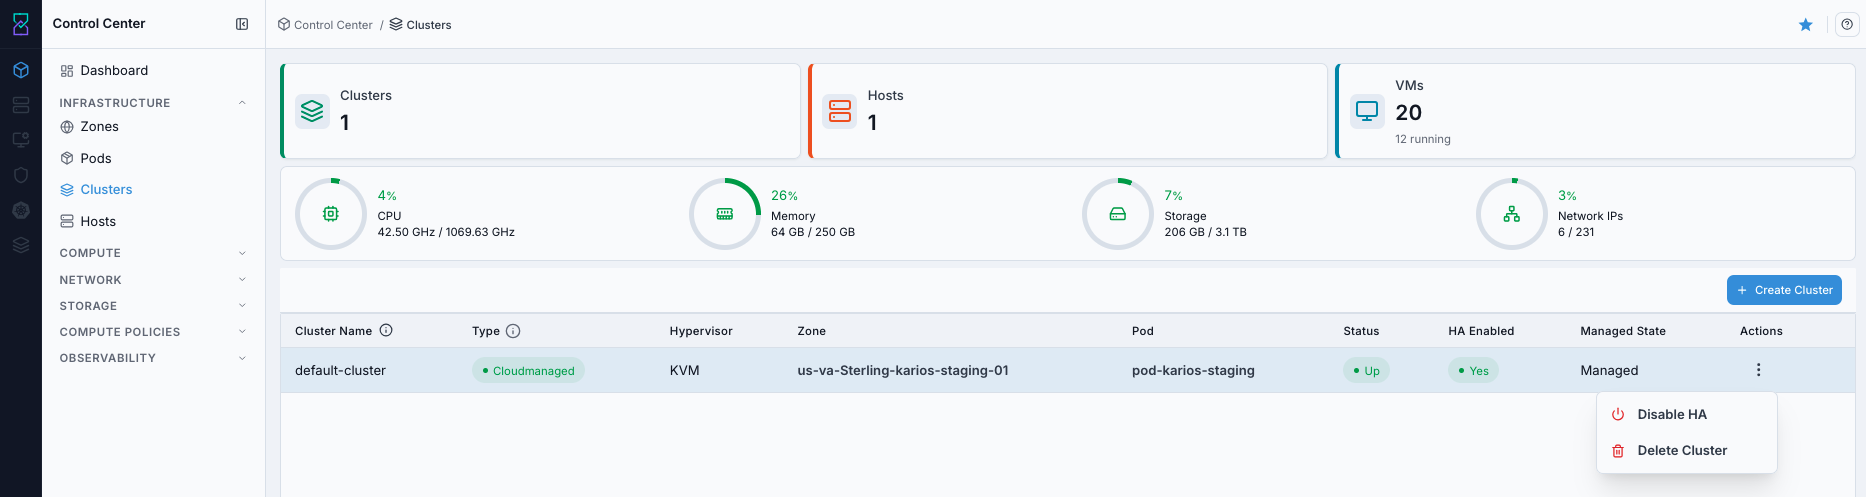
What this screenshot shows:
Actionsdropdown opened from a cluster rowCluster-level operations available from row actions (for example HA toggle and delete, based on policy/state)
Button |
Description |
|---|---|
Disable HA |
Disables high availability for the selected cluster. Use only during planned maintenance or explicit operational exceptions. Result: cluster stays active, but HA protection is no longer applied until re-enabled. |
Delete Cluster |
Permanently removes the cluster and associated cluster object metadata. Result: the cluster is removed from the list and cannot be restored from the UI. |
Disable HA (when available):
When to Use:
Perform only during approved maintenance/change windows when temporary removal of HA protection is required.
Purpose:
Temporarily disable HA protection only when a planned operation requires it and rollback is defined.
Navigation:
Control Center -> Clusters -> row Actions (⋮)
Steps:
Open the target cluster row
Actionsmenu.Click
Disable HA.Confirm the action when prompted.
Expected Outcome:
Cluster remains active, but automatic HA failover protection is disabled until re-enabled.
How to verify:
Open cluster details and confirm
HA Enabledshows disabled/off.
If unavailable:
The action can be hidden by role, policy, or current cluster state.
Use approved change-control paths if direct action is blocked.
Delete Cluster (when required):
When to Use:
Perform only after all workloads, hosts, and dependencies are removed and the cluster is no longer needed.
Purpose:
Permanently remove an unused cluster object after dependency cleanup to avoid stale infrastructure state.
Navigation:
Control Center -> Clusters -> row Actions (⋮)
Steps:
Validate all delete safety checks listed below.
Open the target cluster row
Actionsmenu.Click
Delete Cluster.Confirm deletion in the dialog.
Expected Outcome:
The cluster object is permanently removed from the list.
How to verify:
Refresh
Control Center -> Clustersand confirm the deleted cluster row is no longer present.
If unavailable:
Deletion is blocked while dependencies still exist or policy prevents delete.
Remove dependencies first, then retry.
Optional actions by environment:
View Details: open full cluster detail page.Edit: modify supported cluster settings.Scale: adjust associated cluster resources where supported.
Note
HA is enabled by default. If Disable HA is available in your environment, use it only with approved change control and clear rollback planning.
Warning
Action buttons can be disabled while the cluster is in a transitional state.
Delete safety checks (must pass before delete):
No hosts are attached to the cluster.
No running or stopped VMs are mapped to hosts in this cluster.
No active dependency (placement, policy, or operational runbook) still references this cluster.
A replacement cluster/path exists if workloads must continue.
If these checks are not met, do not delete. Correct dependencies first.
If this fails:
See Common screen checks before retrying this screen.
Create Cluster (When Required)
Note
The Add Cluster (Create Cluster) button is currently disabled in this release, so new clusters cannot be created from the UI yet. The steps below are provided for when it is enabled.
When to Use:
Perform this action when no existing cluster meets the required zone/pod mapping or workload isolation requirement.
Purpose:
Create a cluster when you need a new workload boundary, separate lifecycle domain, or additional host capacity grouping.
Navigation:
Control Center -> Clusters
Steps:
On the Clusters dashboard, click
Create Cluster.In the
Create Clusterdrawer, selectZone.Select
Pod.Enter
Cluster Name.Select
Cluster TypeandHypervisorwhen those fields are shown.Submit with
Create Cluster.
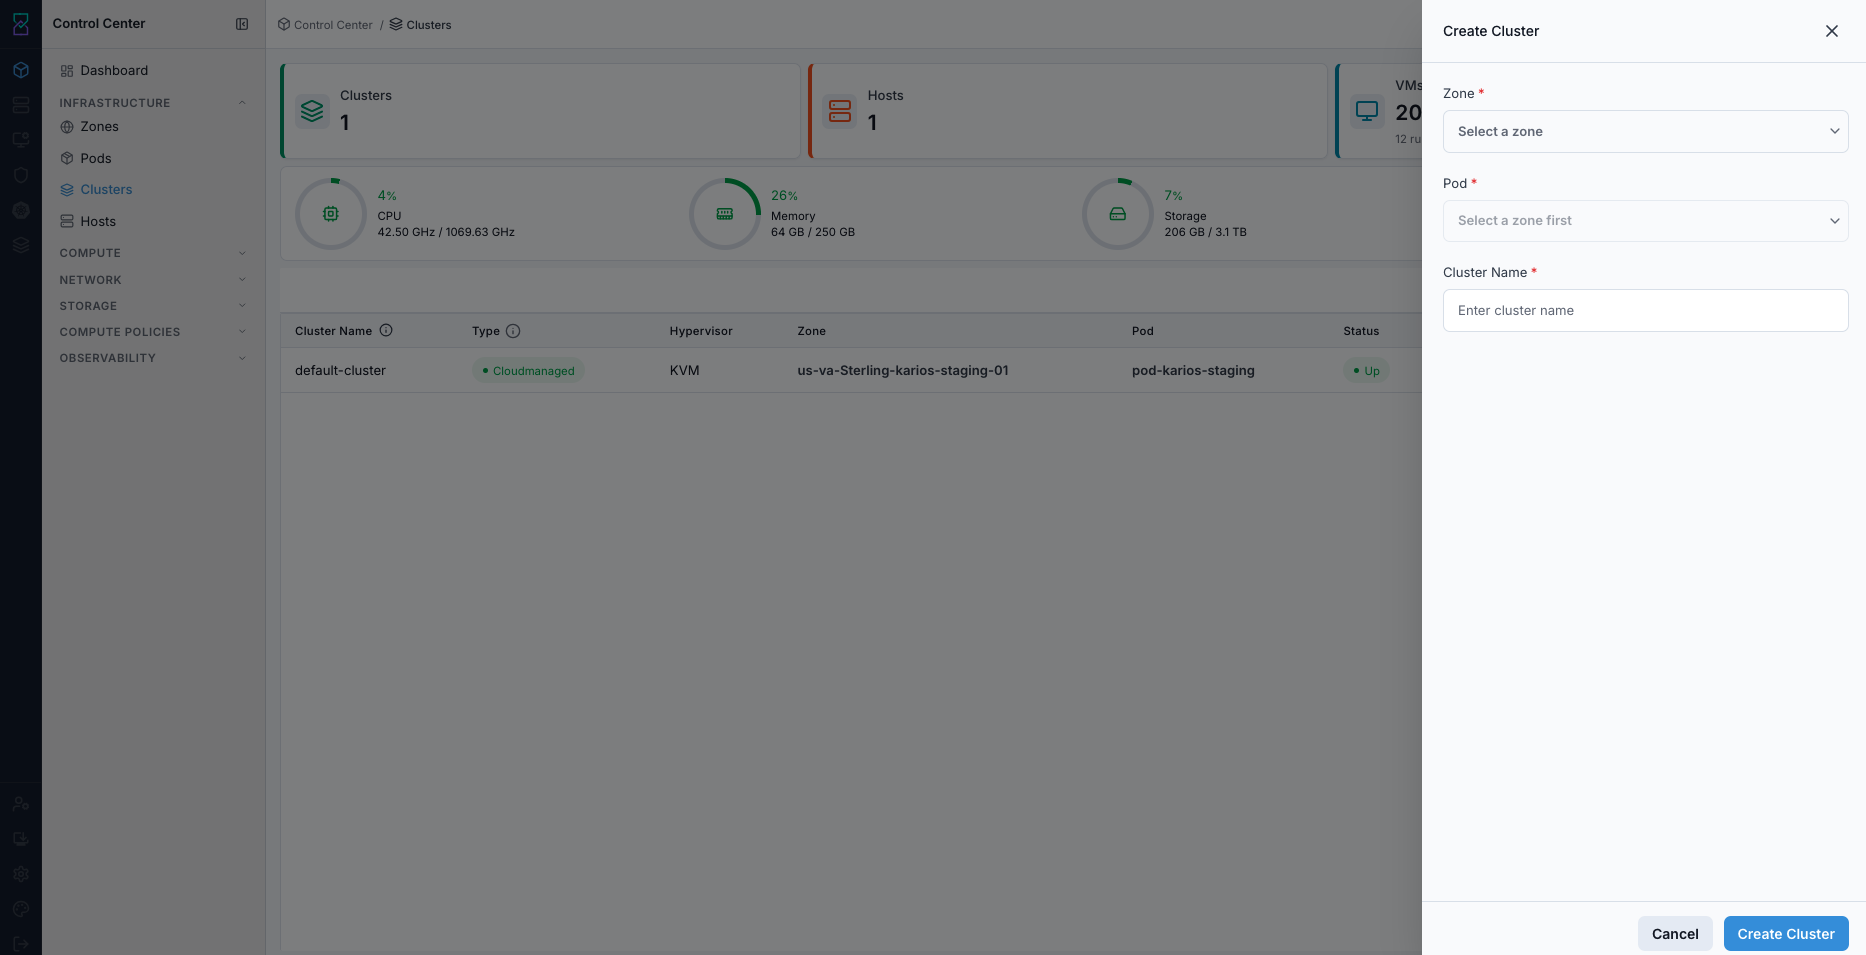
What this screenshot shows:
Right-side
Create ClusterdrawerRequired
Zone,Pod, andCluster NameinputsCreate Clustersubmit button at the bottom
Expected Outcome:
The cluster appears in the list with the selected zone/pod mapping.
Cluster details become available for validation and host onboarding.
A healthy cluster state confirms readiness for adding hosts.
How to verify:
Confirm the new cluster row appears in
Control Center -> Clusterswith correctZoneandPodvalues.Open cluster details and verify cluster status is healthy/
Up.Confirm the cluster is available for host onboarding.
If unavailable:
If
Create Clusteris not visible, verify role permissions.If
Podis unavailable in the form, verify an enabled pod exists in the selected zone.If creation fails, use Cluster Troubleshooting.
If this fails:
See Common screen checks before retrying this screen.
8.1. Access Cluster Help Page
When to Use:
Use this before cluster create/action updates when you need quick definitions for state, policy, or placement fields.
Purpose:
Context help reduces incorrect zone/pod mapping and action misuse in cluster operations.
Navigation:
Control Center -> Clusters
Steps:
Open the Clusters dashboard.
Click the page help icon in the top-right.
Search for terms such as
HA Enabled,Managed State, orAllocation State.Use inline info icons beside headings/labels where shown.
Expected Outcome:
You confirm cluster field behavior before create/edit/action operations.
Clusters table columns:
Column |
Description |
|---|---|
Cluster Name |
Cluster identifier. Select to open cluster details. |
Type |
Cluster management/orchestration model. |
Hypervisor |
Hypervisor technology used by hosts in the cluster. |
Zone |
Parent zone where the cluster is deployed. |
Pod |
Parent pod associated with the cluster. |
Status |
Cluster health state (for example, |
HA Enabled |
High availability state for the cluster. |
Managed State |
Cluster management mode (managed/unmanaged). |
Actions |
Row-level action menu for cluster operations. |
Status indicators:
Up: cluster healthy and available.Down: connectivity/resource issue requiring investigation.HA Enabled = Yes: failover protection active.HA Enabled = No: no HA protection for failure scenarios.
Tip
If Pod is empty, re-check that the selected zone has at least one enabled pod and that your RBAC scope includes that pod.
Warning
Do not proceed with cluster creation if zone/pod mapping is uncertain. Incorrect mapping will cause host onboarding and VM placement issues in downstream infrastructure steps.
If this fails:
See Common screen checks before retrying this screen.
8.2. Cluster Detail (Single Cluster View)
The Cluster Detail page gives a complete view of one cluster. Use it to inspect identity/configuration, monitor cluster metrics, confirm HA status visibility, and perform cluster-level actions.
When to Use:
Use this after cluster creation, during health checks, or before host/workload changes.
Purpose:
Cluster details provide the authoritative view for placement mapping, HA state, overcommit settings, and attached host readiness.
Path:
Control Center -> Clusters -> <cluster name>
Steps:
Open
Control Center -> Clusters.Select the target cluster row or use
View Detailsfrom the rowActionsmenu.The cluster details page opens for that specific cluster.
Expected Outcome:
You validate cluster readiness and configuration before taking downstream host or workload actions.
What you see first:
Cluster summary cards and configuration details for the selected cluster.
Section-level actions and detail areas (identity, configuration, metrics, and hosts).
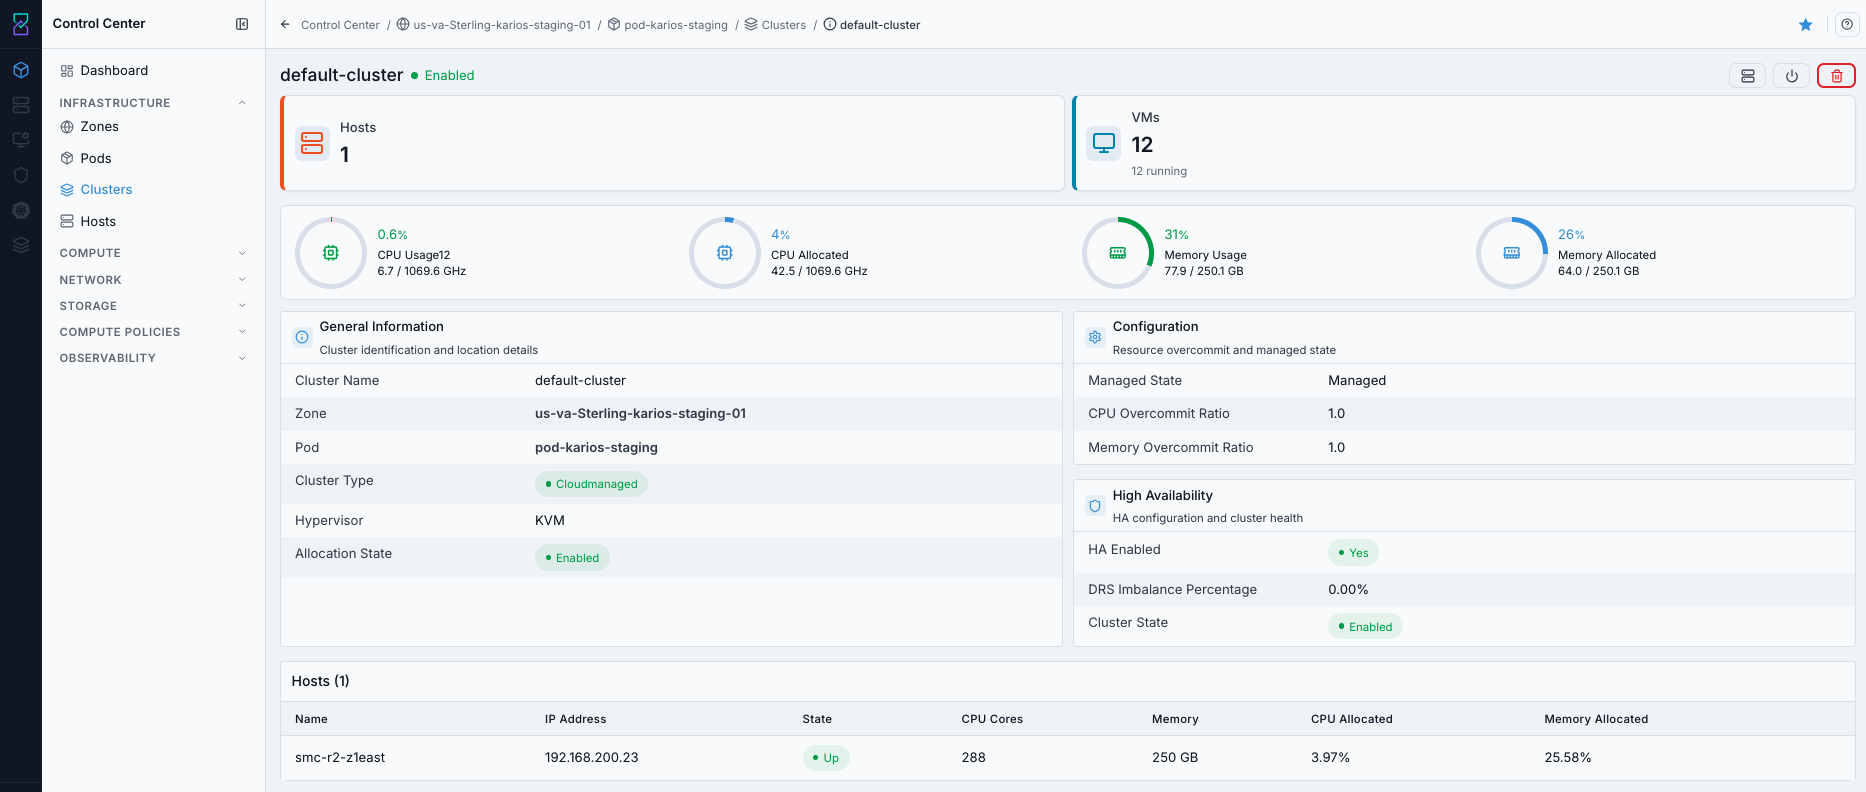
What this screenshot shows:
Cluster type, hypervisor, and zone/pod placement details
Cluster status/readiness context for host onboarding
HA state, overcommit settings, and DRS imbalance visibility on the detail page
If this fails:
See Common screen checks before retrying this screen.
8.2.1. Detail Cards Overview
The detail page is organized into four primary information areas plus a hosts table for attached capacity.
First 60-second new-user check:
Confirm
ZoneandPodare the intended target.Confirm
StateandAllocation Stateare enabled for workload placement.Confirm
Hostscount is non-zero before planning workload onboarding.Confirm
HA Enabledis shown as active/default.Scan DRS imbalance for obvious distribution issues before adding new VMs.
General Information
Displays cluster identification and location details.
Field |
Description |
|---|---|
Cluster Name |
Unique cluster identifier. |
Zone |
Geographic/logical zone where the cluster is deployed. Click to open zone details. |
Pod |
Pod inside the selected zone. Click to open pod details. |
Cluster Type |
Management type (for example |
Hypervisor |
Underlying virtualization technology (for example KVM, VMware, Hyper-V). |
Allocation State |
Resource allocation state ( |
Tips:
Use Zone and Pod links to validate placement in the infrastructure hierarchy.
Hypervisor type determines VM compatibility and operational behavior.
Set allocation state to disabled during planned maintenance when you need to block new placements.
Configuration
Displays cluster configuration and resource management settings.
Field |
Description |
|---|---|
Managed State |
Cluster management mode (for example |
CPU Overcommit Ratio |
Allowed CPU overcommit level. Higher values can increase VM density per physical core. |
Memory Overcommit Ratio |
Allowed memory overcommit level. Higher values can increase VM density per available memory. |
Tips:
Overcommit ratios directly influence workload density and contention risk.
Higher ratios can improve utilization but can reduce performance under heavy load.
Tune overcommit values based on workload profile and SLA targets.
Re-check cluster performance after any overcommit ratio change.
Starter baseline (new environments):
Production-critical workloads: start conservative (for example, CPU
1.0-2.0and Memory1.0) and increase only after performance validation.General mixed workloads: start moderate (for example, CPU
2.0-4.0and Memory1.0-1.5), then tune using observed utilization.Test/dev workloads: higher overcommit can be acceptable if performance variability is tolerated.
Warning
Baselines are starting points only. Always align final values with SLA, host capacity, and real workload telemetry.
Other Metrics
Displays additional operational and balancing indicators.
Field |
Description |
|---|---|
Hosts |
Number of physical hosts in the cluster (shown as |
DRS Imbalance Percentage |
Distribution imbalance percentage indicating how evenly VMs are spread across hosts. |
State |
Overall cluster operational state (for example |
Tips:
Monitor host count to understand current capacity and redundancy.
Lower DRS imbalance indicates better workload distribution.
Persistent high imbalance can indicate consolidation pressure or scheduling skew.
Use these metrics for migration planning and capacity optimization.
High Availability
Displays HA protection state and readiness.
Field |
Description |
|---|---|
HA Enabled |
Shows HA proxy status. This is expected to remain enabled by default. |
Tips:
HA is enabled by default in new environments.
Some environments expose HA controls in the cluster actions menu; others keep HA policy locked by role.
Confirm redundant infrastructure (hosts, storage, network paths) for effective failover behavior.
Test failover behavior regularly for critical workloads.
Verify workloads can restart on healthy nodes as expected after planned failover testing.
8.2.2. General Cluster Detail Tips
Use breadcrumb navigation to return to the Clusters dashboard quickly.
Treat card values as read-first operational telemetry and use action/edit flows for changes.
Review detail metrics regularly to catch capacity constraints early.
Reassess overcommit settings periodically based on observed workload behavior.
Use cluster detail data to plan host additions and VM migration windows safely.
Expected Outcome:
Cluster appears in list with correct mapping
Cluster is healthy and ready for hosts
HA proxy state is visible as active/default in cluster details
Do not proceed if:
Cluster remains unhealthy after creation
Cluster mapping (zone/pod/hypervisor) is incorrect
Tip
Use separate clusters for production and non-production workloads.
Next step:
Go to
Control Center -> Hostsand add/verify hosts for this cluster.
9. Hosts
Hosts are physical servers added into clusters. This is the final infrastructure step before VM creation. Each host must be reachable through BMC and discovered successfully by Karios to contribute capacity.
Create vs verify:
Verify existing hosts if current capacity is sufficient.
Add hosts only when scaling, replacing hardware, or onboarding a new cluster.
Open Hosts Dashboard
When to Use:
Use this when validating host readiness or before onboarding additional hardware.
Purpose:
Hosts are the final infrastructure layer before VM operations, and host health directly impacts workload stability.
Path:
Control Center -> Hosts
Steps:
Click the Control Center icon in the far-left rail.
Click
Hosts.The Hosts dashboard opens with host health/capacity columns and onboarding actions.
Expected Outcome:
You confirm host availability, utilization, and onboarding entry points before creating or migrating workloads.
What you see first:
Hosts table with state, CPU, and memory columns.
Add Hostaction and cluster filter controls.
Estimated time: 5-10 minutes per host
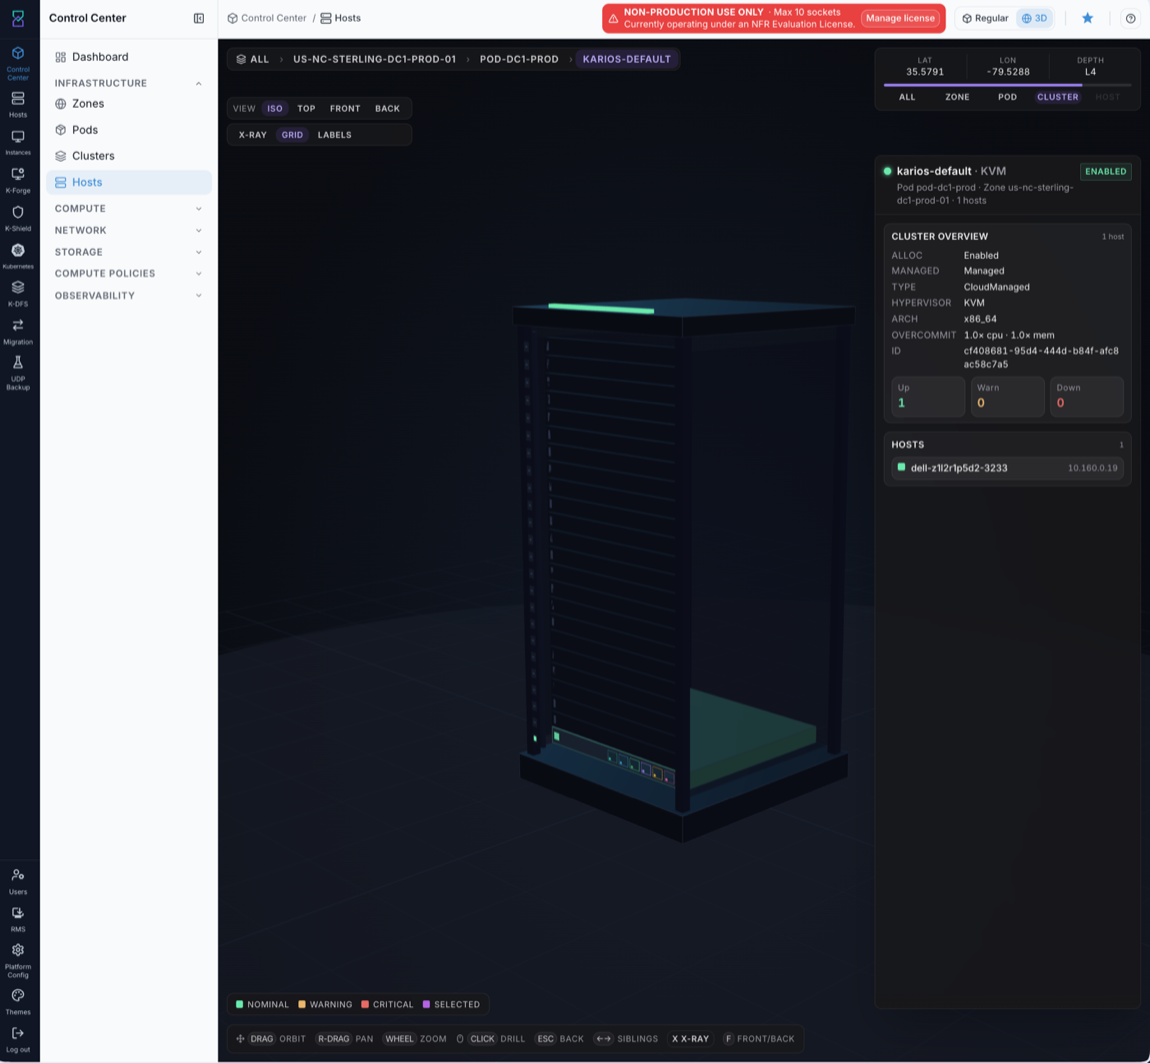
The 3D view of the same hosts is shown below.
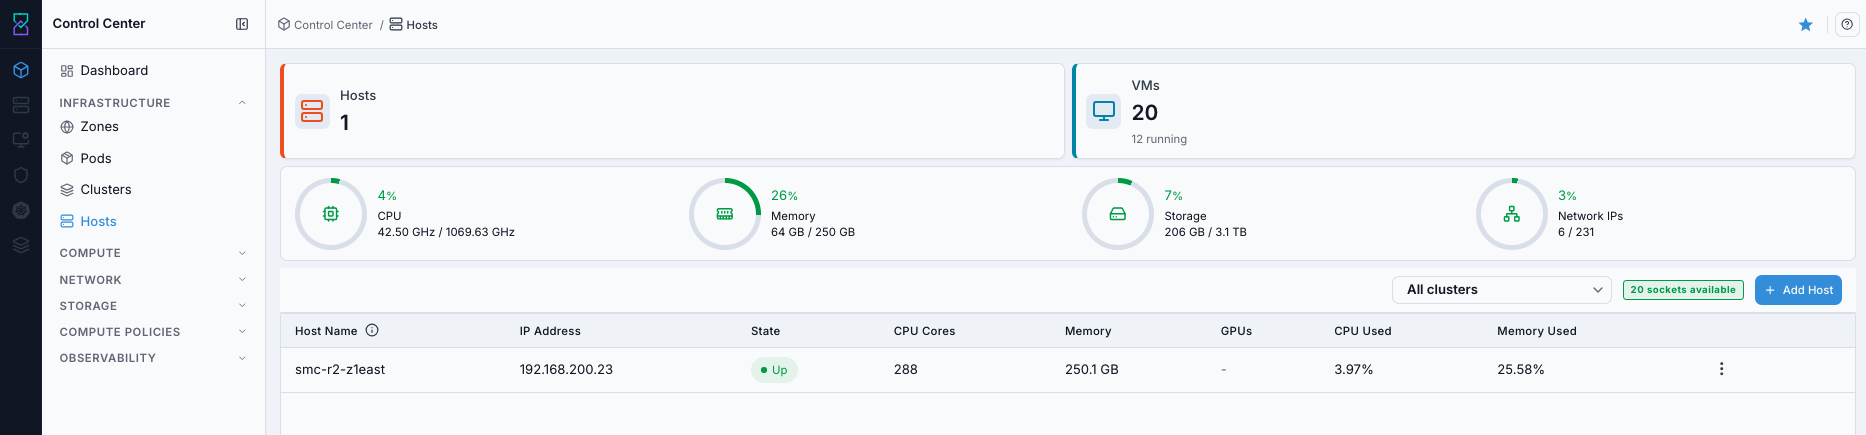
What this screenshot shows:
Host table with
IP Address,State,CPU Cores,Memory,CPU Used, andMemory UsedAll clustersfilter andAdd Hostbutton in the top-rightThe example host row is in
Upstate (workload-ready context)
If this fails:
See Common screen checks before retrying this screen.
Host Row Actions Entry Point
When to Use:
Use this when you need host-specific operations from the hosts list.
Purpose:
Row actions provide direct access to operational controls (enable/disable/maintenance/reconnect) without leaving the dashboard.
Steps:
Open
Control Center -> Hosts.Find the target host row.
Open the row
Actionsmenu.Select the required host operation.
Expected Outcome:
You trigger host-level operations quickly from the list view.
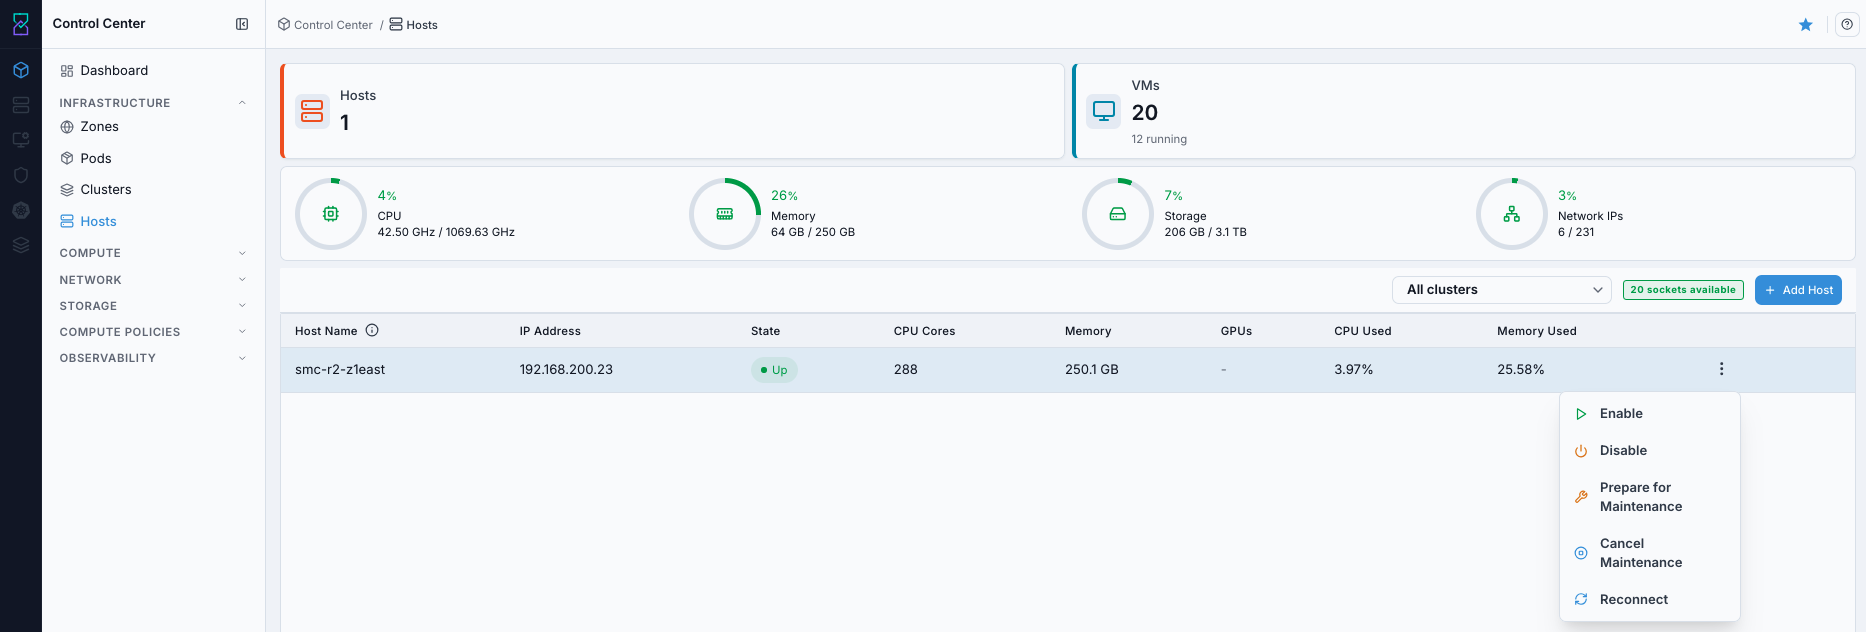
What this screenshot shows:
Row-level
Actionsmenu used for host-specific operations.Operational entry point for per-host management tasks.
If this fails:
See Common screen checks before retrying this screen.
Filter Hosts by Cluster
When to Use:
Use this when you need to isolate hosts for a specific cluster during onboarding, troubleshooting, or maintenance.
Purpose:
Filtering reduces operator error by limiting actions to the intended cluster scope.
Steps:
Open
Control Center -> Hosts.Open the
All clustersfilter.Select the required cluster name.
Review the filtered host list before taking actions.
Expected Outcome:
You work on the correct host set for the selected cluster.
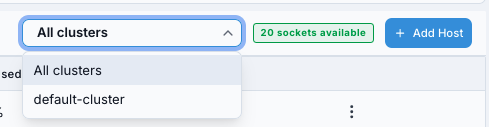
What this screenshot shows:
Cluster search/filter control for narrowing the hosts list by cluster.
Quick way to isolate hosts for one cluster during onboarding and troubleshooting.
Host table columns:
Column |
Description |
|---|---|
Host Name |
Unique host identifier. Select to open host details. |
IP Address |
Management-reachable host IP. |
State |
Operational host state. |
CPU Cores |
Total physical CPU cores available. |
Memory |
Total host memory capacity. |
CPU Used |
Current CPU utilization percentage. |
Memory Used |
Current memory utilization percentage. |
State meanings:
Up: host is healthy and workload-ready.Down: host is offline or unreachable.Disabled: host is intentionally disabled for new allocations.
Warning
Successful onboarding requires host state Up. Treat Alert, Down, or Disconnected as blocking states and resolve them before VM provisioning.
Action in this screen:
Review host health and capacity
Click
Add Hostto open the onboarding form
If this fails:
See Common screen checks before retrying this screen.
Add Host (When Required)
When to Use:
Perform this action when a cluster needs additional capacity, hardware replacement, or first-time compute onboarding.
Purpose:
Add a host when you need more compute capacity, are replacing hardware, or onboarding infrastructure into a new or existing cluster.
Navigation:
Control Center -> Hosts
Steps:
On the Hosts dashboard, click
Add Host.Enter location and hardware identity fields.
Enter BMC IP, username, password, and vendor.
Continue to
Reviewand validate inputs.Submit the host onboarding request.
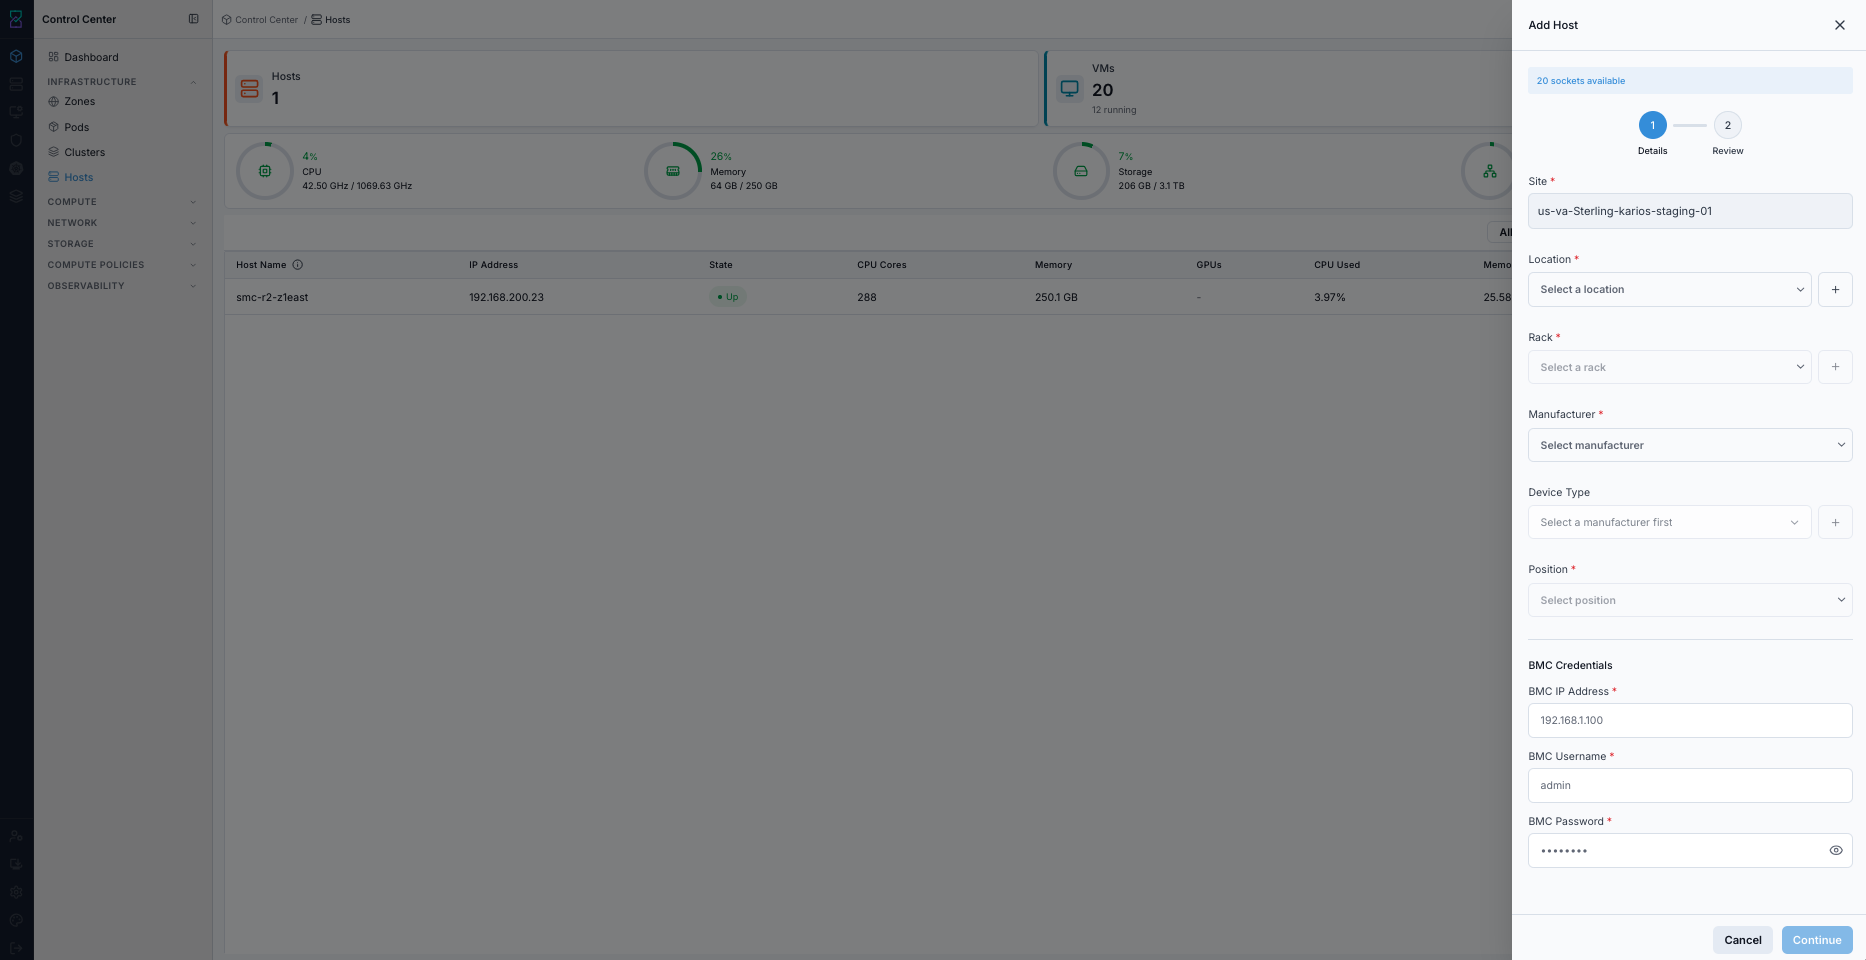
What this screenshot shows:
Stepper-based host onboarding (
DetailsthenReview)Required site/location/rack/manufacturer/device position inputs
BMC credential fields used for hardware discovery
Continuebutton to move into review before final submit
Expected Outcome:
The host record appears in the hosts list.
Discovery populates hardware and hypervisor details.
Host state transitions to
Upwhen connectivity and validation checks pass.
How to verify:
Confirm the host row appears in
Control Center -> Hosts.Open host details and verify CPU/memory/hypervisor values are populated.
Confirm host
Statetransitions toUp.
If unavailable:
If
Add Hostis not visible, verify role permissions.If submission fails, validate BMC IP reachability and credentials.
If onboarding remains unsuccessful, use Host Troubleshooting.
If this fails:
See Common screen checks before retrying this screen.
9.1. Access Host Help Page
When to Use:
Use this before onboarding/editing hosts when you need clarification for discovery and credential fields.
Purpose:
Help definitions reduce onboarding failures caused by incorrect site/location/BMC inputs.
Navigation:
Control Center -> Hosts
Steps:
Open the Hosts dashboard.
Click the page help icon in the top-right.
Search for fields such as
BMC IP,State, orCluster.Use inline info icons beside labels to verify expected values and format.
Expected Outcome:
You confirm host-input requirements before submission and reduce onboarding retries.
Add host steps (detailed input guide):
Enter location data (site/location/rack/position)
Enter hardware/manufacturer details
Enter BMC data:
BMC IP
BMC username
BMC password
BMC vendor
Enter optional device name if required by your internal naming policy
Click
Continueand review all valuesSubmit the host from the
Reviewstep
Expected Behavior
Typical host onboarding timeline:
0:00 - Host record is created in the list
0:30-2:00 - Discovery populates hardware details (CPU/RAM/hypervisor)
2:00-5:00 - State transitions to
Upwhen connectivity and checks pass
If host remains Down or Disconnected beyond 5 minutes, verify BMC IP reachability and credentials first.
If this fails:
See Common screen checks before retrying this screen.
9.2. Access Host Details Page
When to Use:
Use this after host onboarding or during host-health troubleshooting.
Purpose:
Host details confirms discovered hardware, hypervisor, and OS metadata needed for workload placement decisions.
Navigation:
Control Center -> Hosts
Steps:
Open the Hosts dashboard.
Click the target host row (
Host Name) to open host details.Review identification, hypervisor, CPU/memory, and OS cards.
Confirm host state and discovered values are valid.
Expected Outcome:
You confirm the host is ready for workload placement and ongoing operations.
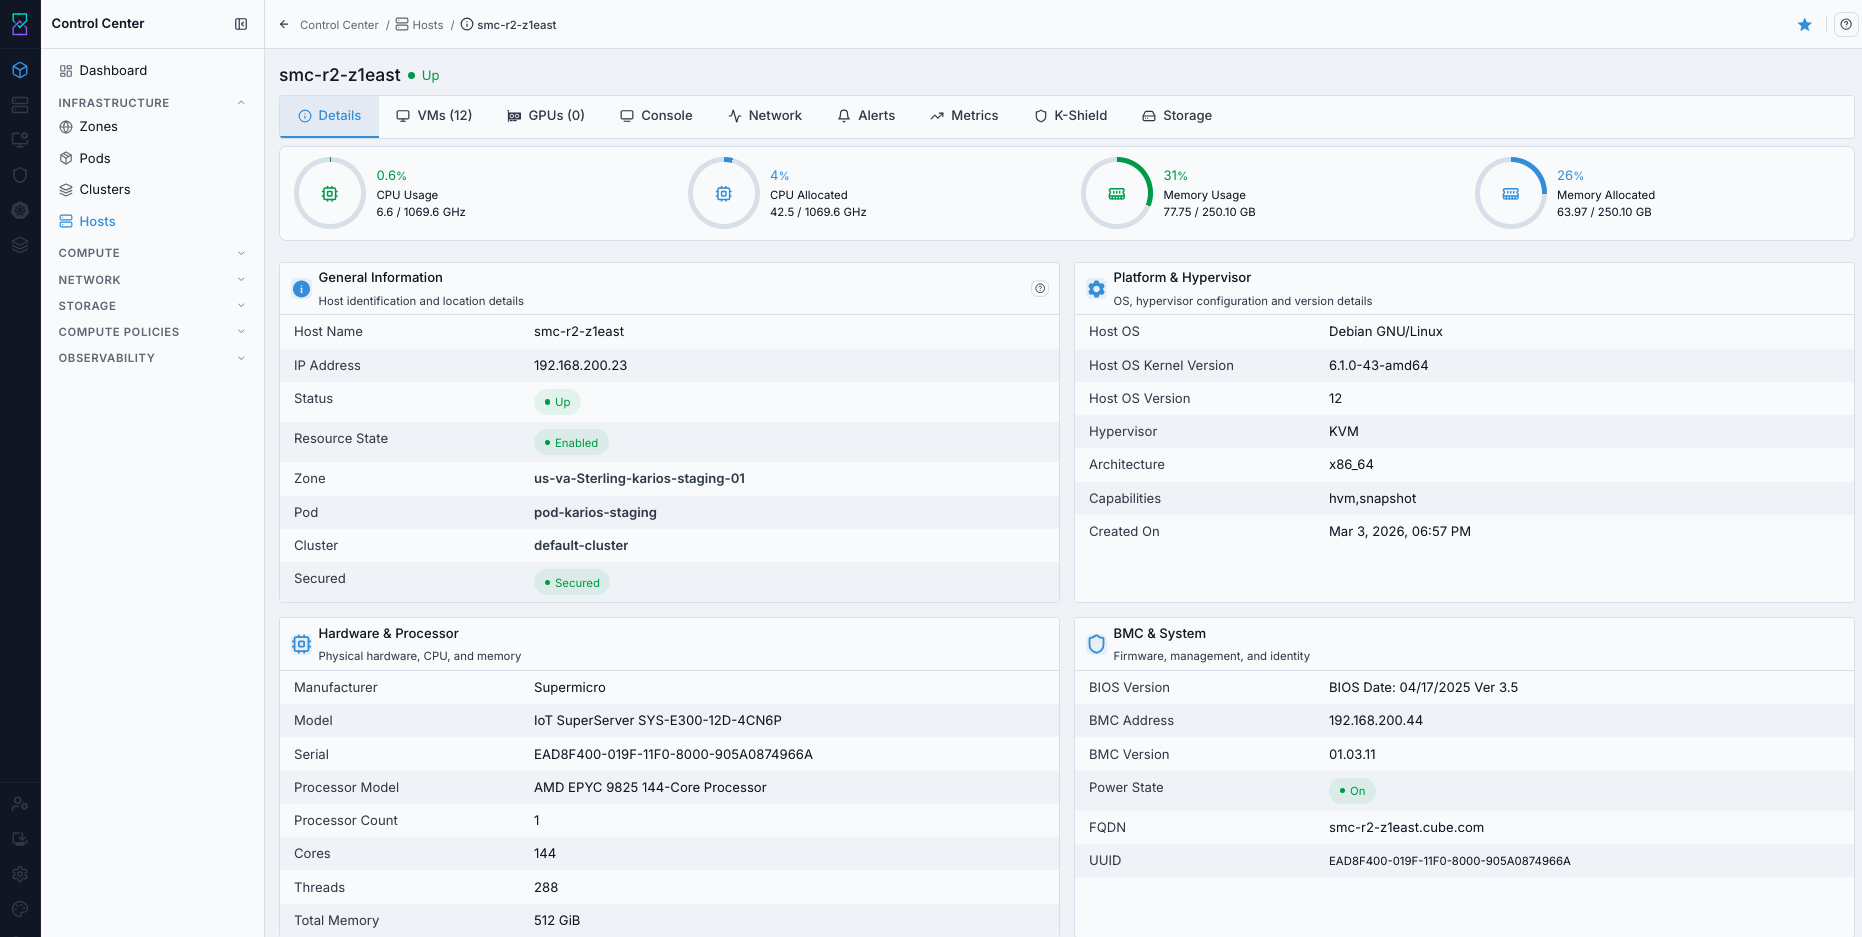
What this screenshot shows:
Host detail cards for general identification, hypervisor details, CPU/memory allocation, and OS metadata.
Direct validation view for onboarding completeness and host readiness.
What you can find:
Host state, role/type, hypervisor, CPU/memory visibility
Common host tasks:
Open host details for configuration and telemetry checks.
Review CPU and memory utilization before placing additional workloads.
Investigate non-
Upstates before VM provisioning.
If this fails:
See Common screen checks before retrying this screen.
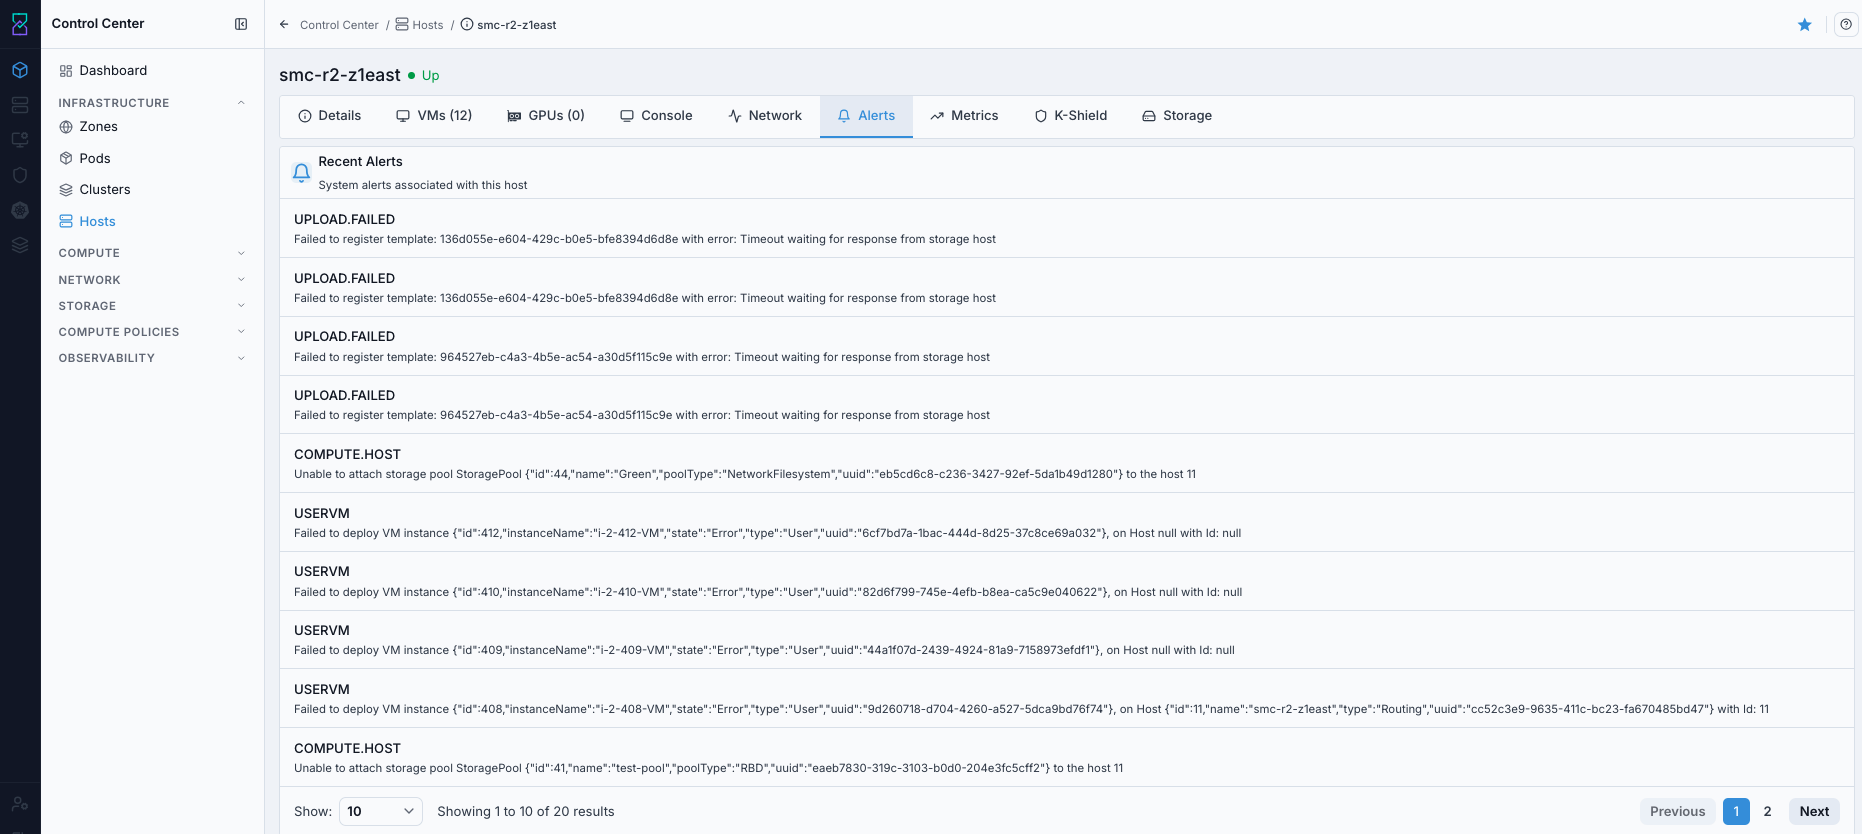
9.3. Access Host Alerts Tab
When to Use:
Use this when host-level warnings or health events must be reviewed.
Purpose:
Alerts identify host conditions that can block placement or require immediate remediation.
Navigation:
Control Center -> Hosts -> <host name> -> Alerts
Steps:
Open the host details page.
Select the
Alertstab.Review active alerts, severity, and timestamps.
Expected Outcome:
You identify host issues and can prioritize remediation before workload changes.
If this fails:
See Common screen checks before retrying this screen.
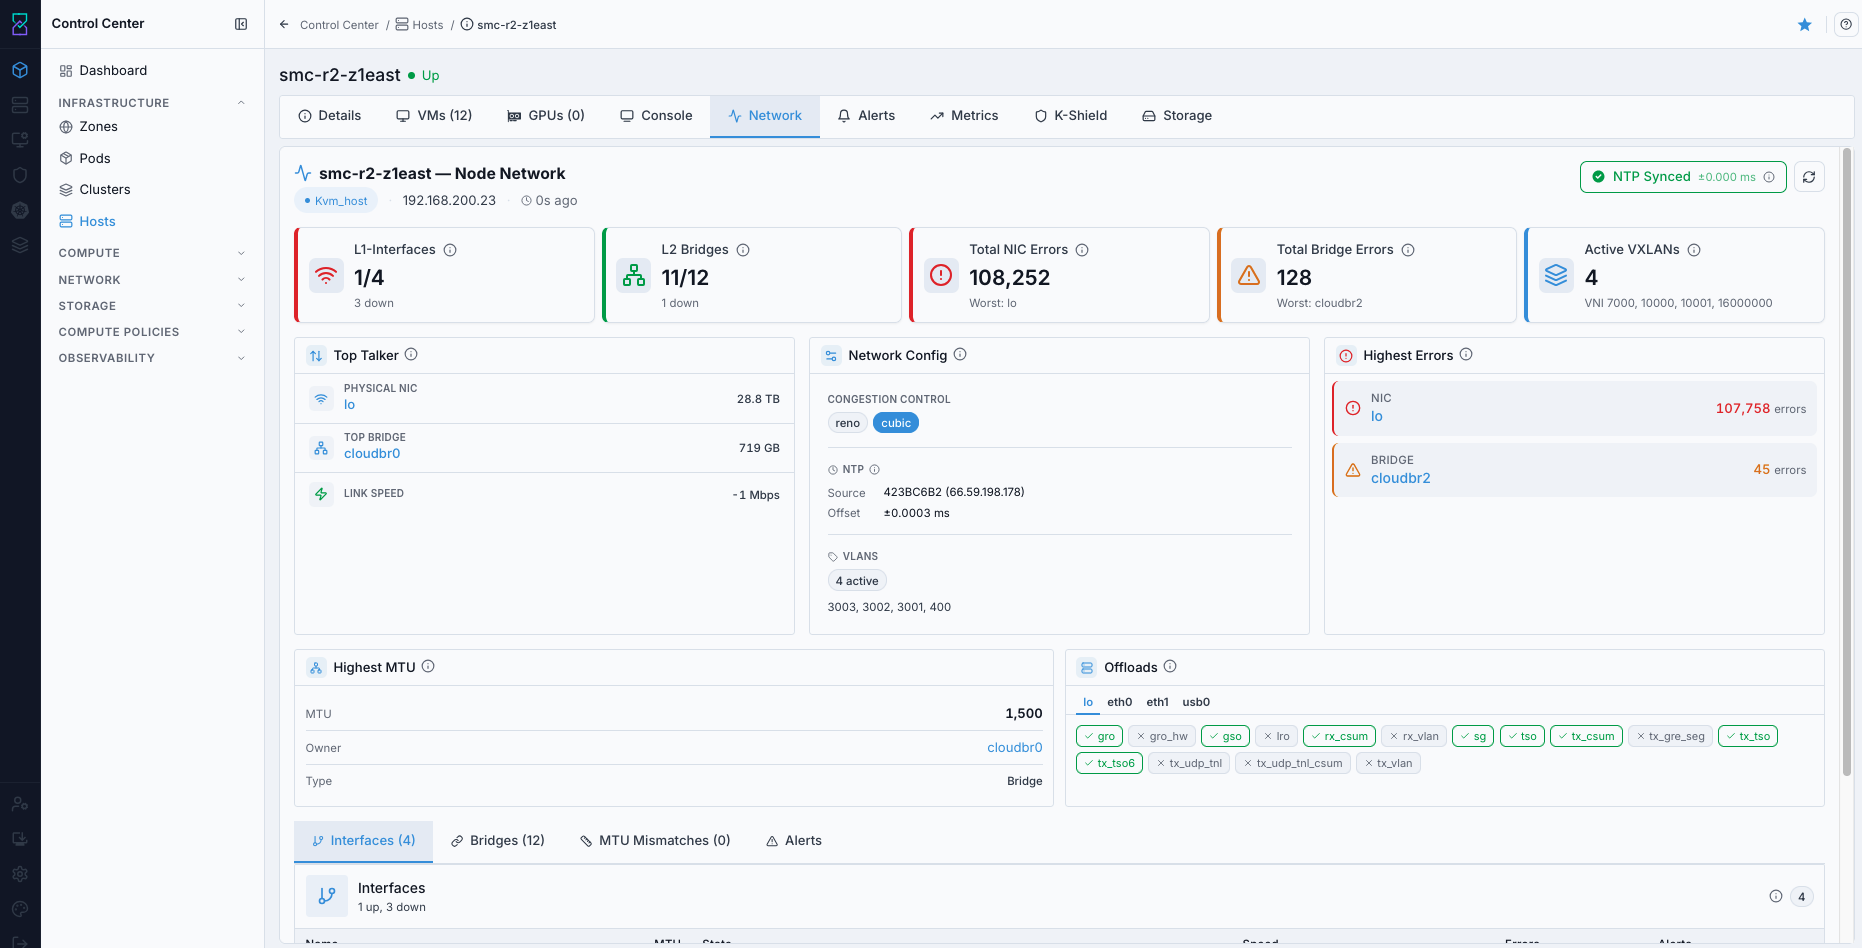
9.4. Access Host Network Tab
When to Use:
Use this to validate network interfaces and host network connectivity details.
Purpose:
Network tab checks help prevent VM connectivity issues and host communication failures.
Navigation:
Control Center -> Hosts -> <host name> -> Network
Steps:
Open host details.
Select
Network.Review interface/state details and expected network values.
Expected Outcome:
You confirm host network readiness for VM operations.
If this fails:
See Common screen checks before retrying this screen.
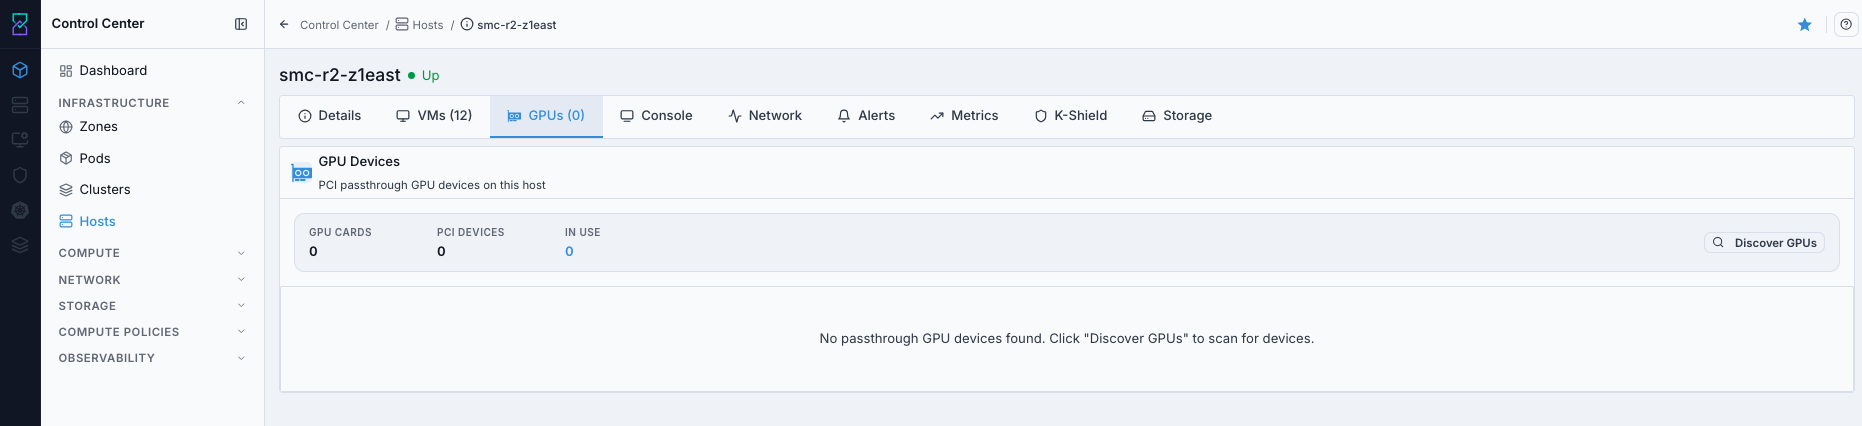
9.5. Access Host GPU Tab
When to Use:
Use this when planning or validating GPU-capable workloads.
Purpose:
GPU visibility confirms accelerator inventory and availability per host.
Navigation:
Control Center -> Hosts -> <host name> -> GPUs
Steps:
Open host details.
Select
GPUs.Verify detected GPU devices and current assignment state.
Expected Outcome:
You confirm whether the host can support GPU-backed VM workloads.
If this fails:
See Common screen checks before retrying this screen.
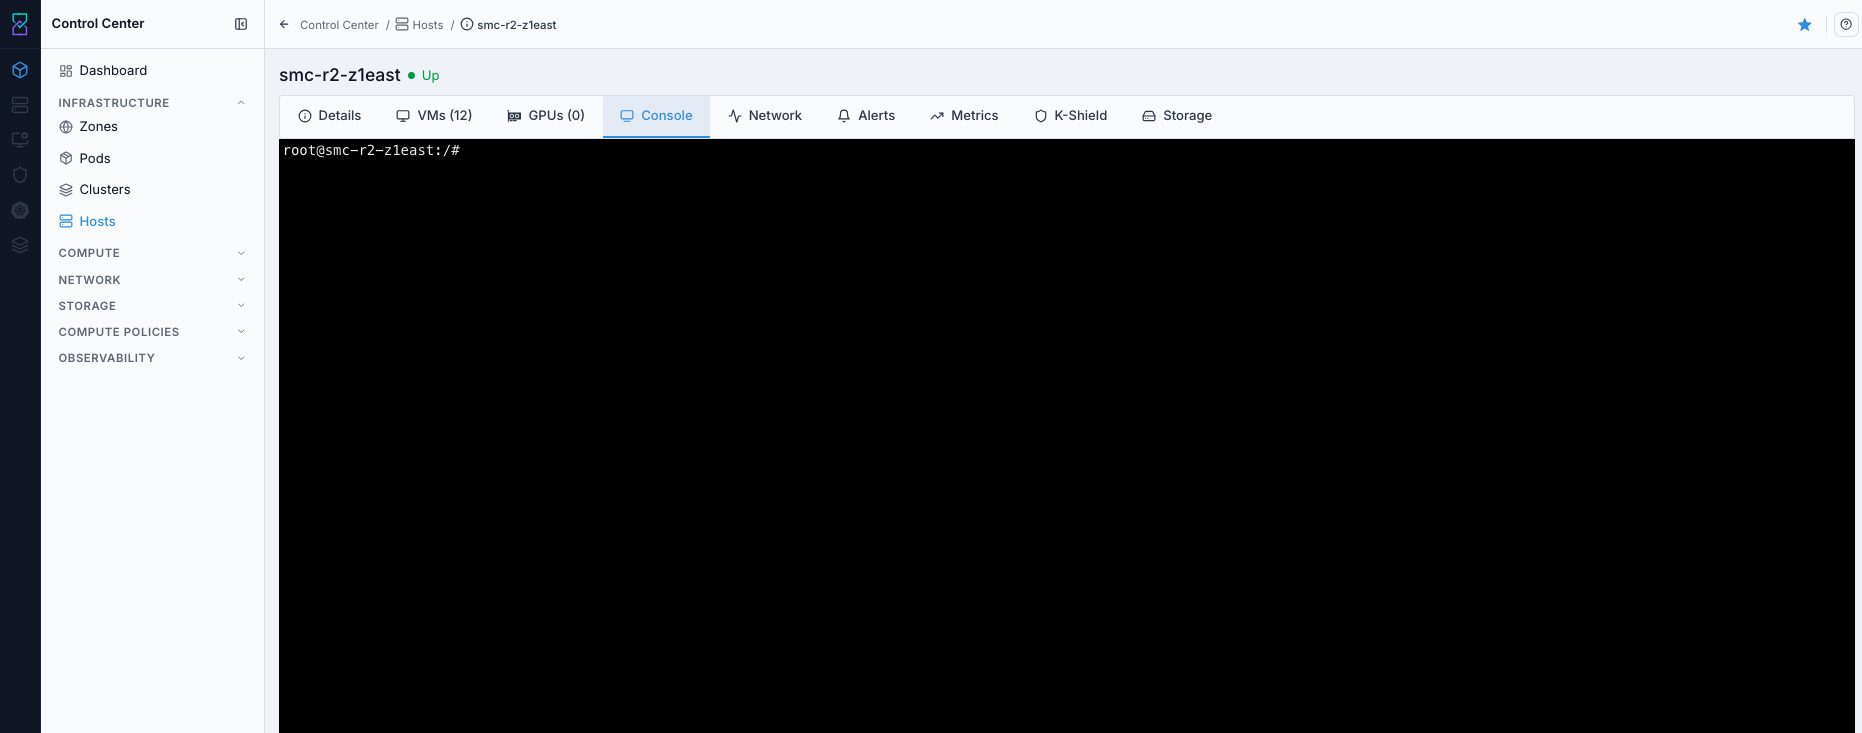
9.6. Access Host Console Tab
When to Use:
Use this during deeper troubleshooting when direct host console access is required.
Purpose:
Console access supports low-level diagnostics when UI-level checks are insufficient.
Navigation:
Control Center -> Hosts -> <host name> -> Console
Steps:
Open host details.
Select
Console.Launch and use console access per your operational policy.
Expected Outcome:
You can perform direct host inspection/troubleshooting where permitted.
If this fails:
See Common screen checks before retrying this screen.
9.7. Access Host Metrics Tab
When to Use:
Use this to inspect host metrics before scaling or maintenance actions.
Purpose:
Metrics help confirm host load profile and detect resource pressure early.
Navigation:
Control Center -> Hosts -> <host name> -> Metrics
Steps:
Open host details.
Select
Metrics.Review host utilization metrics.
Expected Outcome:
You get host-level metrics context for capacity and incident decisions.
Note
A dedicated Metrics tab screenshot will be available in the next release.
If this fails:
See Common screen checks before retrying this screen.
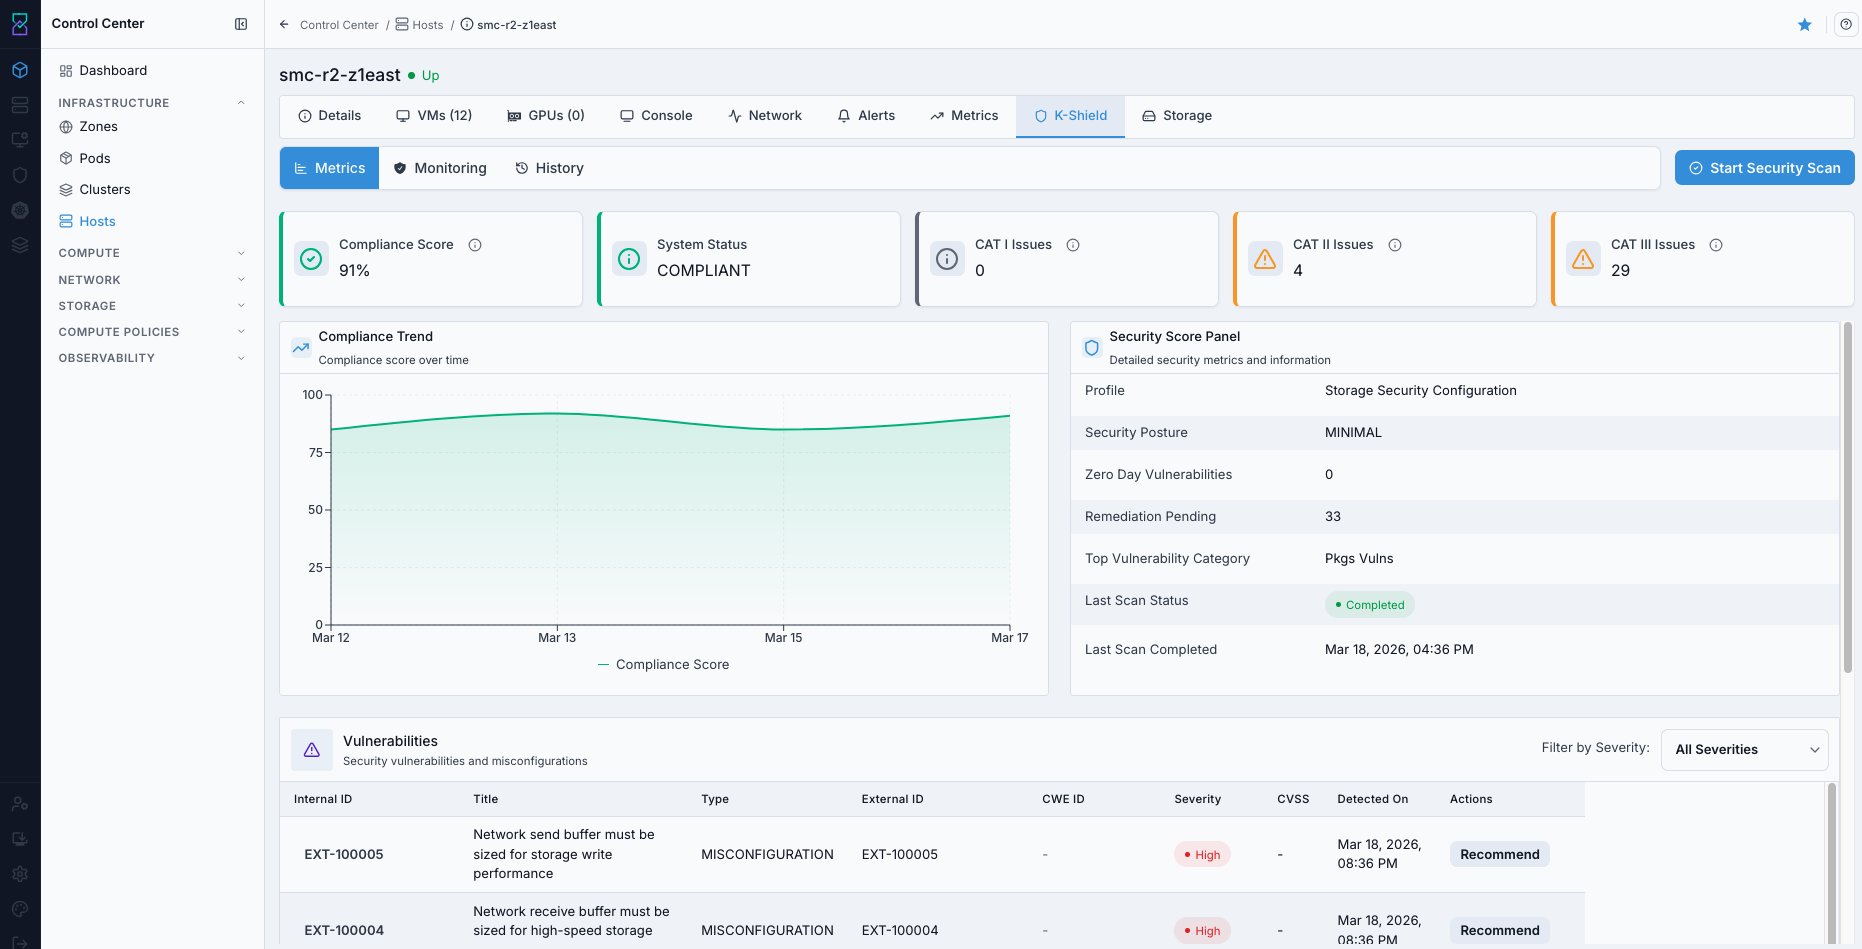
9.8. Access Host Karios Shield Tab
When to Use:
Use this for host security posture review and security-related follow-up checks.
Purpose:
Karios Shield data provides host-level security insight needed for risk-based operations.
Navigation:
Control Center -> Hosts -> <host name> -> Karios Shield
Steps:
Open host details.
Select
Karios Shield.Review host security status/findings.
Expected Outcome:
You validate security status before maintenance or workload placement changes.
If this fails:
See Common screen checks before retrying this screen.
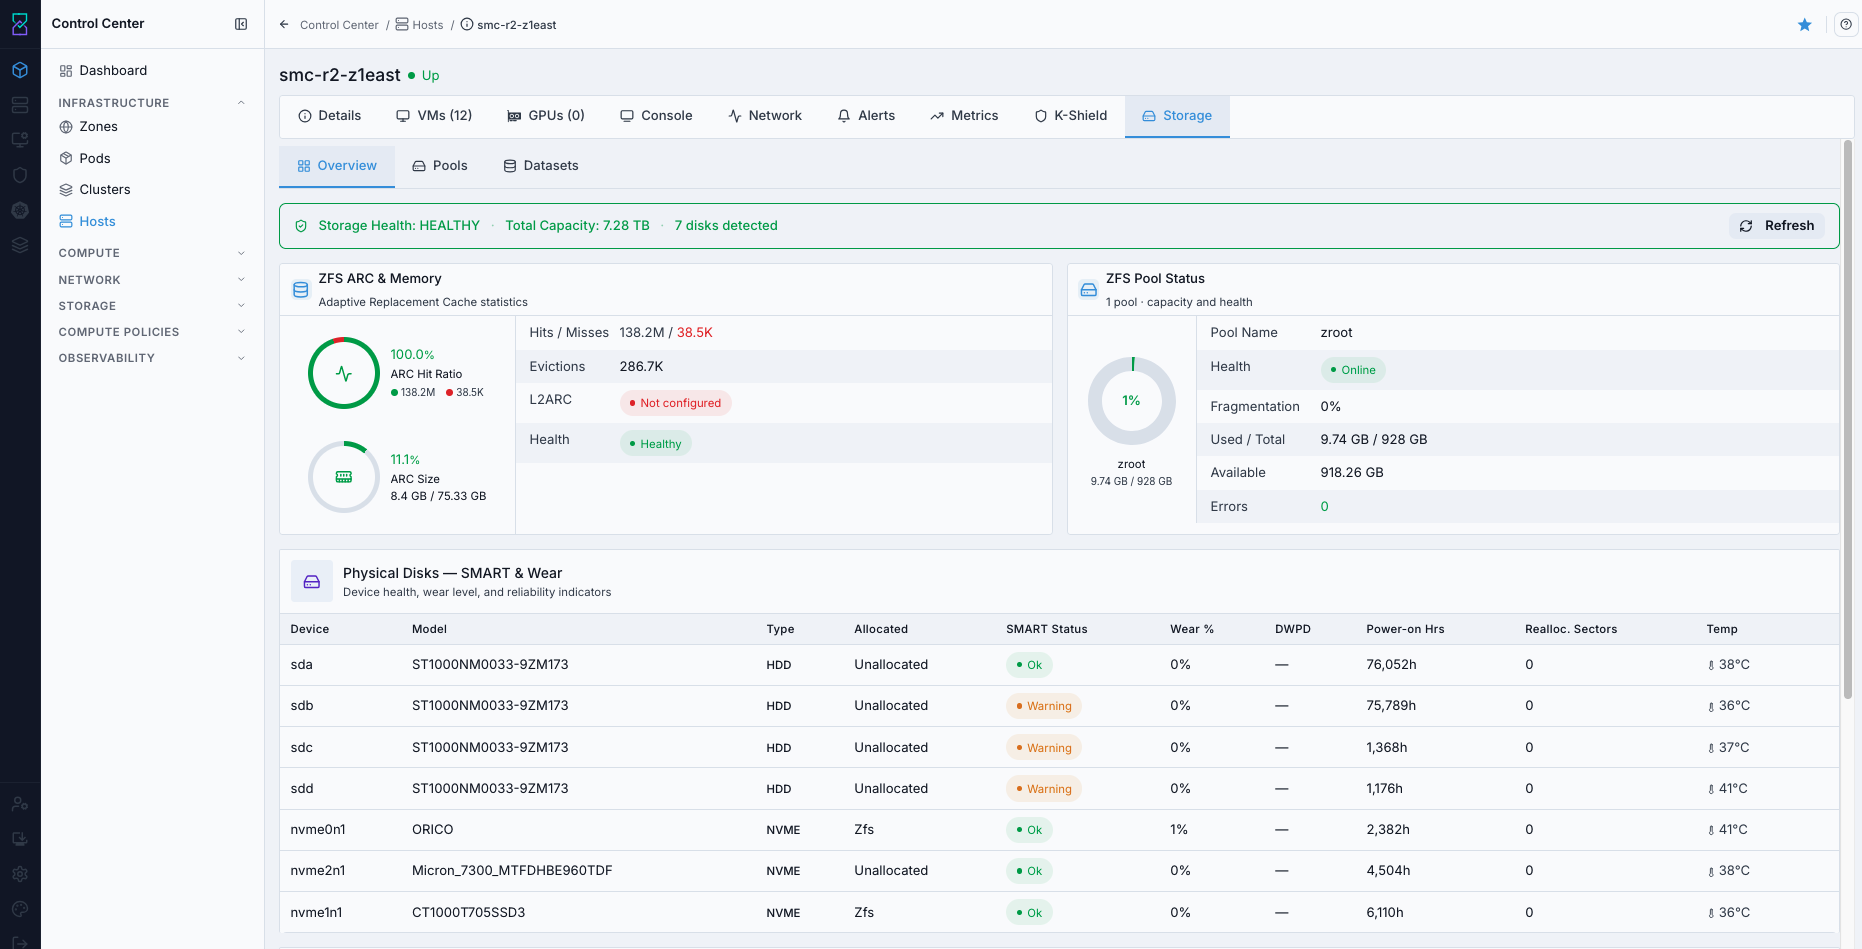
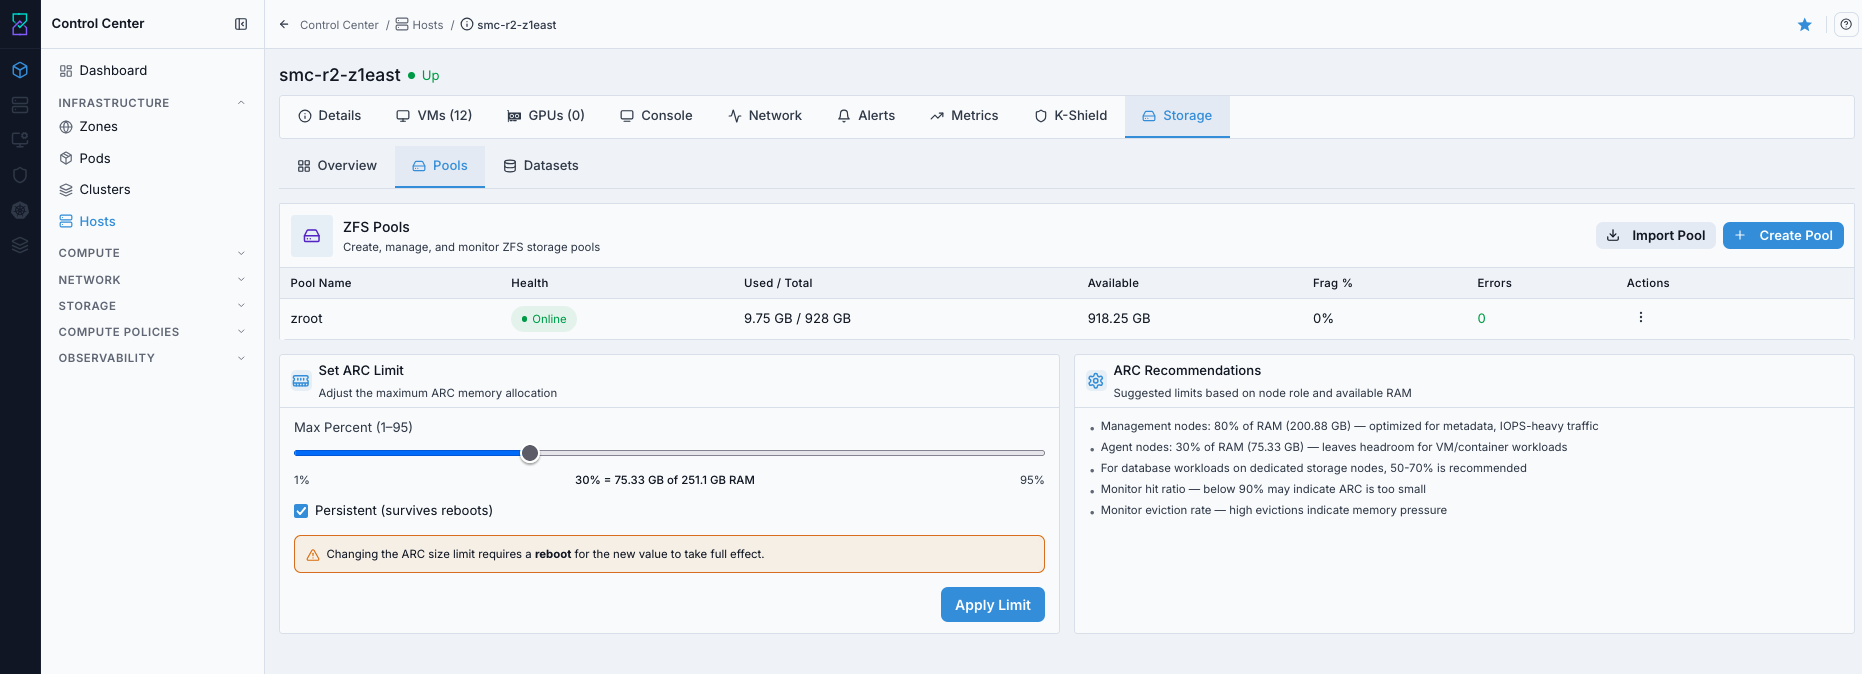
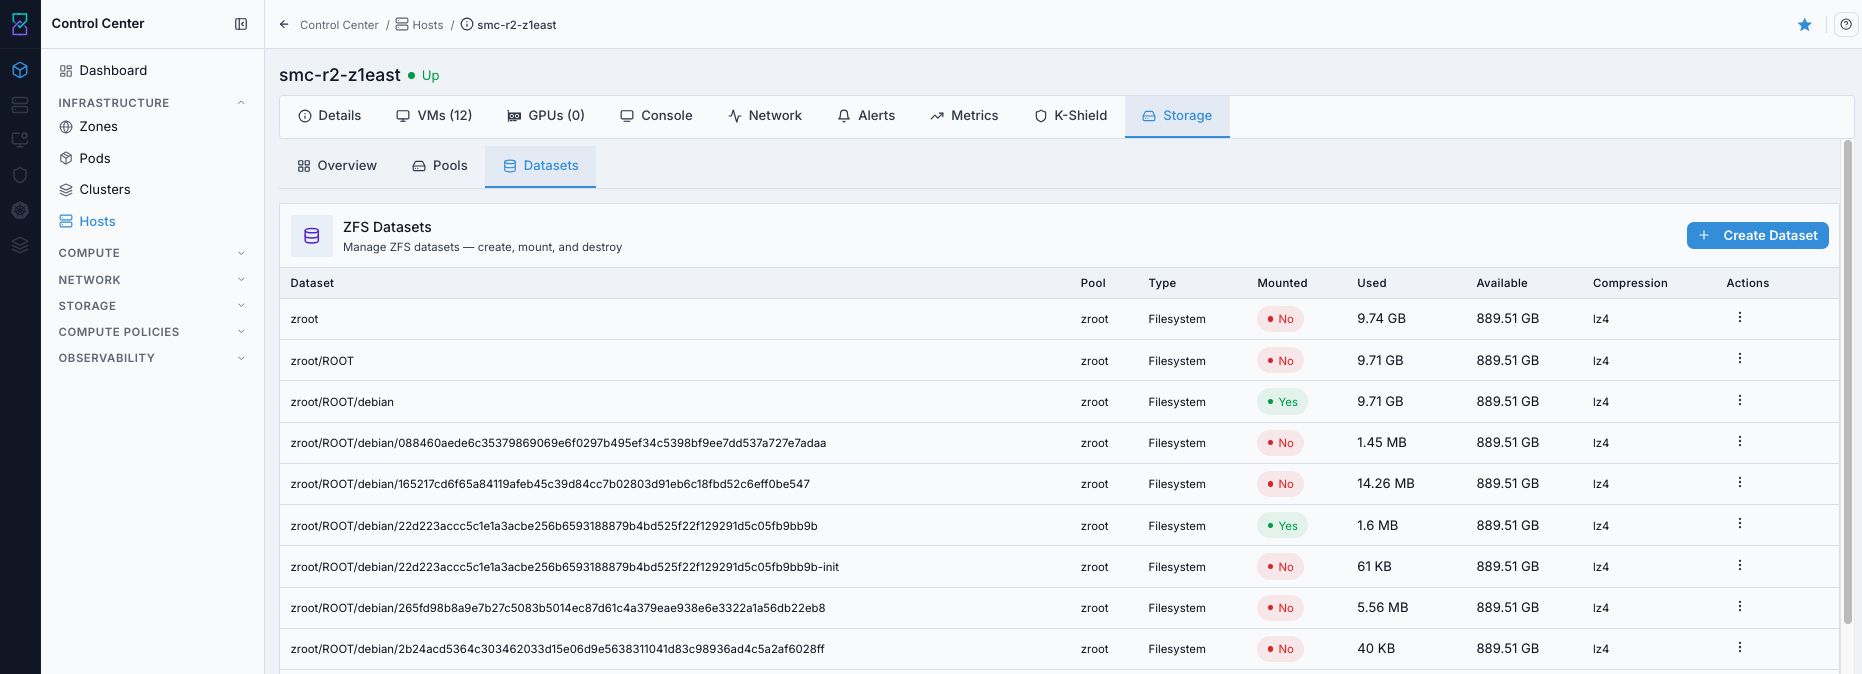
9.9. Access Host Storage Tabs
When to Use:
Use this to inspect host-local storage state and dataset/pool context.
Purpose:
Storage-tab checks help confirm storage readiness and identify capacity/layout issues.
Navigation:
Control Center -> Hosts -> <host name> -> Storage
Steps:
Open host details.
Select
Storage.Review
Overview,Pools, andDatasetstabs.
Expected Outcome:
You validate storage configuration and capacity context at host level.
If this fails:
See Common screen checks before retrying this screen.
9.10. Access Host VM Details Tab
When to Use:
Use this to verify which virtual machines are currently placed on a host.
Purpose:
VM details on the host page help validate placement, investigate host load, and identify impacted VMs during host incidents.
Navigation:
Control Center -> Hosts -> <host name> -> VMs
Steps:
Open
Control Center -> Hosts.Open the target host details page.
Click the
VMsdetails tab.Review VM name/state information for that host.
Expected Outcome:
You can confirm host-to-VM mapping and use it for troubleshooting or maintenance planning.
For newly onboarded hosts, an empty VMs tab is expected until VMs are deployed or migrated to that host.
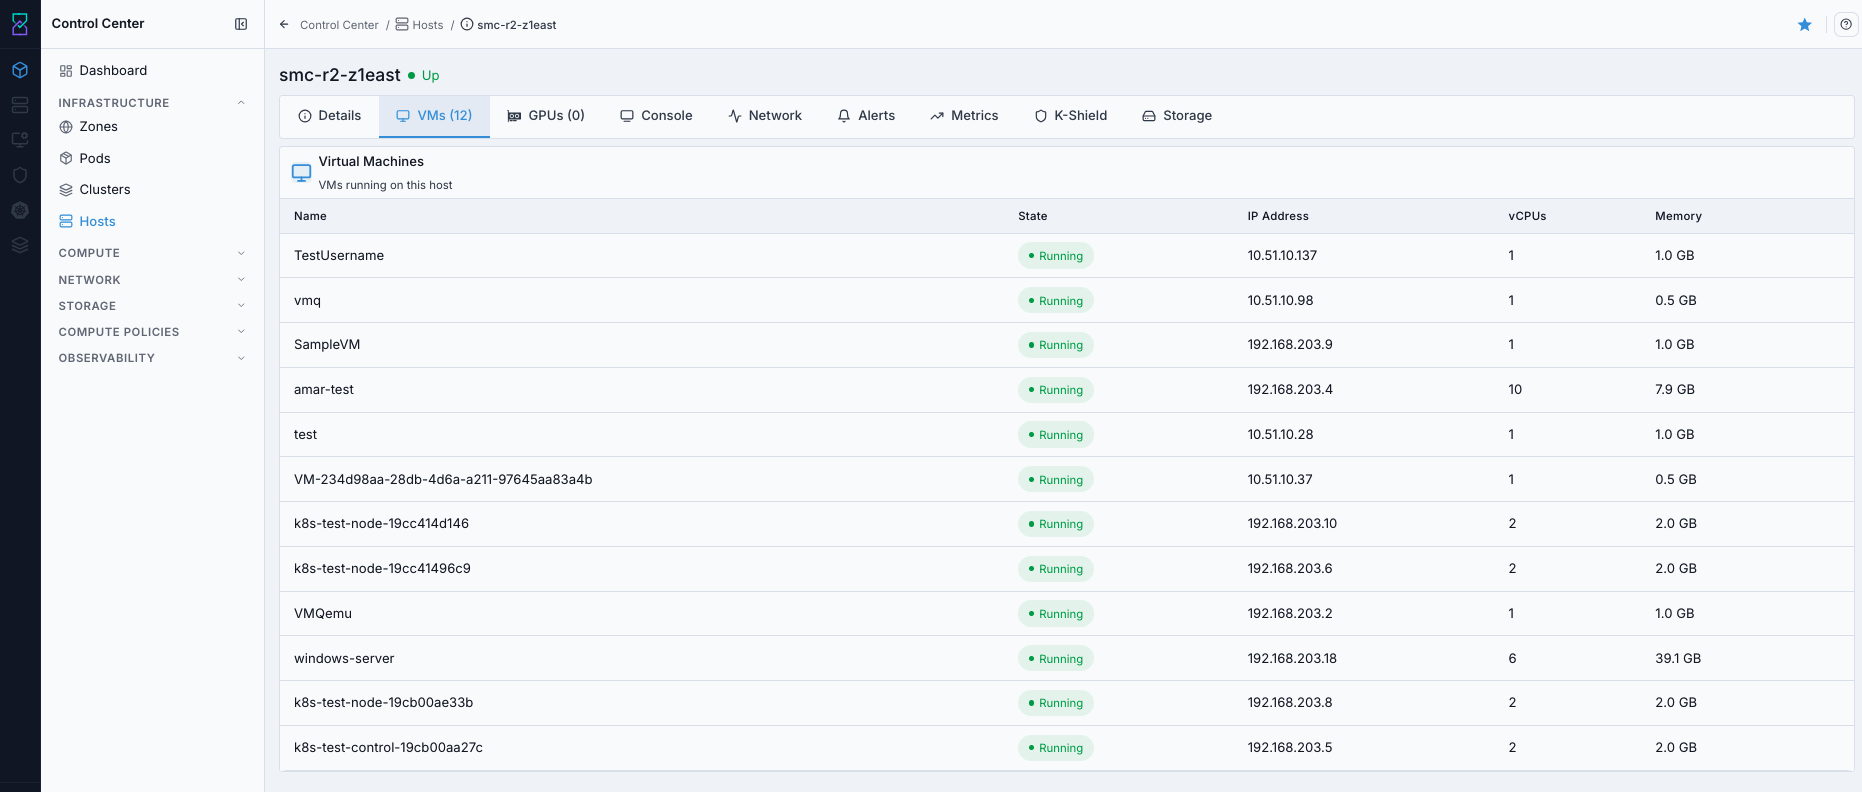
What this screenshot shows:
Host details
VMstab with VM entries associated to the selected hostDirect view of VM placement context used for host-level operations
This screenshot is a populated example; your host can show no VM rows, which is normal for a new host.
Empty state behavior:
If the host is newly added and you have not deployed/migrated VMs yet,
No virtual machines found(or an empty list) is expected behavior.This is not a host onboarding failure by itself.
If you expected VMs but the list is empty:
Confirm VMs were created in
Compute -> Virtual Machines.Confirm placement/migration targeted this host’s cluster.
Refresh host details and re-check the
VMstab.
Expected Outcome:
Host appears in list
Host state moves to
UpCapacity details are discovered
Host ready-for-workload checklist:
Host is mapped to correct zone/pod/cluster
Hypervisor is detected correctly
CPU and memory values are visible
Host state is
Upand not in maintenance/disabled stateParent cluster status is healthy
Do not proceed if:
Host state remains
DownorDisconnectedHost state is
AlertHypervisor/capacity values are missing
Warning
Incorrect BMC IP/credentials is the most common host onboarding failure.
Next step:
Run the final validation checklist in Section 10, then continue to
Compute -> Virtual Machines.
If this fails:
See Common screen checks before retrying this screen.
10. Final Validation
Run this checklist before moving to the VM workflow:
Dashboard cards visible and not all zero
Zone exists and enabled
Pod exists under correct zone
Cluster exists under correct pod
Host is added and healthy (
Up)Zone, pod, cluster, and host details pages open without errors
Warning
If any checklist item fails, stop here and use the troubleshooting sections below before moving to VM provisioning.
If all pass, Infrastructure is ready.
Success path summary:
Dashboard healthy
Zone enabled
Pod enabled with valid IP range
Cluster healthy with correct mapping
Host
Upwith visible capacity
When all of the above are true, proceed to the Compute -> Virtual Machines section.
11. Safe Correction (If You Created Something in the Wrong Place)
If you created objects in the wrong scope:
Stop and confirm what is wrong (zone, pod, cluster, or host mapping).
Do not proceed to VM deployment until corrected.
For pod/cluster mistakes, create the correct object first, then remove the incorrect one.
For host mistakes, reassign or re-onboard host into the correct cluster path.
Re-run the final validation checklist before continuing.
Warning
Delete actions should be done only after confirming no dependent workloads are attached. Never delete a cluster that still has attached hosts or running VMs.
12. Troubleshooting
Common issues:
Issue |
Likely cause |
Fix |
|---|---|---|
Dashboard all zeros |
Bootstrap incomplete/failed |
Check Bootstrap logs, verify services, rerun setup if needed |
Cannot create pod |
Invalid subnet/range or zone not selected |
Recheck gateway/netmask/IP range and zone selection |
Cannot create cluster |
Zone/pod dependency not met |
Select zone first, then pod; verify both enabled |
Host remains down |
BMC unreachable or bad credentials |
Ping BMC IP, verify login, check power/network, retry onboarding |
Host in |
Partial onboarding, hardware/service fault, or degraded management connectivity |
Open host details, review alerts/logs, correct root cause, and confirm host returns to |
12.1. Dashboard Troubleshooting
Issue: Dashboard cards show all zeros
When to Use:
Use this when Dashboard cards show all zeros is observed during infrastructure operations.
Purpose:
Identify the likely cause for this issue and restore the affected infrastructure object to a healthy state.
Steps:
Confirm you are logged into the correct environment/tenant.
Refresh the page and re-check cards.
Verify Bootstrap completed successfully.
Confirm at least one zone and pod exist.
Check services/logs with administrator if still zero.
Issue: Metrics not visible
Steps:
Confirm at least one host is onboarded and healthy.
Confirm storage and core services are online.
Wait a few minutes and refresh.
If still blank, escalate with screenshot and timestamp.
Expected Outcome:
The action completes successfully and the expected state is visible in the UI.
If this fails:
See Common screen checks before retrying this screen.
12.2. Zone Troubleshooting
Issue: Zone not visible
When to Use:
Use this when Zone not visible is observed during infrastructure operations.
Purpose:
Identify the likely cause for this issue and restore the affected infrastructure object to a healthy state.
Steps:
Check your RBAC permissions.
Clear zone filters/search.
Verify zone exists in the target environment.
Ask admin to verify domain/account scope.
Issue: Zone exists but disabled
Steps:
Open zone details and confirm state.
Check recent change logs/audit events.
Re-enable zone (if permitted) or request admin action.
Re-validate zone readiness before creating pods.
Expected Outcome:
The action completes successfully and the expected state is visible in the UI.
If this fails:
See Common screen checks before retrying this screen.
12.3. Pod Troubleshooting
Pod subnet overlap reference:
Example |
Status |
Why |
|---|---|---|
Existing pod |
Valid |
Separate CIDRs, no overlap |
Existing pod |
Invalid |
New subnet is inside existing range |
Existing pod |
Invalid |
New range overlaps parent CIDR |
Issue: Pod creation fails
When to Use:
Use this when Pod creation fails is observed during infrastructure operations.
Purpose:
Identify the likely cause for this issue and restore the affected infrastructure object to a healthy state.
Steps:
Confirm zone is selected first.
Validate gateway and netmask are correct.
Validate start/end IP are in subnet and
Start < End.Check for overlap with existing pod ranges.
Retry create operation.
Issue: Pod created but unusable
Steps:
Open pod details and verify network values.
Confirm pod state is enabled.
Confirm cluster creation uses the same zone/pod.
Fix network plan and recreate pod if values are wrong.
Expected Outcome:
The action completes successfully and the expected state is visible in the UI.
If this fails:
See Common screen checks before retrying this screen.
12.4. Cluster Troubleshooting
Issue: Pod dropdown not available in cluster form
When to Use:
Use this when Pod dropdown not available in cluster form is observed during infrastructure operations.
Purpose:
Identify the likely cause for this issue and restore the affected infrastructure object to a healthy state.
Steps:
Select zone first.
Verify selected zone has at least one enabled pod.
Confirm RBAC visibility for that pod.
Issue: Cluster unhealthy after creation
Steps:
Verify cluster mapping (zone/pod) is correct.
Verify hypervisor selection matches host capabilities.
Confirm at least one healthy host is present/added.
Re-check status after host onboarding.
Expected Outcome:
The action completes successfully and the expected state is visible in the UI.
If this fails:
See Common screen checks before retrying this screen.
12.5. Host Troubleshooting
Issue: Add host fails
When to Use:
Use this when Add host fails is observed during infrastructure operations.
Purpose:
Identify the likely cause for this issue and restore the affected infrastructure object to a healthy state.
Steps:
Verify BMC IP is reachable (ping/network path).
Verify BMC username/password by logging into BMC directly.
Verify BMC vendor selection matches hardware.
Verify server is powered and connected to management network.
Retry add host flow.
Issue: Host remains Down
Steps:
Check physical power and network link.
Check BMC remote console for boot/hardware errors.
Confirm hypervisor services are running.
Review host and management logs with administrator.
Remove/re-add host only after root cause is corrected.
Expected Outcome:
The action completes successfully and the expected state is visible in the UI.
If this fails:
See Common screen checks before retrying this screen.
13. Support
Support contact: support@karios.com
When opening a ticket, include:
Username/account
Affected area (Dashboard/Zone/Pod/Cluster/Host)
Exact error text
Screenshot
Steps already tried
Operational impact
Suggested ticket subject:
Infrastructure | <Component> | <Issue> | <ObjectName>Example:
Infrastructure | Host | Down | dc1-compute-03
→ Next: User Management
Expected Outcome
After this section, you should be able to:
explain zone/pod/cluster/host hierarchy
navigate Control Center infrastructure modules
perform core infrastructure actions safely
What To Do Next
Confirm at least one host is
Upwith visible CPU/RAM capacity.Verify the
Zone -> Pod -> Clustermapping matches your deployment plan.Continue to Compute - Virtual Machines for first workload provisioning.