Alerts
Path: Left sidebar > Monitoring > Alerts
When to Use:
During daily health checks, incidents, and planned maintenance windows.
When you need to understand or suppress a specific alert condition.
Purpose:
This page explains how to read alert severity, inspect active rules, and manage silences without losing cluster visibility.
Steps:
Open
Monitoring > Alerts.Review the summary cards and open
Firingif anything is active.Expand the relevant rule or silence for more detail.
Create or expire silences only when the maintenance window is approved.
Expected Outcome:
You can identify active cluster risk quickly and manage alert suppression safely.
What You See:
Severity cards,
All RulesandFiringlists, and theSilencesworkflow for maintenance suppression.
What This Screenshot Shows:
The screenshots on this page show the main alert tabs and the create-silence workflow in a reference environment.
Actions in This Screen:
Review active alerts by severity.
Expand rules to inspect labels, expressions, and annotations.
Create, review, or expire silences.
If this fails:
Treat unresolved critical alerts as blocking until the underlying service is stable.
Confirm the alert source module is still reporting current data.
Re-open the page after the alert state refreshes before creating more suppressions.
Alert Overview
The Alerts page shows all Prometheus-based alerting rules defined for your cluster, which rules are firing, and any silences that suppress notifications.
Ceph Alerts
Purpose:
To detect active cluster conditions by severity.
To prioritize immediate response using firing alerts.
To manage maintenance-time notification suppression safely.
When to Use:
At the start of daily health checks.
During incidents and degraded cluster states.
Before and during planned maintenance windows.
Steps:
Read top summary cards.
Open
Firingtab for active conditions.Use
All Rulesto interpret rule logic and annotations.Use
Silencesonly for planned maintenance suppression.
Expected Outcome:
You get a clear, severity-driven action path for alert response.
Summary Cards - Top Of Page
Read these cards first every time you open Alerts.
Card |
What It Shows |
Example In Screenshot |
|---|---|---|
Critical |
Number of critical alerts currently firing / total critical rules defined |
|
Warning |
Number of warning alerts currently firing / total warning rules defined |
|
Info |
Number of info alerts currently firing / total info rules defined |
|
Tip
Card format is X firing / Y total rules. 0 firing means no active
alerts in that severity right now.
Each card also shows the total number of rules defined for that severity so the firing-to-total ratio is visible at a glance.
Severity |
What It Means |
What To Do |
|---|---|---|
Critical |
Requires immediate attention; cluster health or data integrity can be at risk |
Investigate immediately via Firing tab. |
Warning |
Potential issue; not immediately dangerous |
Review and resolve before it becomes persistent. |
Info |
Informational notice |
Monitor only. |
Steps:
Open
Monitoring > Alerts.Read
Critical,Warning, andInfocards.If any card shows non-zero firing, open
Firingtab immediately.
Expected Outcome:
You get an immediate severity-based health snapshot.
Alerts Page Tabs
Tabs below the summary cards:
All Rules (N): All alert rules, active or not.Firing (N): Only currently active alerts.Silences (N): Notification suppressions during maintenance windows.
All Rules Tab
Path: Monitoring > Alerts > All Rules (default tab)
Shows every alerting rule currently defined in the cluster.
Purpose:
To understand each alert rule before it fires.
When to Use:
During onboarding and alert policy review.
During incidents when an unfamiliar alert appears.
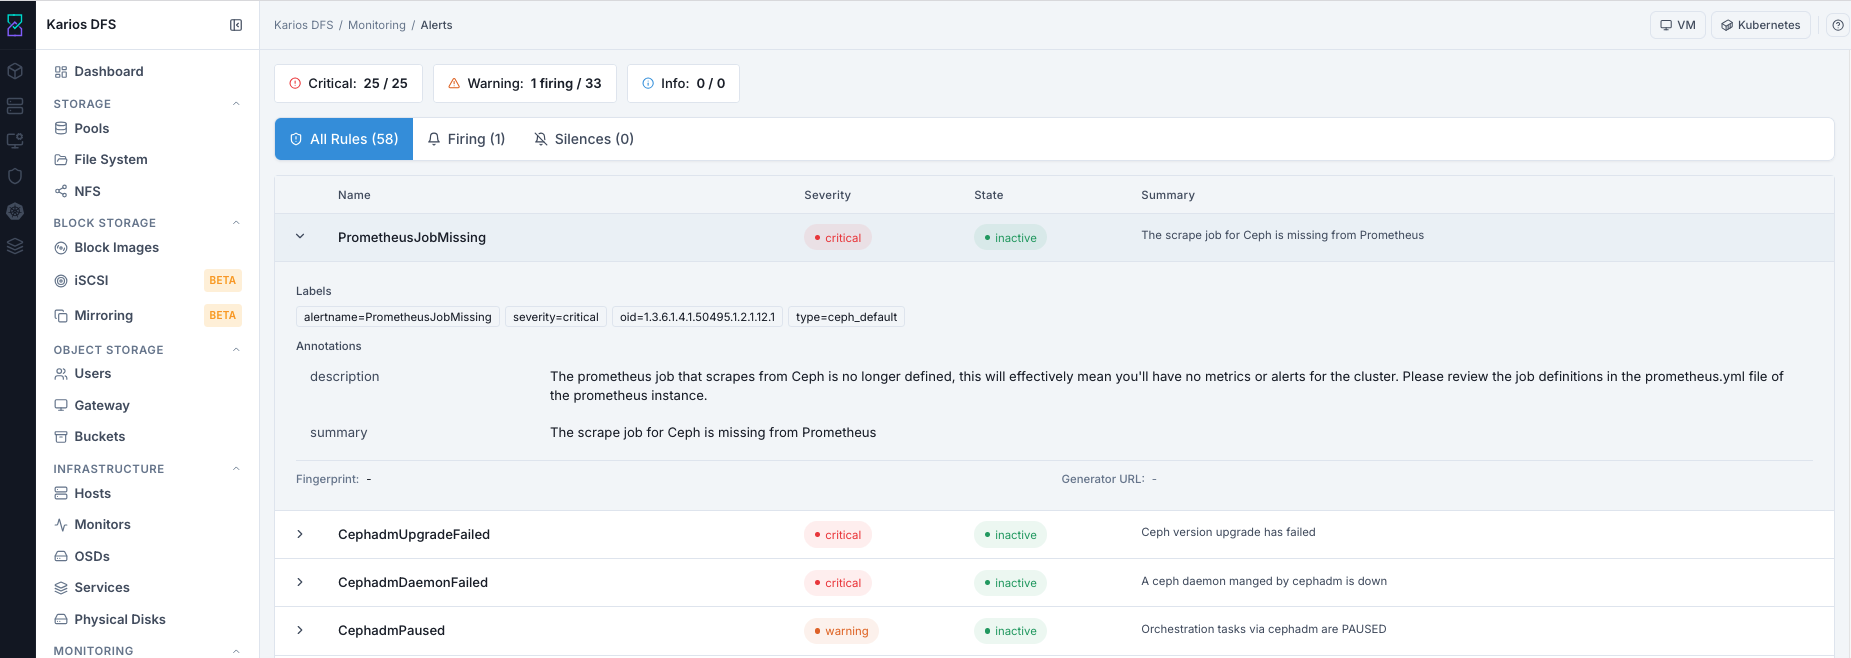
What This Screenshot Shows: Alerts - All Rules Tab (UI Reference; Values Depend On Your Environment).
All Rules List - Column Reference
Column |
What It Shows |
|---|---|
Name |
Alert rule name (for example |
Severity |
|
State |
|
Summary |
Human-readable description of what the rule detects |
How To Read An Expanded Rule
Click chevron > on a rule row to view:
Expression: full PromQL alert expression.Labels: metadata such asalertname,severity,oid, andtype.Annotations: descriptive explanation fields.
Annotation Field |
What It Shows |
|---|---|
description |
Full explanation of what the alert detects and why it matters |
summary |
Short one-line summary |
Note
Fingerprint and Generator URL can show - for rules that are not
actively populated yet.
Tip
Read rule descriptions before incidents. This speeds up response when alerts move into firing state.
Steps:
Open
All Rules.Scan
SeverityandStatecolumns.Expand important rules and read
descriptionannotation.
Expected Outcome:
You build a rule-level response map before incidents occur.
State Reference
State |
Meaning |
|---|---|
inactive |
Rule is defined and evaluated, but threshold is not met |
pending |
Threshold is met, but required hold time has not elapsed |
firing |
Condition persisted for required duration; alert is active |
Firing Tab
Path: Monitoring > Alerts > Firing
Shows only active alerts. Check this first when any summary card shows non-zero
firing count.

What This Screenshot Shows: Alerts - Firing Tab (UI Reference; Values Depend On Your Environment).
Firing List - Column Reference
Column |
What It Shows |
|---|---|
Alert Name |
Active alert rule name |
Severity |
Critical, Warning, or Info |
Summary |
Human-readable active condition |
Started |
How long ago the alert began firing (or exact start time, depending on UI formatting) |
Source |
Link to upstream source if configured (or |
How To Read A Firing Alert
Open
Firingtab.Review severity and summary for urgency.
Expand row for full labels/annotations.
Use
Startedtimestamp to judge duration and impact.
Expected Outcome:
You identify active conditions, urgency, and next investigation path.
Common Alerts Reference
Alert |
Severity |
Typical Cause |
Action |
|---|---|---|---|
CephHealthError |
Critical |
Critical cluster condition |
Check the dashboard health banner. |
OSDDown |
Critical |
OSD daemon stopped |
Check OSD status and host connectivity. |
LowDiskSpace |
Warning |
OSD usage above safe threshold |
Add OSDs or delete data. |
MONQuorumAtRisk |
Warning |
Monitor count near quorum loss |
Check monitor hosts. |
PGDegraded |
Warning |
Replicas missing after OSD failure |
Wait for recovery or investigate affected OSDs. |
Alert Remediation Index
Use this index to move from a firing alert to the first investigation page quickly.
Alert Name |
Go To First |
First Validation |
Expected Outcome |
|---|---|---|---|
CephHealthError |
Check health banner, MON quorum, and OSD up/in state. |
You identify the failing subsystem before deeper remediation. |
|
OSDDown |
Verify OSD status, host reachability, and disk health indicators. |
You confirm if fault is daemon, host, or disk related. |
|
LowDiskSpace |
Check OSD usage distribution and pool growth pattern. |
You decide whether to add capacity or reclaim data safely. |
|
MONQuorumAtRisk |
Validate In Quorum count and identify missing monitor host. |
Quorum risk is isolated to connectivity or monitor daemon state. |
|
PGDegraded |
OSDs and Performance |
Check down/out OSDs and confirm whether recovery is progressing. |
You confirm if condition is transient recovery or a persistent fault. |
CephPGImbalance |
Review PG spread and reweight needs. |
PG distribution action plan is identified. |
|
CephadmDaemonFailed |
Inspect service running mismatch and daemon events. |
Failed daemon host and restart path are identified. |
|
PrometheusJobMissing |
Confirm missing scrape behavior and related monitoring errors. |
Monitoring pipeline issue is confirmed for escalation. |
Silences Tab
Path: Monitoring > Alerts > Silences
Shows configured silences that suppress alert notifications during a time window. Use for planned maintenance only.
Purpose:
To verify active suppressions and avoid blind spots.
When to Use:
Before maintenance starts.
During maintenance to verify expected silence status.
After maintenance to confirm silences are expired.
Note
No silences configured is normal when no maintenance suppression is active.
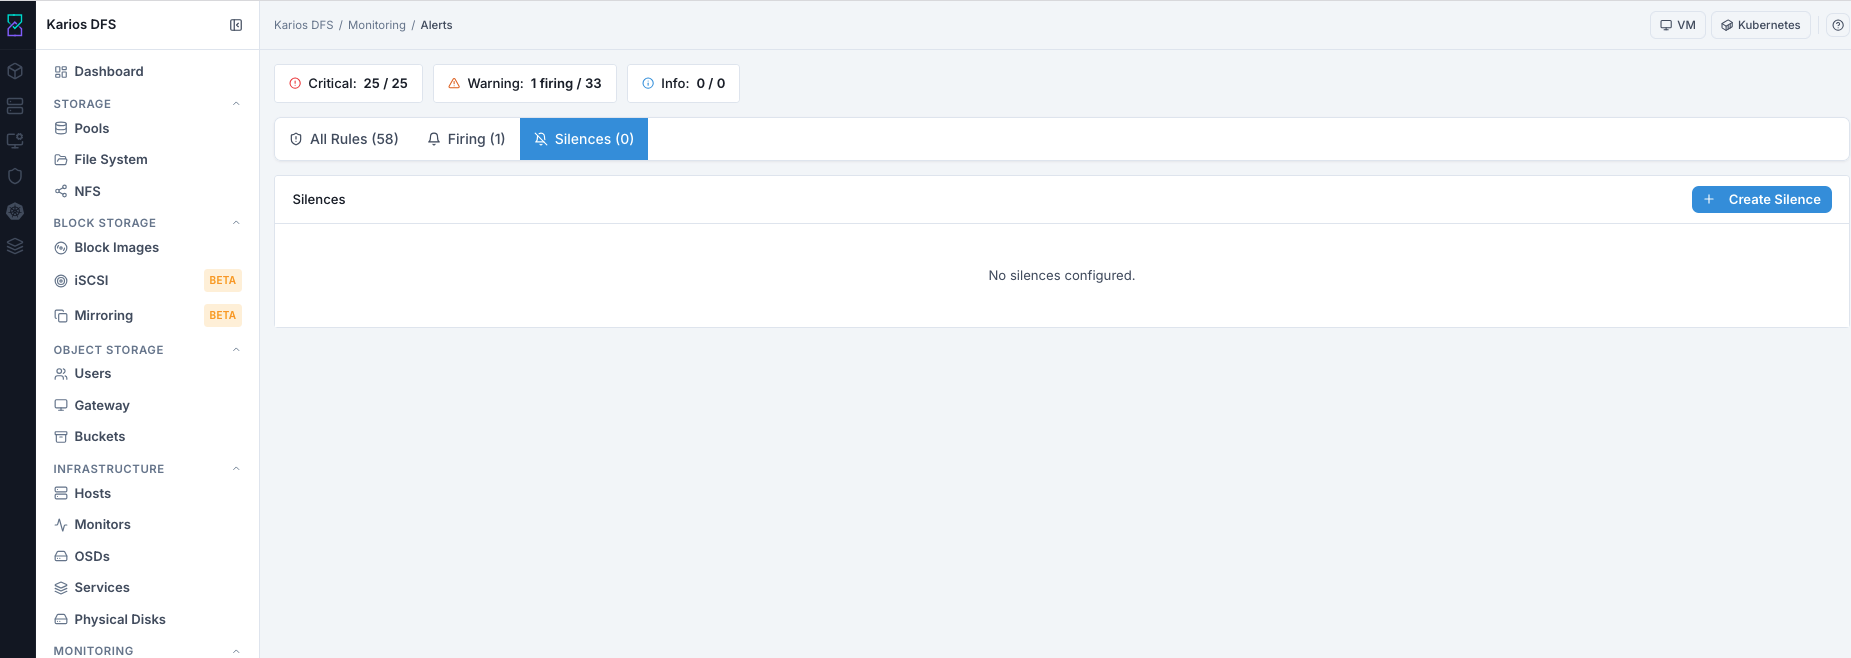
What This Screenshot Shows: Alerts - Silences Tab (UI Reference; Values Depend On Your Environment).
Silences List - Column Reference
Column |
What It Shows |
|---|---|
ID |
Unique silence identifier |
Created By |
User who created the silence |
Comment |
Reason for suppression |
Status |
|
Starts |
Start time |
Ends |
End time |
Actions |
|
Steps:
Open
Silences.Review active entries, owner, reason, and end time.
Expire entries that should no longer suppress notifications.
Expected Outcome:
Alert notification behavior remains intentional and auditable.
Common Tasks
Create A Silence:
Click
Create Silenceand define matcher (alert name or labels), time window, and comment explaining why silence is required.Use during planned maintenance to avoid alert noise.
Expire A Silence:
Immediately ends an active silence so alerts can notify again.
Use after maintenance is complete.
How To Create A Silence
Path: Monitoring > Alerts > Silences > + Create Silence
Purpose:
To suppress expected maintenance noise without disabling alert evaluation.
When to Use:
During planned operations that intentionally trigger alerts.
Steps:
Open
Silencestab.Click top-right
+ Create Silence.Set
Matcher Label(alertname).Set
Matcher Valueto exact alert name.Enable regex only if pattern-based matching is required.
Set maintenance-aligned duration with safety buffer.
Set
Created Byto your user identity.Add clear maintenance comment.
Click
Create.
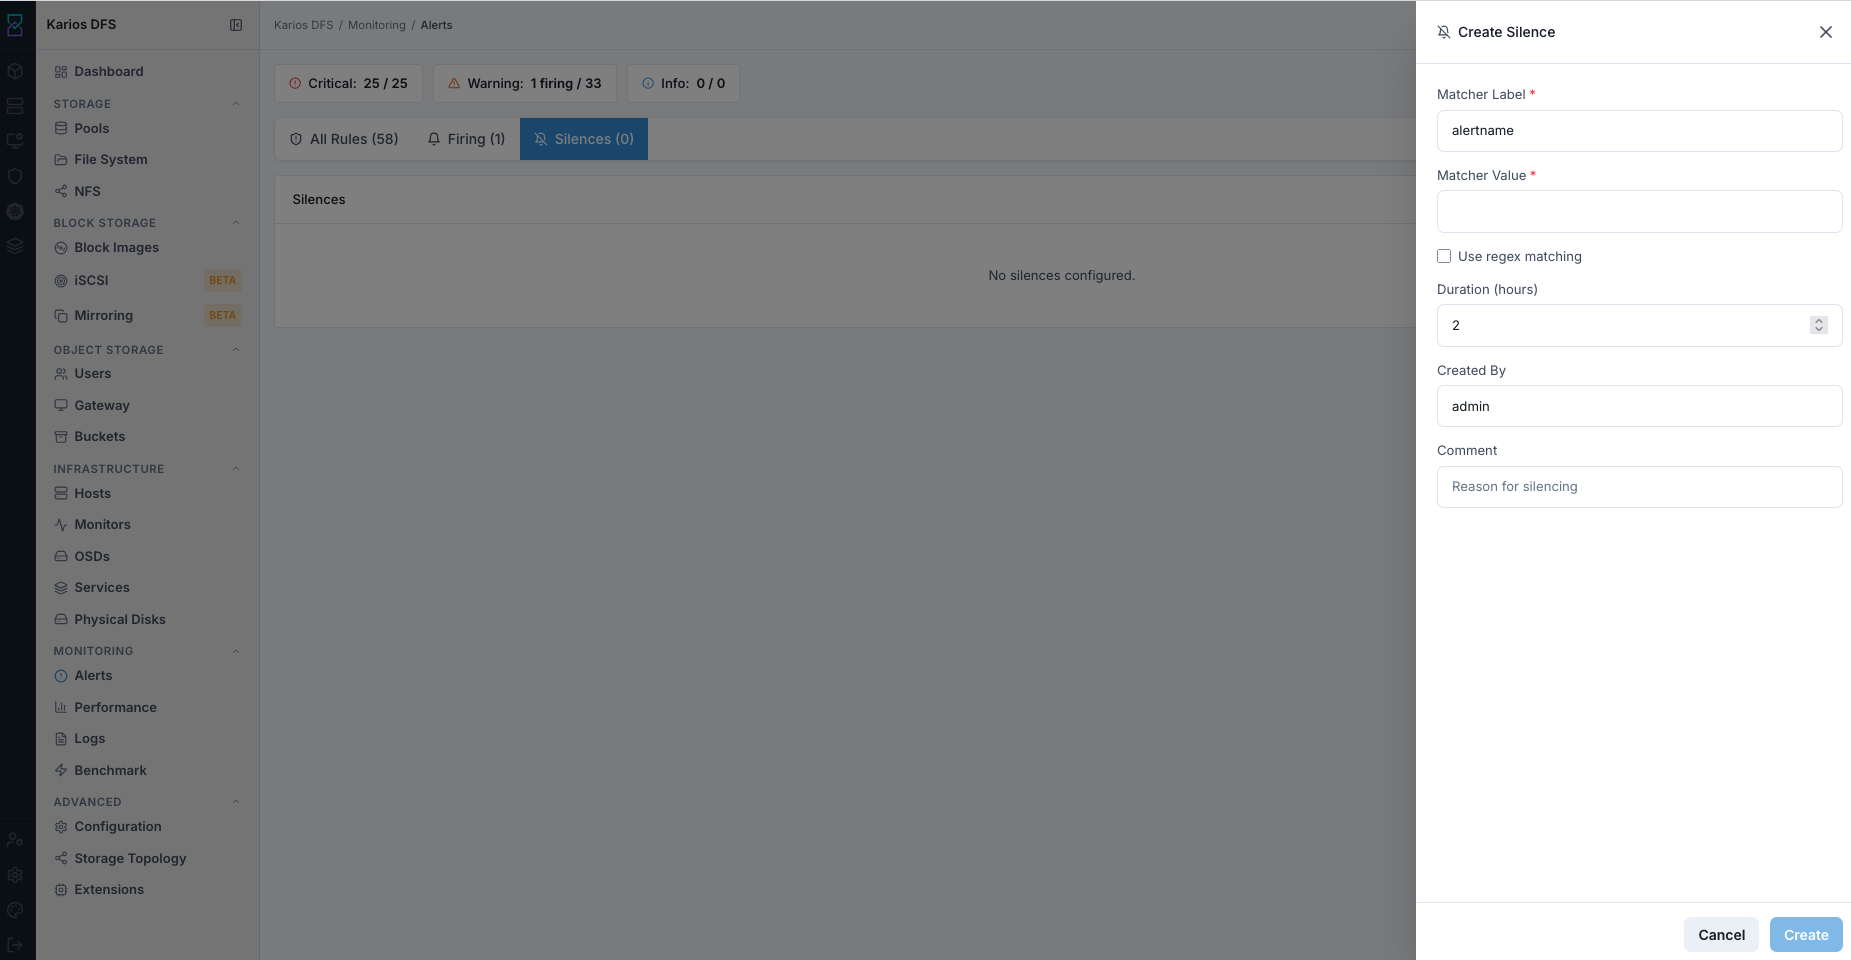
What This Screenshot Shows: Alerts - Create Silence Panel (UI Reference; Values Depend On Your Environment).
Expected Outcome:
Silence appears with
Status = Active.Matching alerts continue evaluation and can still appear in Firing.
Notification delivery for matched alerts is suppressed until expiry.
Status moves to
Expiredwhen window ends and notifications resume.
Warning
Silence suppresses notifications, not the underlying fault condition. Always resolve root cause rather than leaving long-running silences.
Create Silence - Field Reference
Field |
Value / Options |
Description |
|---|---|---|
Matcher Label * |
Text ( |
Label key to match |
Matcher Value * |
Text |
Exact alert name or pattern target |
Use regex matching |
Checkbox |
Pattern matching across multiple alert names |
Duration (hours) |
Number |
Suppression duration |
Created By |
Text |
Audit identity for silence ownership |
Comment |
Text |
Reason and maintenance context |
How To Expire A Silence
Purpose:
To restore normal notifications as soon as maintenance completes.
When to Use:
Immediately after maintenance validation is complete.
Steps:
Open
Silencestab.Find active silence row.
Click
Expire.Confirm action.
Expected Outcome:
Silence status becomes
Expiredand matching alerts notify again if still firing.
Troubleshooting - Alerts
Problem You See |
Most Likely Cause |
What To Do |
|---|---|---|
Firing alerts are unclear |
Unfamiliar rule semantics |
Open All Rules, expand same alert, read description annotation. |
Warning card count never clears |
Underlying condition unresolved |
Investigate firing details and fix root cause. |
Rules exist but metrics/graphs missing elsewhere |
Prometheus integration/scrape issue |
Check for |
Cannot create silence |
Insufficient role permissions |
Request required role from Karios administrator. |
Silence expired but alert still firing |
Issue still present |
Resolve condition through Infrastructure/Storage diagnosis. |
Note
If any issue persists, raise a support ticket via Monitoring > Alerts or
Karios Support.