Benchmark
Path: Left sidebar > Monitoring > Benchmark
When to Use:
After hardware, topology, or performance-policy changes.
Before onboarding sensitive workloads or validating a baseline.
Purpose:
This page shows how to run controlled disk, pool, and RBD benchmarks and compare the result with your expected baseline.
Steps:
Open
Monitoring > Benchmark.Select the benchmark tab that matches the layer you want to test.
Choose the target node, configure the run, and start the benchmark.
Review Benchmark History and compare the results with your baseline.
Expected Outcome:
You get repeatable throughput, IOPS, and latency measurements for the selected layer.
What You See:
Benchmark tabs, target-node selection, run forms, and Benchmark History for completed tests.
What This Screenshot Shows:
The screenshots on this page show the disk, pool, and RBD benchmark forms used to launch and review test runs.
Actions in This Screen:
Select a target node.
Run disk, pool, or RBD benchmarks.
Review completed benchmark history.
If this fails:
Confirm the target node and selected resource are healthy and reachable.
Retry during a lower-load window if the cluster is already busy.
Clean up old test data before repeating the run when required.
Benchmark Overview
Ceph Benchmark lets you run synthetic I/O tests against the cluster to measure raw performance of disks, pools, or RBD images. Use it after hardware changes or to validate SLA targets.
Warning
Benchmarks generate real I/O load. Run them during low-traffic periods to avoid impacting production workloads.
Benchmark Tabs
Tab |
What It Tests |
Tool Used |
|---|---|---|
Disk Benchmark |
Raw sequential and random performance of individual disks on a host |
|
Pool Benchmark |
Ceph pool performance through direct RADOS operations |
|
RBD Benchmark |
Performance of a specific RBD image simulating VM-like workload |
|
Purpose:
To validate performance after hardware, disk, or topology changes.
To compare measured results against SLA targets.
To isolate bottlenecks at disk, pool, or image layer.
When to Use:
After node or disk replacement.
After adding OSDs or changing placement/replication behavior.
Before onboarding latency-sensitive workloads.
Steps:
Select the benchmark tab for the layer you want to test.
Click top-right
Select target node...and choose the host.Configure test fields and run the benchmark.
Review Benchmark History and compare with expected baseline.
Expected Outcome:
You get repeatable baseline metrics for IOPS, throughput, and latency.
Select Target Node
All tabs require a target node from the top-right Select target node...
action button before any run can start.
Note
If no node is selected, run actions remain blocked and the UI prompts node selection.
Benchmark History
Each tab has a Benchmark History area where completed runs appear. The
empty state is normal before first execution.
Disk Benchmark Tab
Path: Monitoring > Benchmark > Disk (fio)
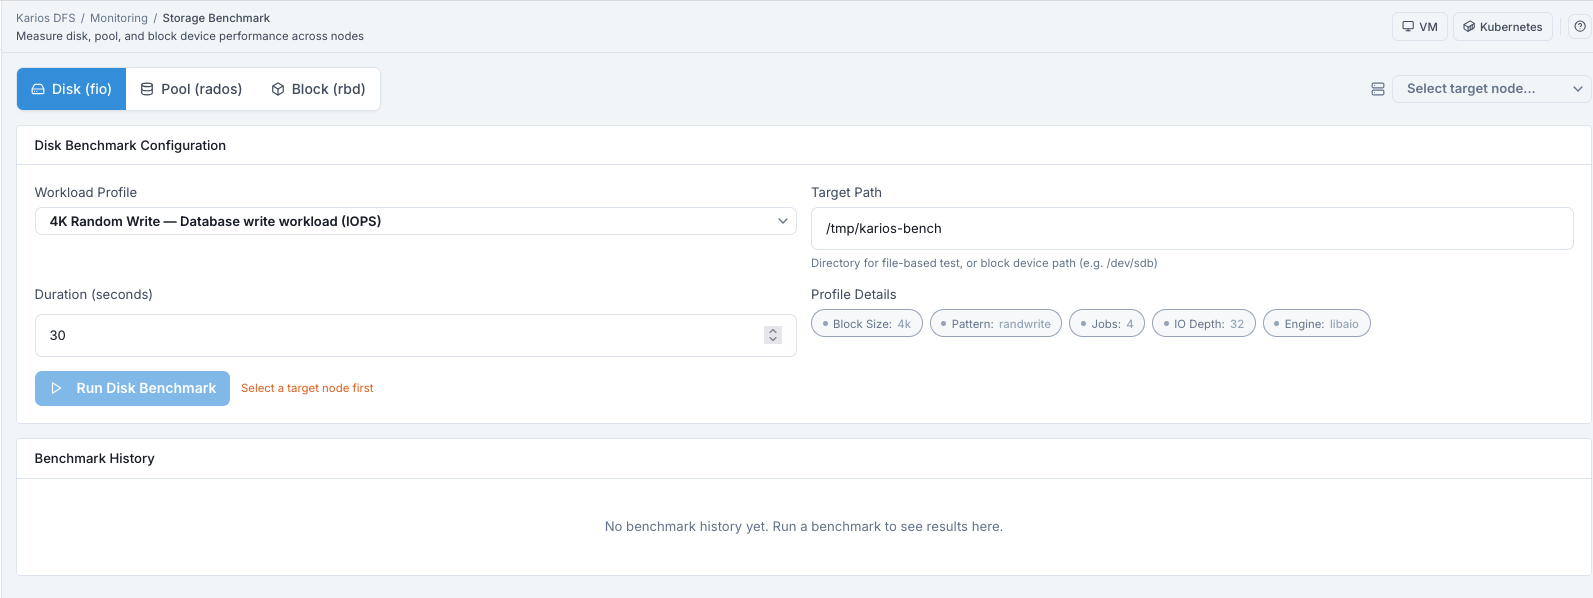
What This Screenshot Shows: Benchmark - Disk (fio) Tab (UI Reference; Values Depend On Your Environment).
Uses fio to test raw sequential and random disk performance on a selected
host.
Purpose:
To verify host-level disk capability for random and sequential workloads.
When to Use:
Before assigning a disk to production workload.
After replacing disk firmware or physical hardware.
How To Run A Disk Benchmark
Open
Disk (fio)tab.Click top-right
Select target node...and choose the host.Select
Deviceto test (for example/dev/sdb).Select
Test Type(sequential or random, read or write).Set
Block Size(for example 4K for random tests, 1M for sequential tests).Set
Durationin seconds.Click
Run Disk Benchmark.
Expected Outcome:
The test runs on the selected host/device for the configured duration.
Results are written into Benchmark History after completion.
You get host-disk baseline values for IOPS, throughput, and latency.
Tip
Use 4K block size for random IOPS validation and 1M block size for sequential throughput validation.
Disk Benchmark - Field Reference
Field |
Description |
|---|---|
Host |
Select the host whose disks you want to test |
Device |
The specific block device (for example |
Test Type |
Sequential read/write or random read/write |
Block Size |
I/O block size (4K for random, 1M for sequential) |
Duration |
How long the test runs in seconds |
Disk Benchmark - Result Metrics
IOPS
Throughput (MB/s)
Average latency
99th-percentile latency
Pool Benchmark Tab
Path: Monitoring > Benchmark > Pool (rados)
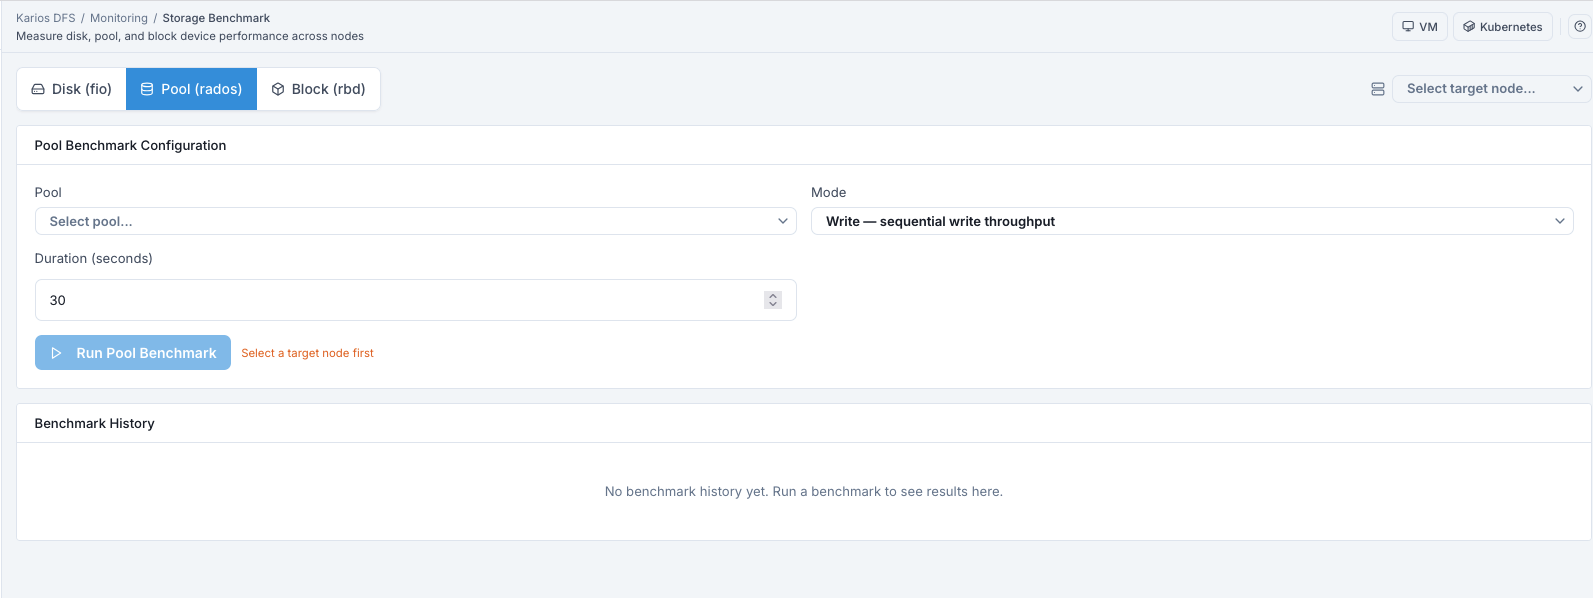
What This Screenshot Shows: Benchmark - Pool (rados) Tab (UI Reference; Values Depend On Your Environment).
Uses rados bench to measure a Ceph pool by writing and reading objects
through the RADOS protocol.
Purpose:
To measure pool-level behavior including replication overhead and placement impact.
When to Use:
Before onboarding high-throughput applications to a pool.
After changing pool policy or data placement behavior.
How To Run A Pool Benchmark
Open
Pool (rados)tab.Click top-right
Select target node...and choose the host.Select target
Pool.Select
Operation(Write, sequential read, or random read).Set
Concurrency.Set
Object Size.Set
Durationin seconds.Click
Run Pool Benchmark.
Expected Outcome:
Test objects are written/read directly in the selected pool.
Benchmark History shows measured throughput, IOPS, and latency.
You get pool-level performance baselines through native RADOS path.
Note
Sequential reads require a prior write pass to populate test objects. Run a write test first.
Tip
Start with a write run, then execute sequential/random reads on the same pool to get a comparable read baseline.
Pool Benchmark - Field Reference
Field |
Description |
|---|---|
Pool |
Target pool for the benchmark |
Operation |
Write, sequential read, or random read |
Concurrency |
Number of parallel I/O threads |
Object Size |
Size of each test object |
Duration |
Test duration in seconds |
Pool Benchmark - Result Metrics
IOPS
Throughput
Average latency
Maximum latency
Number of objects written
RBD Benchmark Tab
Path: Monitoring > Benchmark > Block (rbd)
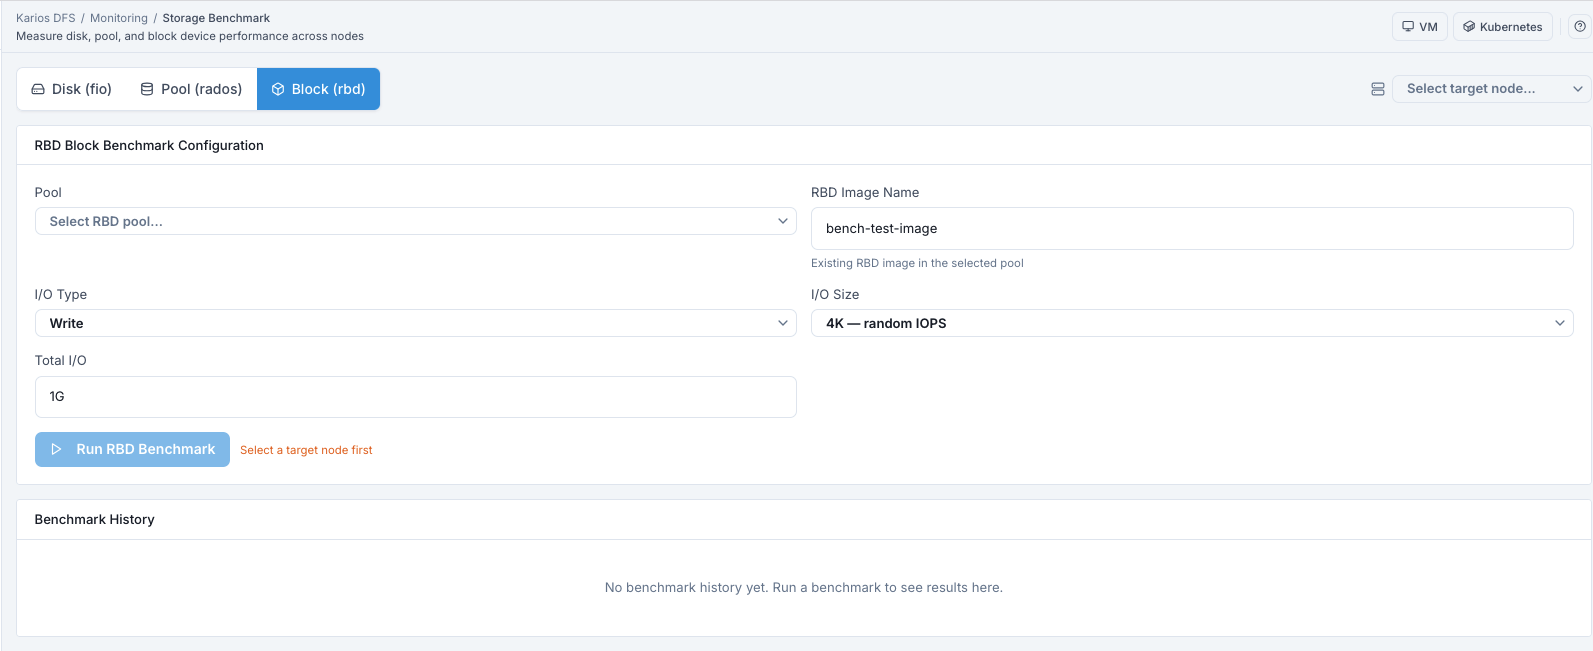
What This Screenshot Shows: Benchmark - Block (rbd) Tab (UI Reference; Values Depend On Your Environment).
Uses rbd bench to measure performance of a specific RBD image and simulate
VM workload behavior.
Purpose:
To validate image-level block performance before production VM placement.
When to Use:
Before assigning RBD images to sensitive VM workloads.
After changing image-level settings or pool layout.
How To Run An RBD Benchmark
Open
Block (rbd)tab.Click top-right
Select target node...and choose the host.Select target
Pool / Image.Set
I/O Type(Read or Write).Set
I/O Size(4K-4M).Set
I/O Threads.Set
Durationin seconds.Click
Run RBD Benchmark.
Expected Outcome:
The benchmark generates block I/O against the selected image.
Results appear in Benchmark History for throughput and latency review.
You get image-specific baseline performance for VM planning.
Tip
Start with lower I/O Threads and increase gradually. Higher thread
counts can increase throughput but can also increase latency.
RBD Benchmark - Field Reference
Field |
Description |
|---|---|
Pool / Image |
The RBD image to benchmark |
I/O Type |
Read or write |
I/O Size |
Request size (4K-4M) |
I/O Threads |
Parallelism; higher threads can increase throughput and latency |
Duration |
Test duration in seconds |
Interpreting Results
Metric |
Guidance |
|---|---|
IOPS (random 4K) |
HDD: ~200 IOPS, SSD: ~50K+, NVMe: ~500K+ |
Throughput (sequential 1M) |
HDD: ~200 MB/s, SSD/NVMe: 500MB/s-3GB/s |
Latency (avg) |
< 1ms excellent, 1-5ms acceptable, > 10ms investigate |
p99 latency |
Should be < 10x average; large outliers indicate disk or network issues |
When Results Are Lower Than Expected:
Check if competing workloads were active during test.
Check
Recovery RateunderMonitoring > Performance > OSD Performance.Check SMART status in
Infrastructure > Hosts > Device Health.Account for replication overhead on write-heavy tests.
Cleanup
Pool and RBD benchmarks write test objects that must be cleaned up after benchmarking.
Purpose:
To reclaim used space and avoid stale test artifacts.
When to Use:
Immediately after benchmark validation is complete.
How To Clean Up:
Open Benchmark History for the run.
Click
Clean Upfor the selected benchmark result.Confirm cleanup and verify test objects are removed.
Expected Outcome:
Test data is removed from the selected pool and benchmark footprint is cleared.
Troubleshooting - Benchmark
Problem You See |
Most Likely Cause |
What To Do |
|---|---|---|
Run action is blocked |
No target node selected |
Click top-right |
Pool dropdown is empty |
No pools available or load issue |
Verify pools in |
Sequential read gives invalid/low results |
No prior write pass |
Run write benchmark first, then rerun read. |
RBD image not found |
Wrong image name or wrong pool |
Confirm image in |
Results far below expected |
Competing workload or active recovery |
Rerun in low-traffic window and verify recovery is complete. |
Cleanup did not remove expected data |
Wrong benchmark target selected |
Recheck selected pool/image and run cleanup again. |