Nodes
Purpose
Use this section to manage node-level operations from the Nodes dashboard and host views.
What Nodes Shows
The Nodes dashboard provides a node-scoped operational view with:
Left panel access:
Dashboardand node selector.Summary cards:
HostsandVMs(with running count).Utilization cards:
CPU,Memory,Storage, andNetwork IPs.Host table: host name, IP address, state, CPU cores, memory, GPU count, CPU used, memory used, and row actions.
Top-right controls: cluster filter, available socket indicator, and
+ Add Host.
Why Use Nodes
Use this section to:
Check current node capacity and host status quickly.
Run host lifecycle actions from the dashboard row menu.
Open host details for deeper investigation (VMs, network, alerts, metrics, storage).
Add and review new host onboarding data from one workflow.
Step: Access Nodes from Sidebar
When to Use:
Use this first when starting any node workflow.
Purpose:
Open the Nodes section and confirm the node selector is visible.
Steps:
In the left sidebar, click
Nodes.Click
Dashboard.Confirm the node selector is visible under
Dashboard.
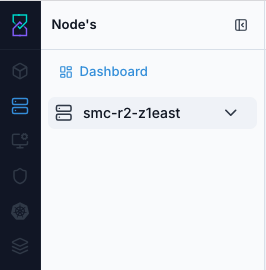
Nodes section access from the left navigation.
Expected Outcome:
Nodes opens and the dashboard entry is available.
If this fails:
Refresh the page.
Re-open
Nodesfrom the left sidebar.Confirm your role has access to the Nodes section.
Step: Review Node Dashboard
When to Use:
Use this after opening Nodes to check current node capacity and host state.
Purpose:
Read the dashboard summary before taking host actions.
Steps:
Open
Control Center -> Nodes -> Dashboard.Review top cards:
HostsandVMs.Review utilization cards:
CPU,Memory,Storage, andNetwork IPs.Review the host table row and current state.
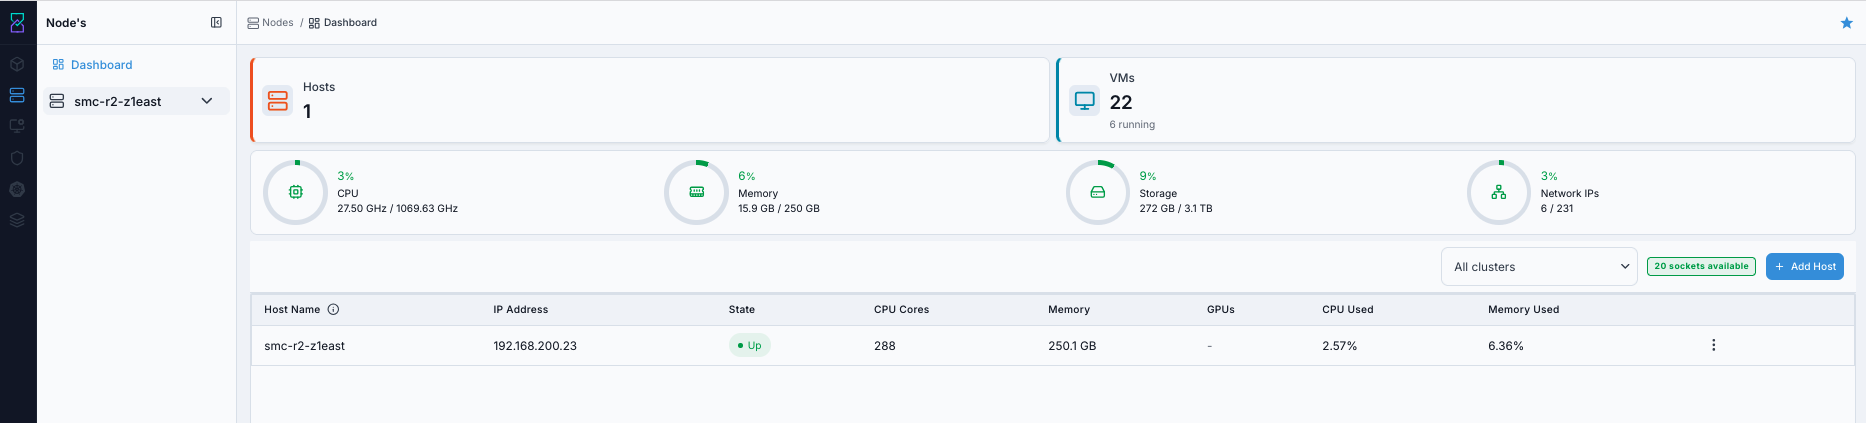
Nodes dashboard overview.
Expected Outcome:
You can see host count, VM count, utilization, and host row status in one view.
If this fails:
Re-open
Dashboardfrom the Nodes menu.Confirm a node is selected in the node selector.
Step: Review Entries Under Selected Node
When to Use:
Use this when you need to inspect entries listed under the selected node context.
Purpose:
Expand the node selector and review listed entries and row actions.
Steps:
Click the node selector (for example
smc-r2-z1east).Review the expanded entries shown under the selected node.
Use row actions (
⋮) for a listed entry when needed.
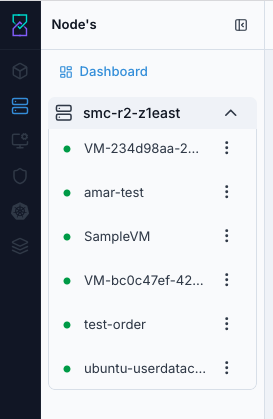
Expanded node selector with available entries.
Expected Outcome:
The selector expands and listed entries are visible with per-row actions.
If this fails:
Collapse and re-expand the selector.
Refresh the dashboard and retry.
Step: Run Host Row Actions
When to Use:
Use this to perform lifecycle or maintenance actions on the host row.
Purpose:
Apply host actions from the dashboard table menu.
Steps:
In the host table row, click the actions menu (
⋮).Select the required action:
Enable,Disable,Prepare for Maintenance,Cancel Maintenance, orReconnect.
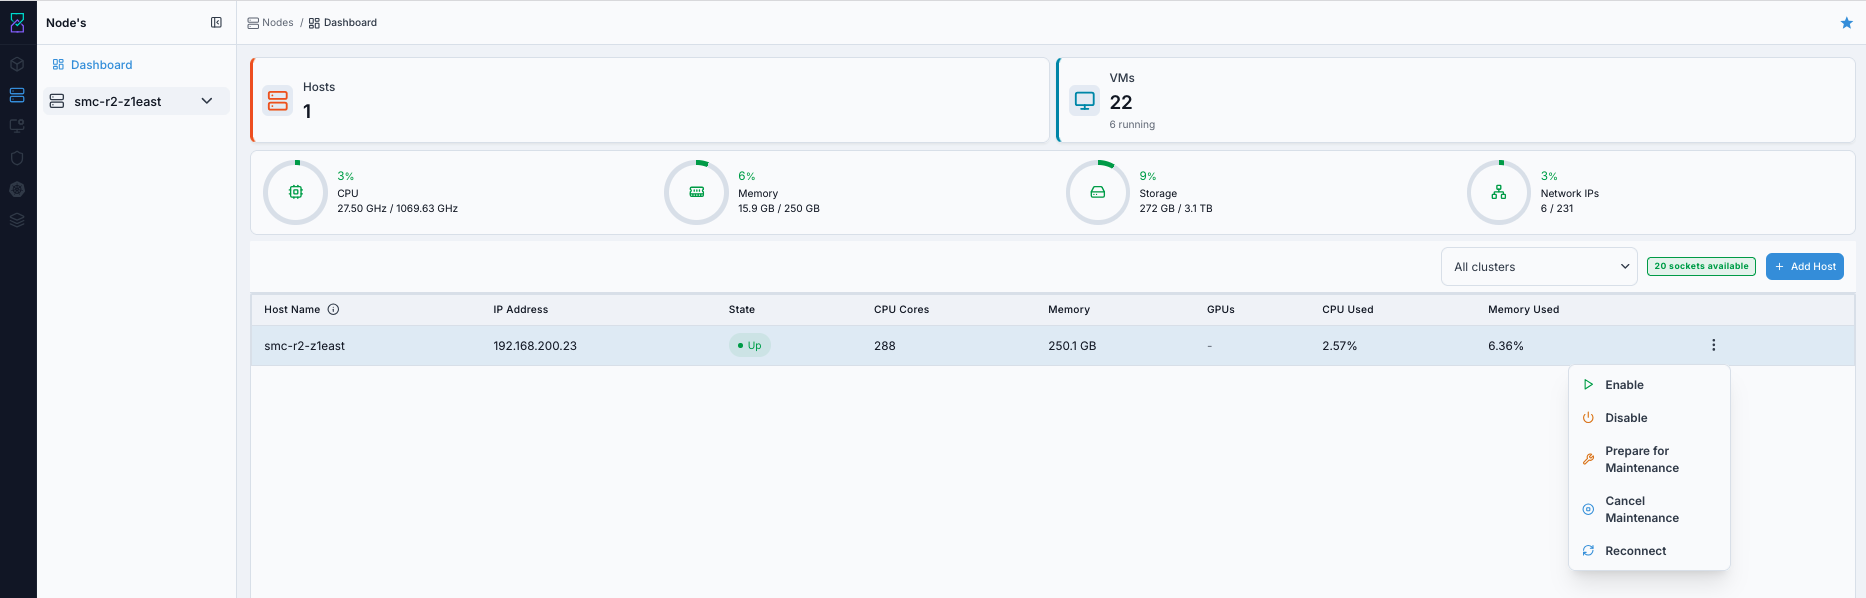
Host actions available from the dashboard row menu.
Warning
Run host lifecycle actions only on the intended host row.
Expected Outcome:
The selected host action is triggered from the row menu.
If this fails:
Re-open the row actions menu.
Verify the host row is in a valid state for the selected action.
Step: Open Host Details
When to Use:
Use this when dashboard summary is not enough and host-level details are required.
Purpose:
Open the full Infrastructure Host details page and review tabs and host metadata.
Steps:
Open the target host from the dashboard row.
Confirm navigation opens the Infrastructure
Hostsdetails page for that host.Review host tabs:
Details,VMs,GPUs,Console,Network,Alerts,Metrics,Karios Shield, andStorage.Review key cards and information panels on the
Detailstab.
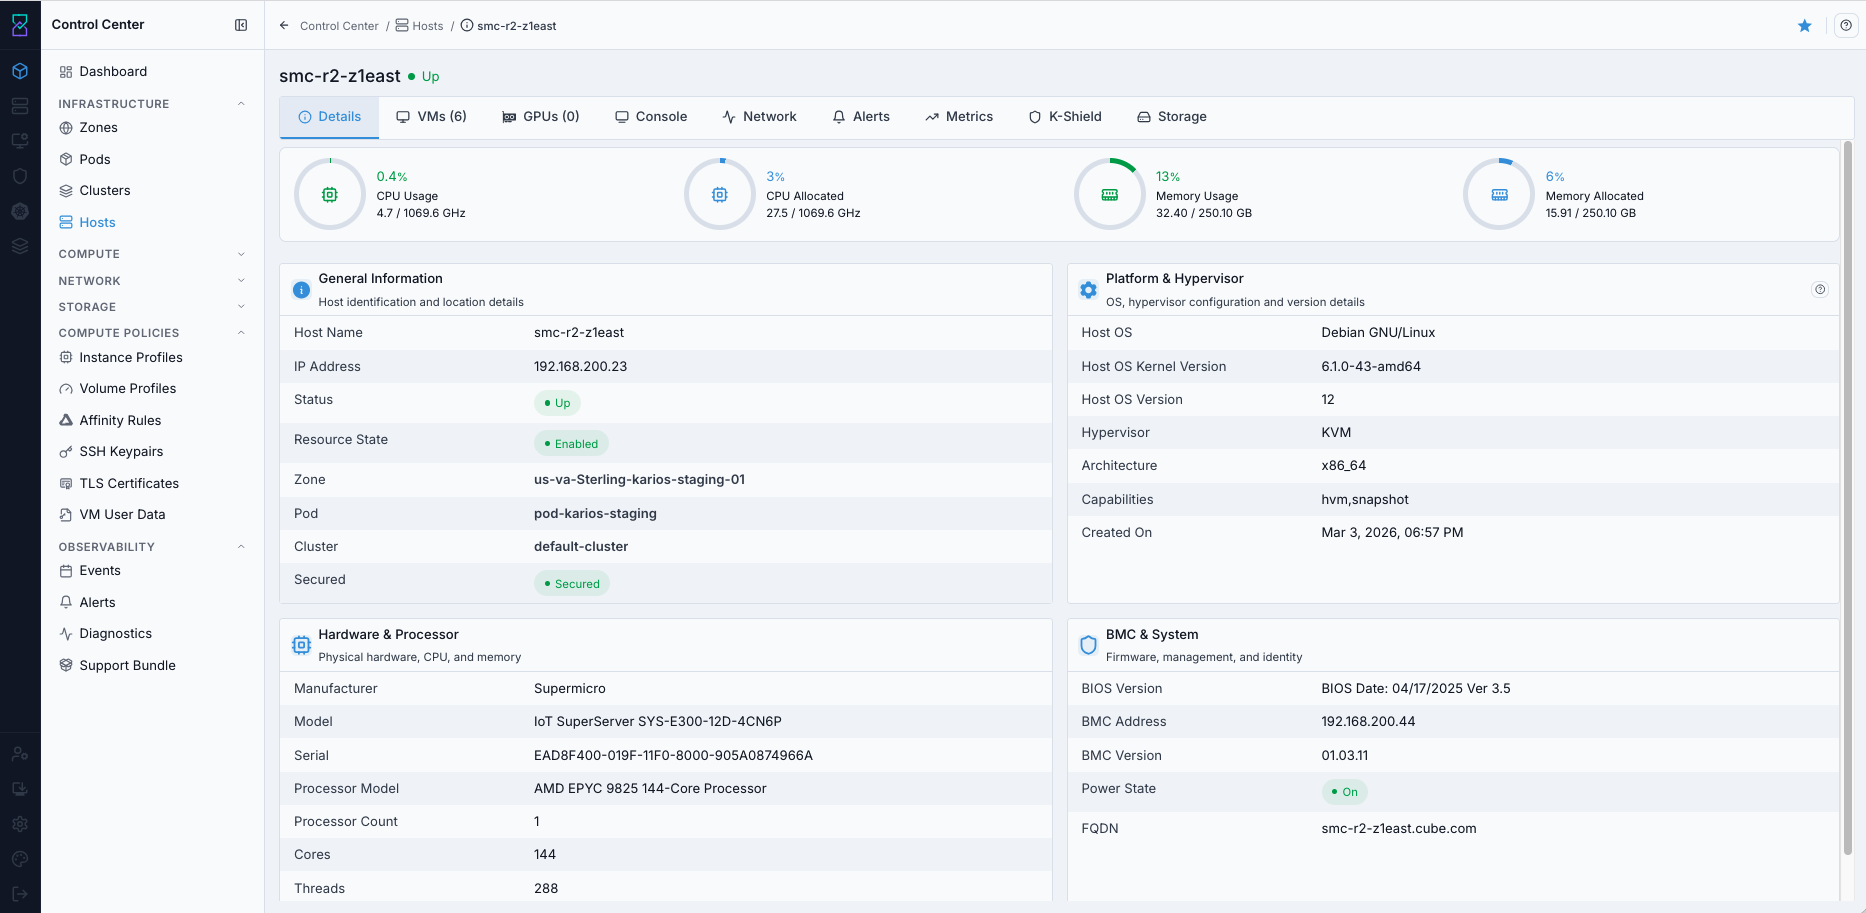
Infrastructure Host details page opened from Nodes workflow.
Expected Outcome:
Full host-level details are available for investigation and action.
If this fails:
Return to the dashboard and re-open the host.
Confirm the host is reachable and visible in the node context.
Step: Add Host (Uses Infrastructure Canonical Workflow)
When to Use:
Use this when onboarding a new host from the Nodes dashboard.
Purpose:
Open the same Add Host flow used in Infrastructure and complete Details and Review safely.
Steps:
Click
+ Add Hoston the dashboard.Continue with the canonical Infrastructure workflow at Add Host (Infrastructure canonical workflow).
Return to Nodes or Infrastructure and confirm the host registration request was accepted.
Warning
The Nodes page opens the same host-onboarding form used by Infrastructure. Keep Infrastructure as the canonical source for field-by-field form guidance.
Expected Outcome:
Host registration request is submitted and the new host becomes visible for follow-up validation.
If this fails:
Re-open the Infrastructure canonical workflow and verify all required form values there.
Verify BMC IP, username, and password values.
Retry the submission and refresh the Nodes dashboard.
→ Next: Compute Policies