Extensions
Path: Left sidebar > Advanced > Extensions
Extensions
The Extensions page lists Ceph Manager (MGR) plugin modules available in the cluster. These are optional extensions that add features such as the dashboard, alerting, orchestration, telemetry, and metrics export.
Note
The enabled/total counter in the top-right is environment-specific (for
example 19 / 32 enabled in the reference UI).
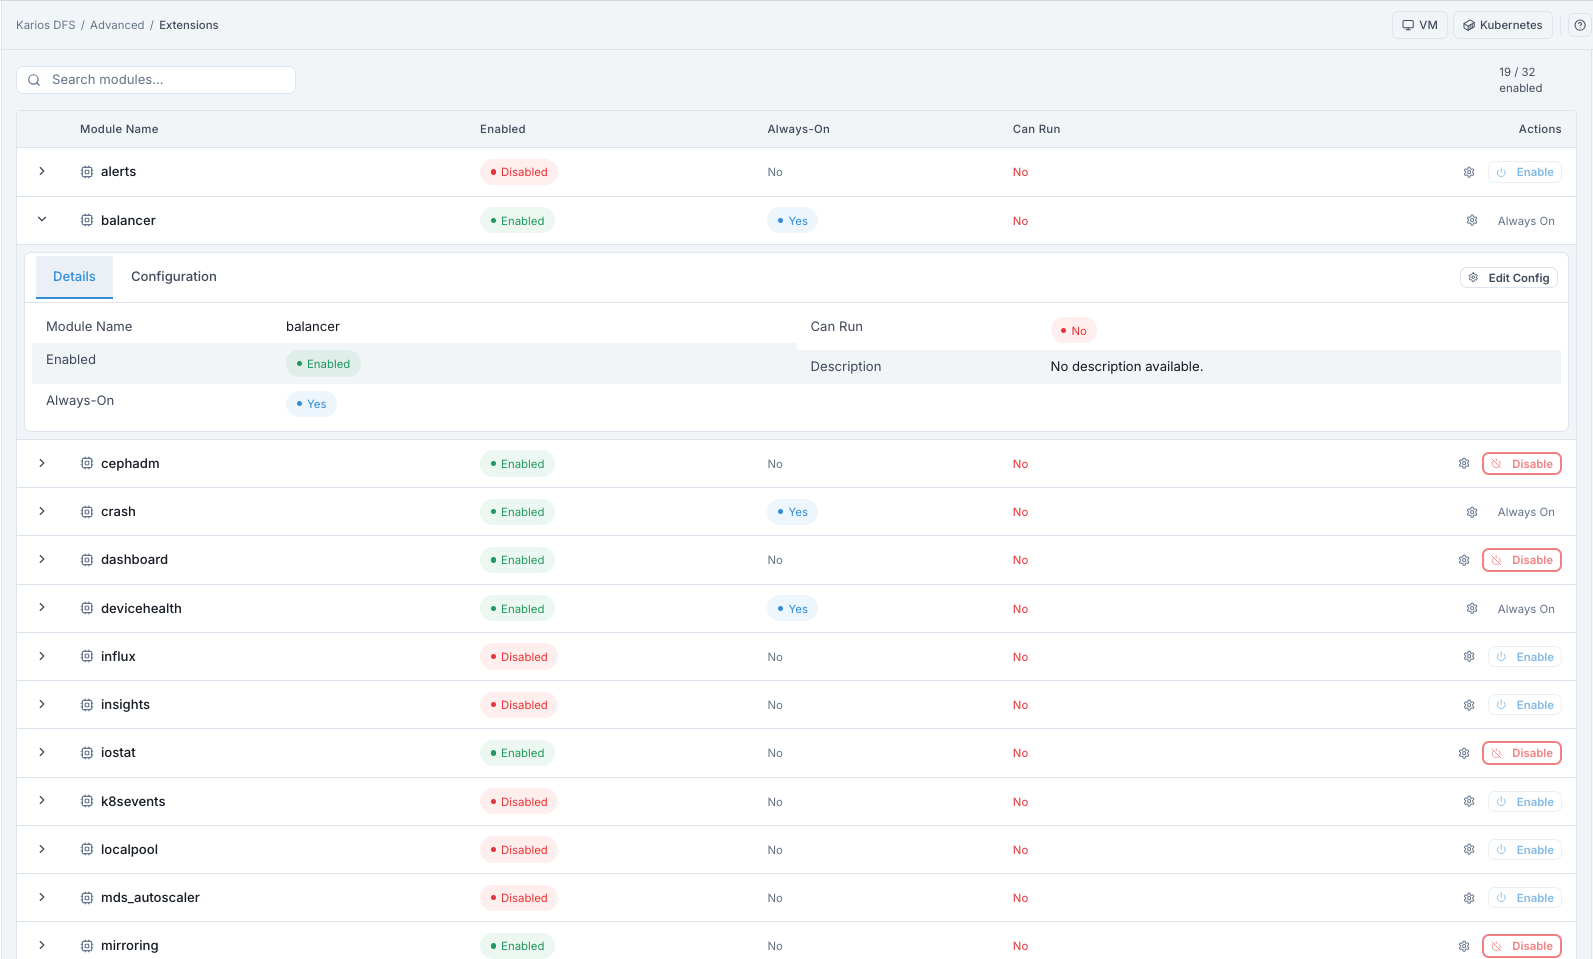
What This Screenshot Shows: Extensions Dashboard And Details (UI Reference; Values Depend On Your Environment).
Actions in This Screen
Search modules...filters module rows in real time.Top-right enabled counter shows active modules versus total available.
Tip
Use Search modules... first, then check Enabled, Always-On, and
Can Run together before changing module state.
Extensions List - Column Reference
Column |
What It Shows |
|---|---|
Module Name |
Module identifier (for example |
Enabled |
Active state (enabled or disabled) |
Always-On |
Required core module marker; cannot be disabled when true |
Can Run |
Dependency readiness on active MGR host |
Actions |
Enable, Disable, or Configure (gear icon) depending on module state |
Module Actions
Action |
Description |
|---|---|
Enable |
Activates the module; some modules expose endpoints or background tasks immediately |
Disable |
Deactivates the module; Always-On modules cannot be disabled from this page |
Configure |
Opens module configuration form for modules that expose settings |
Module List - Reference Examples
Module Name |
Enabled |
Always-On |
What It Does |
|---|---|---|---|
alerts |
No |
No |
Sends alert notifications via SMTP |
balancer |
Yes |
Yes |
Redistributes PGs for even OSD utilization |
prometheus |
Yes |
No |
Exports Ceph metrics in Prometheus format (for example on TCP 9283) |
orchestrator / cephadm |
Yes |
No |
Connects to cephadm or Rook backend for daemon lifecycle management |
crash |
Yes |
Yes |
Collects daemon crash dumps |
dashboard |
Yes |
No |
Web management interface module |
telemetry |
Yes |
No |
Sends anonymized cluster health reports |
pg_autoscaler |
Yes |
No |
Adjusts pool PG counts automatically based on usage |
rbd_support |
Yes |
No |
Enables RBD task support such as mirror/trash operations |
nfs |
Yes |
No |
Provides NFS cluster management via dashboard integration |
rgw |
Yes |
No |
Enables RGW service management integrations |
Module Detail Tabs
Expand any module row using chevron > to view:
DetailstabConfigurationtab
Details Tab - Field Reference:
Field |
What It Shows |
|---|---|
Module Name |
Identifier for the module |
Enabled |
Current active state |
Always-On |
Whether module is protected from disable action |
Can Run |
Dependency readiness on active MGR host |
Description |
Built-in module description (can be unavailable) |
Configuration Tab:
Shows module key/value settings when exposed by module.
Supports
Edit Configwhere configurable keys exist.
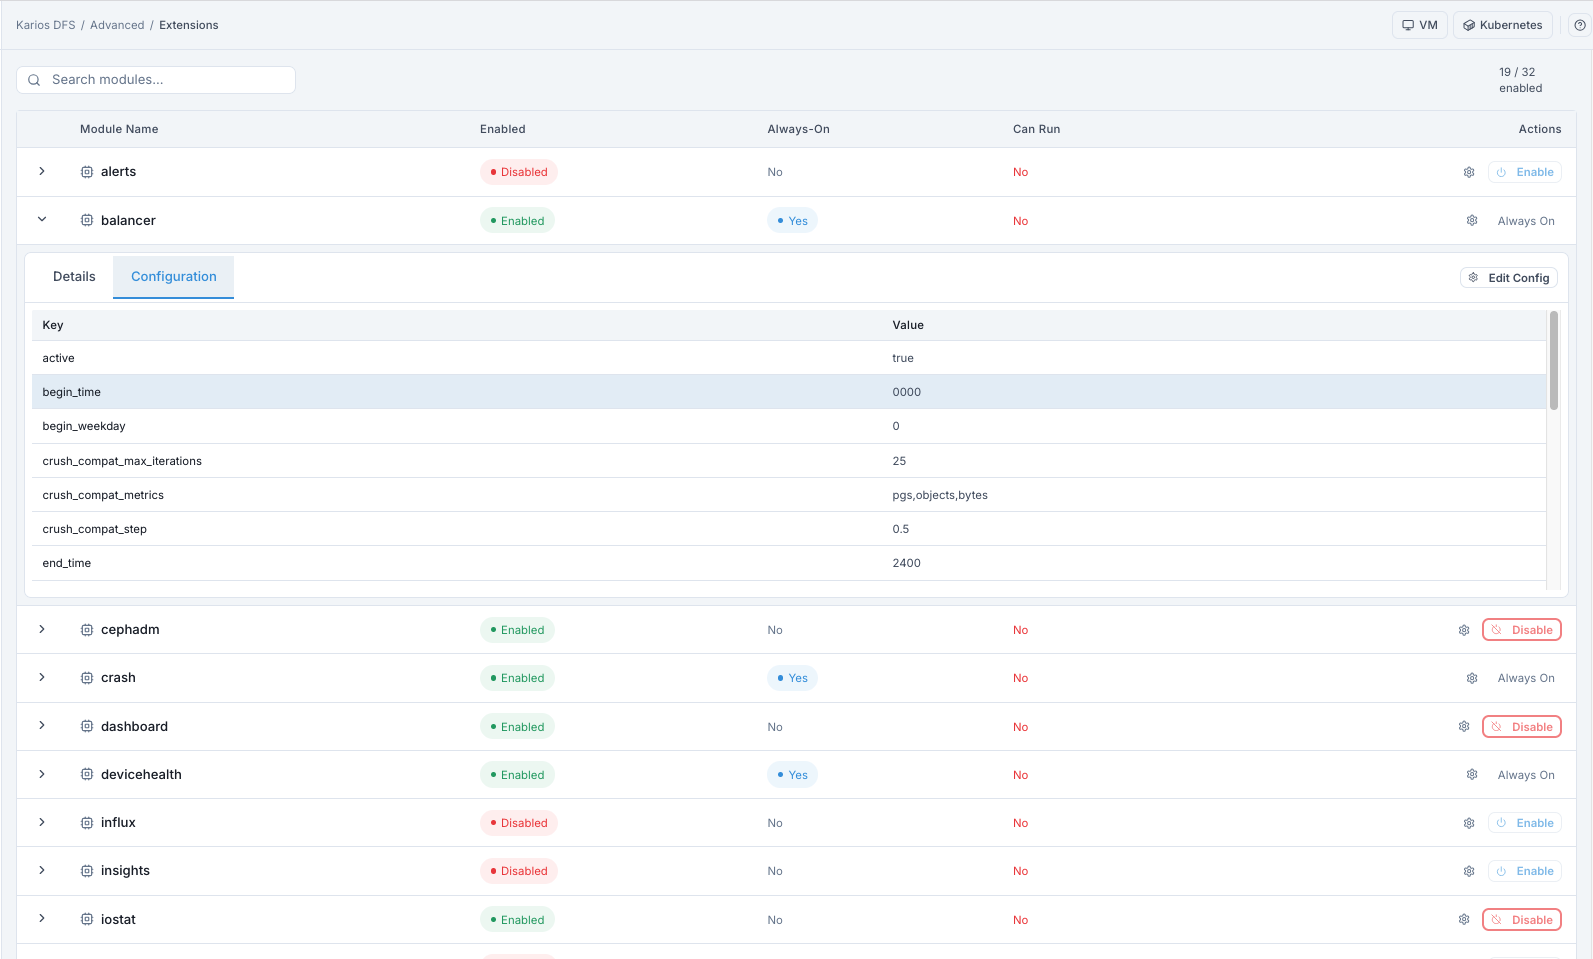
What This Screenshot Shows: Extensions Configuration Details (UI Reference; Values Depend On Your Environment).
Note
Not all modules expose configuration values. Some modules show no editable configuration panel.
How To Enable A Module
Purpose:
To activate optional cluster capability provided by the module.
When to Use:
During feature onboarding after dependency checks.
Steps:
Open
Advanced > Extensions.Find module with
Enabled = Disabled.Confirm
Can Run = Yes.Click
Enable.Confirm action if prompted.
Expected Outcome:
Module state changes to
Enabled.Module functionality becomes active on current MGR daemon.
Some modules expose endpoints/tasks immediately (for example
prometheus).
Tip
Enabled modules run on the active MGR. If MGR failover occurs, enabled modules start on the standby automatically.
How To Disable A Module
Purpose:
To temporarily or permanently stop a non-core module feature.
When to Use:
During controlled maintenance or feature rollback.
Steps:
Find module with
Enabled = Yes.Confirm
Always-On = No.Click
Disable.Confirm action.
Expected Outcome:
Module state changes to
Disabled.Module-provided functionality stops.
Warning
Do not disable dashboard. Disabling it can break Karios DFS interface
access. Disabling balancer stops automatic PG balancing.
How To Configure A Module
Purpose:
To set module-specific behavior required for your environment.
When to Use:
After enabling a module that requires runtime settings.
During operational tuning windows.
Find module row.
Click gear icon, or expand row >
Configuration>Edit Config.Modify configuration values.
Save changes.
When To Configure Modules:
alertsmodule: set SMTP server settings for email delivery.prometheusmodule: verify/export scrape port settings as required.balancermodule: adjust active balancing windows (for example off-peak hours).
Expected Outcome:
Module runs with updated configuration values.
Operational Priorities
Use Module List - Reference Examples above as the canonical module list.
Priority reminders:
dashboard: keep enabled for DFS UI access.prometheus: keep enabled if external monitoring/scraping is required.balancer: disable only in controlled maintenance windows.alerts: configure SMTP values before relying on email notifications.
Tips
If
prometheusis enabled but metrics are missing, verify firewall access to the Prometheus exporter port on the active MGR host.Disable
balanceronly during planned maintenance to avoid unnecessary PG churn.Review
telemetryconfiguration before enabling in air-gapped environments.
Troubleshooting - Extensions
Problem You See |
Most Likely Cause |
What To Do |
|---|---|---|
Cannot find module |
Name mismatch or module unavailable in build |
Search by partial name and verify module availability |
Enable button missing |
Module is always-on or already enabled |
Check |
|
Missing dependencies on active MGR host |
Resolve dependency requirements before enabling |
|
Exporter endpoint blocked or unreachable |
Verify connectivity/firewall to exporter port on active MGR host |
Enabled module feature not working |
Additional module configuration required |
Open |
PGs become uneven after disabling balancer |
Balancer no longer redistributes |
Re-enable |
Note
If issues persist, raise a support ticket via Monitoring > Alerts or the
Karios Support.