Dashboard
Path: Left sidebar > Karios DFS > Dashboard
When to Use:
Before any DFS create, edit, or maintenance action.
During cluster health checks or incident triage.
Purpose:
Use Dashboard as the first-stop health gate before touching pools, file systems, block images, or object services.
Steps:
Open
Karios DFS > Dashboard.Check the health banner, OSD card, monitor quorum, and raw capacity.
If anything is degraded, drill into the linked module before making changes.
Continue only when the cluster is healthy enough for the intended action.
Expected Outcome:
You know whether it is safe to continue and which DFS area needs attention first.
What You See:
Health banners, capacity cards, status counters, and shortcut cards into deeper DFS modules.
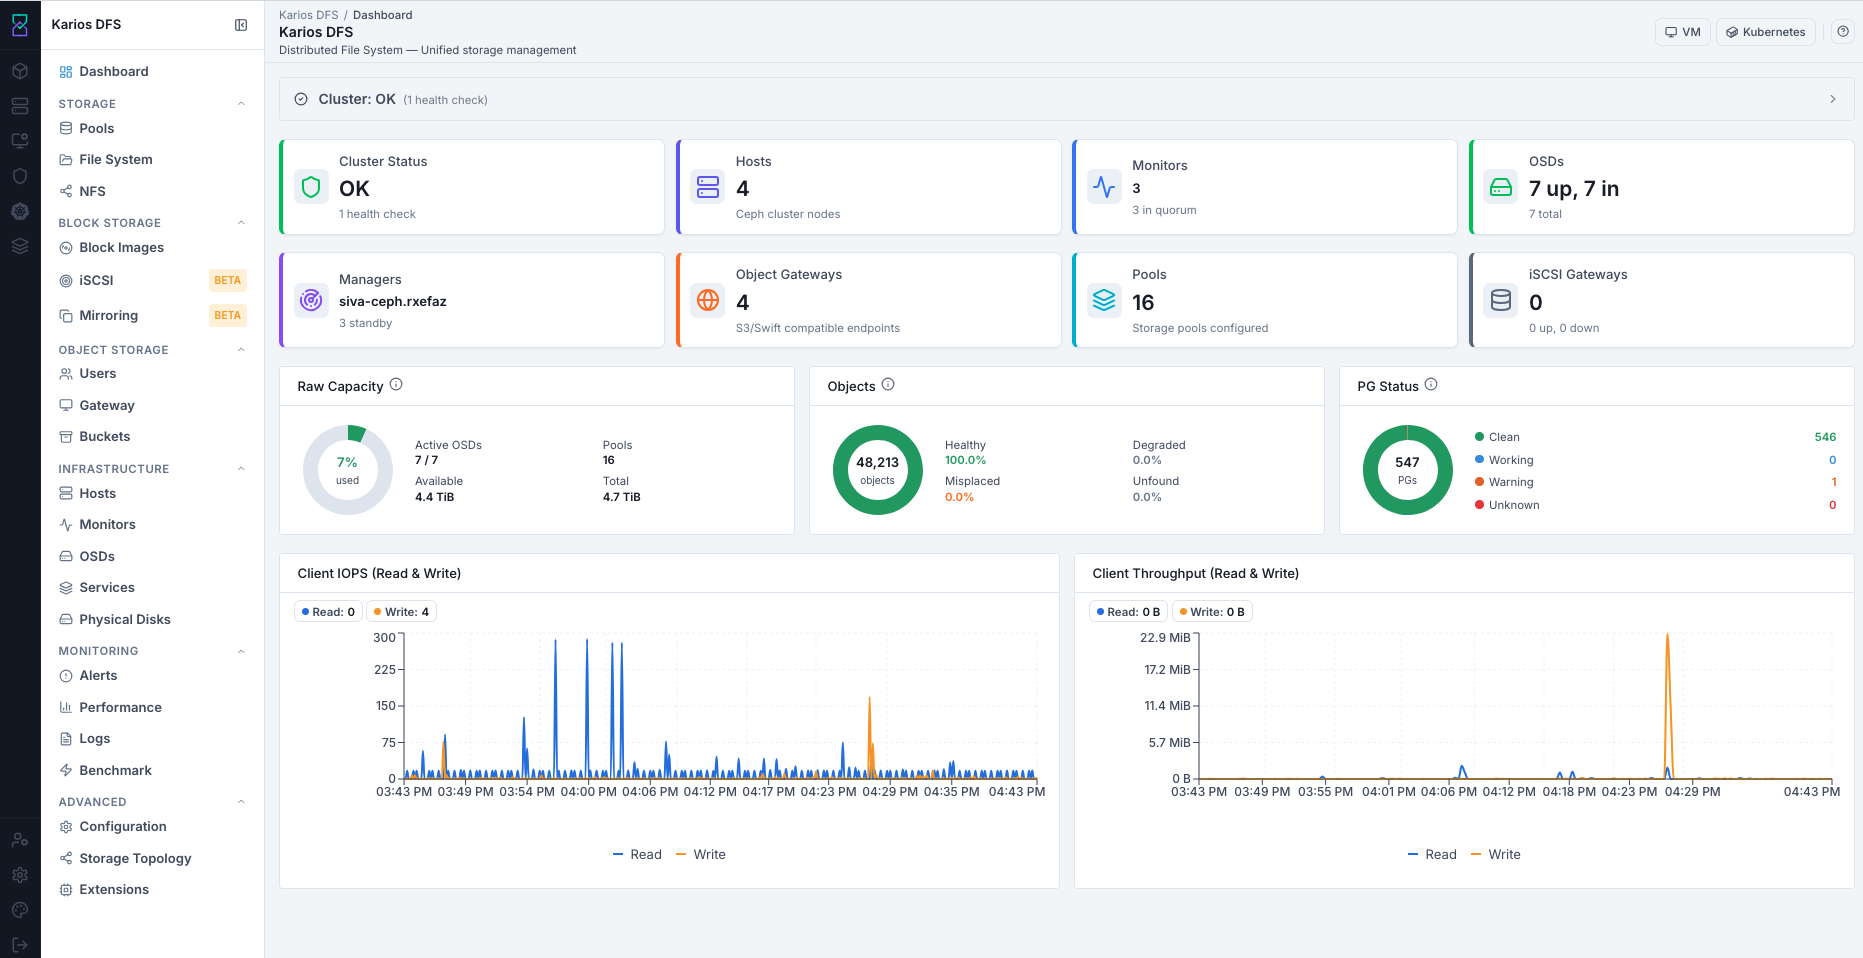
What This Screenshot Shows:
The first dashboard screenshot shows the reference DFS landing page with health and capacity cards. Values depend on your environment.
Actions in This Screen:
Review current cluster health.
Open linked infrastructure or storage pages from the dashboard cards.
Expand health details before continuing.
If this fails:
Stop change activity if health is critical or quorum is unhealthy.
Investigate the linked page for the failing signal.
Return to Dashboard after the issue clears.
The Dashboard is the home screen of Karios DFS. It shows real-time health, capacity, and activity for your storage cluster.
Note
Values visible in this screenshot are examples for reference only. Your cluster will show environment-specific counts and usage values.
Important
Always open Dashboard first. Before creating storage resources, confirm the cluster is healthy. Making changes on a degraded cluster can worsen issues.
How to Read the Dashboard - Step by Step
Run this four-step check before doing any storage operation.
Step 2 - Check the OSDs Stat Card
Look for a format like <Up> up, <In> in - <Total> total.
Example only: 7 up, 7 in - 7 total.
upandinshould match for full health.If
inis lower thanup, data is rebalancing; wait before creating pools.If OSD count is
0, openInfrastructure > OSDsand verify at least one OSD isupandin.
Tip
OSDs are storage daemons managing physical disks. up means running;
in means actively storing data.
Step 3 - Check the Monitors Stat Card
The monitor quorum must have a majority.
For 3 monitors, at least 2 must be in quorum.
If quorum drops below majority, cluster writes are at risk.
Open
Infrastructure > Monitorsbefore proceeding.
Tip
Use an odd monitor count (minimum 3) and keep majority quorum available.
Step 4 - Check Raw Capacity
Review the Raw Capacity donut chart.
Below 80% used: healthy.
80% to 85% used: plan expansion before adding new workload.
Above 85% used: critical threshold; treat expansion as urgent.
Warning
Above 85% raw usage, the cluster can become read-only to protect existing data. Keep usage below 80%.
When all four checks pass, proceed to Storage > Pools.
Dashboard Stat Cards - Reference
Stat cards are also navigation shortcuts.
Every dashboard option/card shown in this section is clickable. When you click
one, Karios DFS redirects you to that option’s corresponding module page.
Use the Click Action column below as the exact destination mapping.
Card |
Shows |
Healthy Value |
Click Action |
|---|---|---|---|
Cluster Status |
Overall health state |
|
Monitoring > Alerts |
Hosts |
Registered host count |
Matches physical node count |
Infrastructure > Hosts |
Monitors |
Monitor daemon count/quorum |
Odd number >= 3 and in quorum |
Infrastructure > Monitors |
OSDs |
Up/in OSD count |
All up and in |
Infrastructure > OSDs |
Managers |
Active + standby manager daemons |
1 active and >= 1 standby |
Infrastructure > Services |
Object Gateways |
Running object gateway instances |
Matches deployed count |
Object Storage > Gateway |
Pools |
Total pool count |
Matches created pools |
Storage > Pools |
iSCSI Gateways |
Active iSCSI gateways |
0 when not configured |
Not available in this guide (feature currently in beta) |
Note
This guide currently covers Block Images under Block Storage. iSCSI and Mirroring workflows are not included because they are currently in beta.
3. Raw Capacity, Objects, and PG Status - Reference
Panel |
Field / State |
Meaning |
Action |
|---|---|---|---|
Raw Capacity |
Donut chart % |
Used vs available raw disk space |
Keep below 80% |
Objects |
Healthy |
All replicas intact |
None |
Objects |
Misplaced |
Data on non-target OSD; auto-resolves |
Monitor if persistent |
Objects |
Degraded |
Fewer replicas than required |
Check Infrastructure > OSDs immediately |
Objects |
Unfound |
No accessible copy; data-loss risk |
Escalate immediately |
PG Status |
|
Replicas in sync; normal state |
None |
PG Status |
|
Replicas missing |
Check Infrastructure > OSDs |
PG Status |
|
Data restoring after OSD event |
Monitor; normal during recovery |
PG Status |
|
OSD status update not received |
Check Infrastructure > OSDs |
Tip
For deeper analysis, use Monitoring > Performance. Dashboard charts are for quick health review.