Full K-Shield Workflow
Use this guide when you need the complete K-Shield workflow shown in the current screenshots: dashboard review, VM-level scanning, managed-node review, monitoring, compliance validation, and report downloads. New users should follow the sections in order: start with Node-Level Dashboard, review VM-Level Dashboard, complete any VM scan or schedule review, then open the managed-node tabs — FIPS Compliance, Scan's Overview, History, Monitoring, and Audit stream.
1. Node-Level Dashboard
When to Use:
Use this first when reviewing the node-level dashboard shown below.
Purpose:
Review the node-level dashboard cards, charts, node table, and top vulnerabilities.
Steps:
Open
K-Shield -> Dashboard.Select
Node level.Review category score cards across the top.
Review fleet summary cards.
Review the trend chart, risk distribution, security nodes table, and top vulnerabilities.
Select a managed node if you need details.
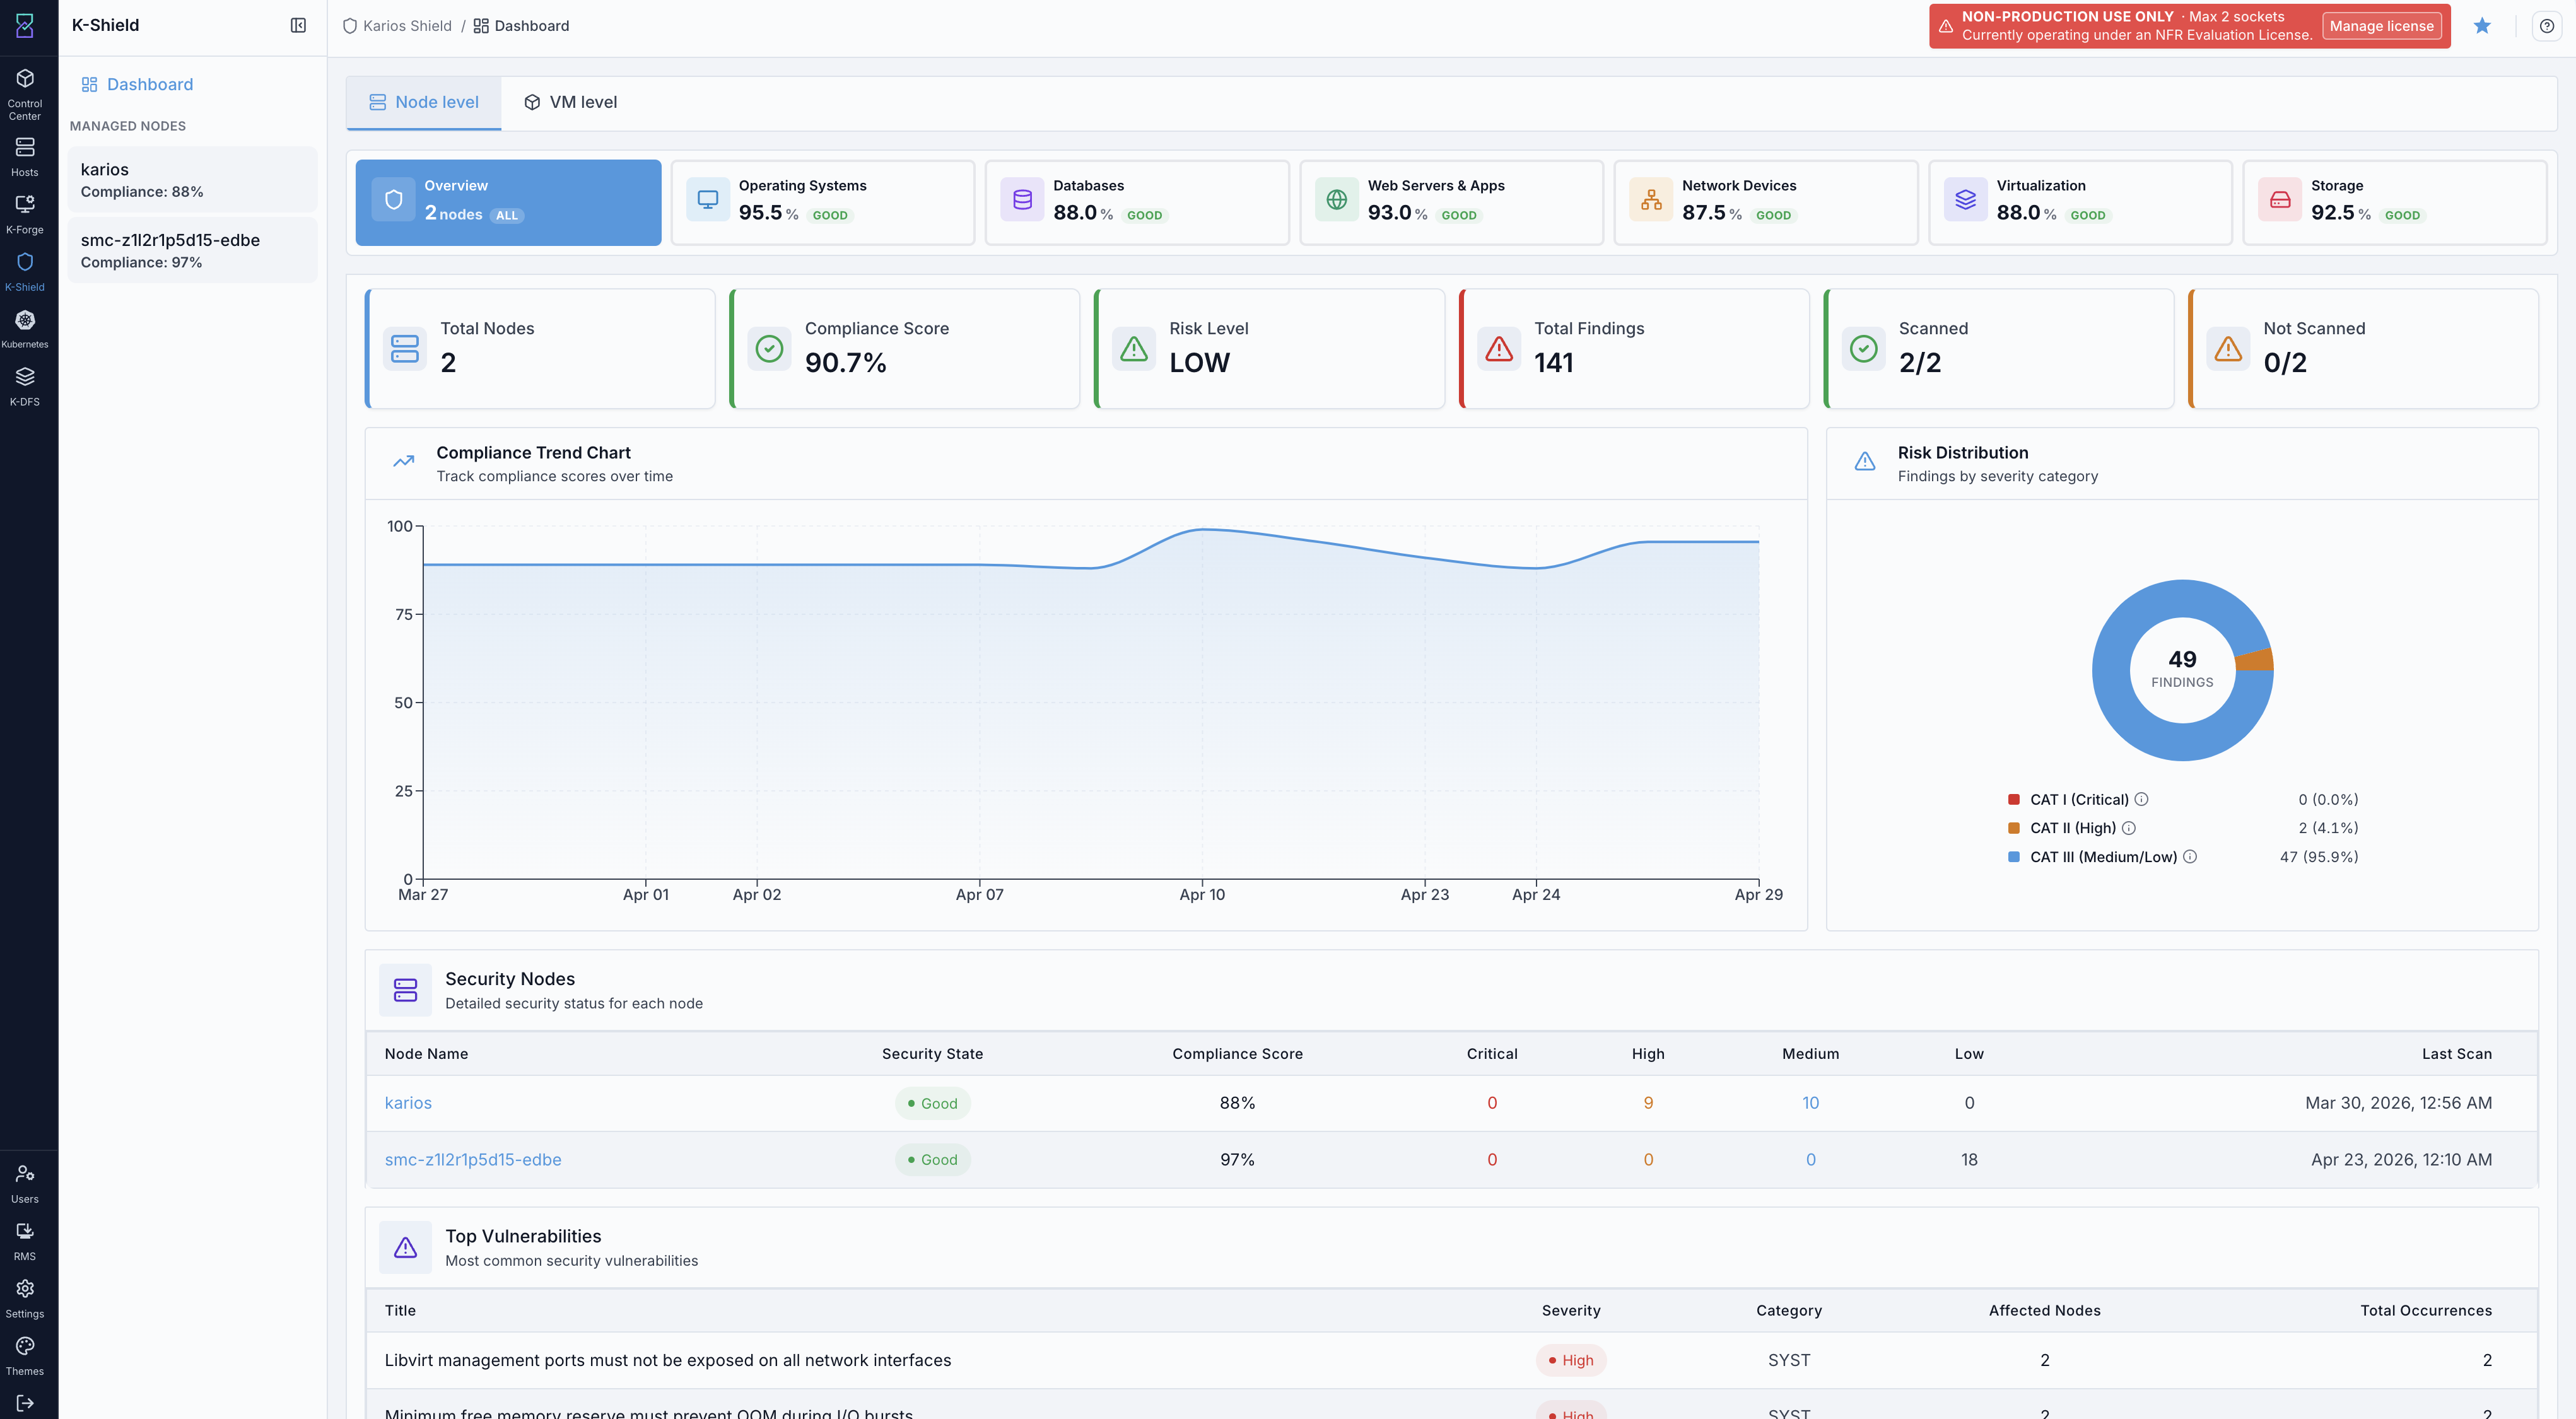
K-Shield node-level dashboard.
What this screenshot shows:
Managed nodes in the left panel.
Node levelselected on the dashboard.Node levelandVM leveltabs at the top of the dashboard.Category cards for operating systems, databases, web servers and apps, network devices, virtualization, and storage.
Fleet cards for
Total Nodes,Compliance Score,Risk Level,Total Findings,Scanned, andNot Scanned.Compliance Trend ChartandRisk Distribution.Security NodesandTop Vulnerabilitiestables.
What you can do from this screen:
Identify scanned and not-scanned node counts.
Compare node compliance scores.
Review CAT I, CAT II, and CAT III distribution.
Open a managed node from the table or left panel.
Use the selected managed-node card in the left panel to confirm which node will open.
Use top vulnerabilities to find repeated issues across nodes.
As a new user, start here before opening managed-node details.
Expected Outcome:
The node-level dashboard information is visible and readable.
Managed nodes are available for selection.
If this fails:
Refresh the dashboard.
Confirm managed nodes appear in the left panel.
Confirm the
Node leveltab is selected.
2. VM-Level Dashboard
When to Use:
Use this when reviewing the VM-level dashboard shown below.
Purpose:
Review the VM list, VM status, K-Shield responding status, compliance score, and last scan data.
Steps:
Open
K-Shield -> Dashboard.Select
VM level.Open
VM List.Review VM status and K-Shield responding status.
Check compliance score and last scan details.
Select one or more eligible VMs when a scan is required.
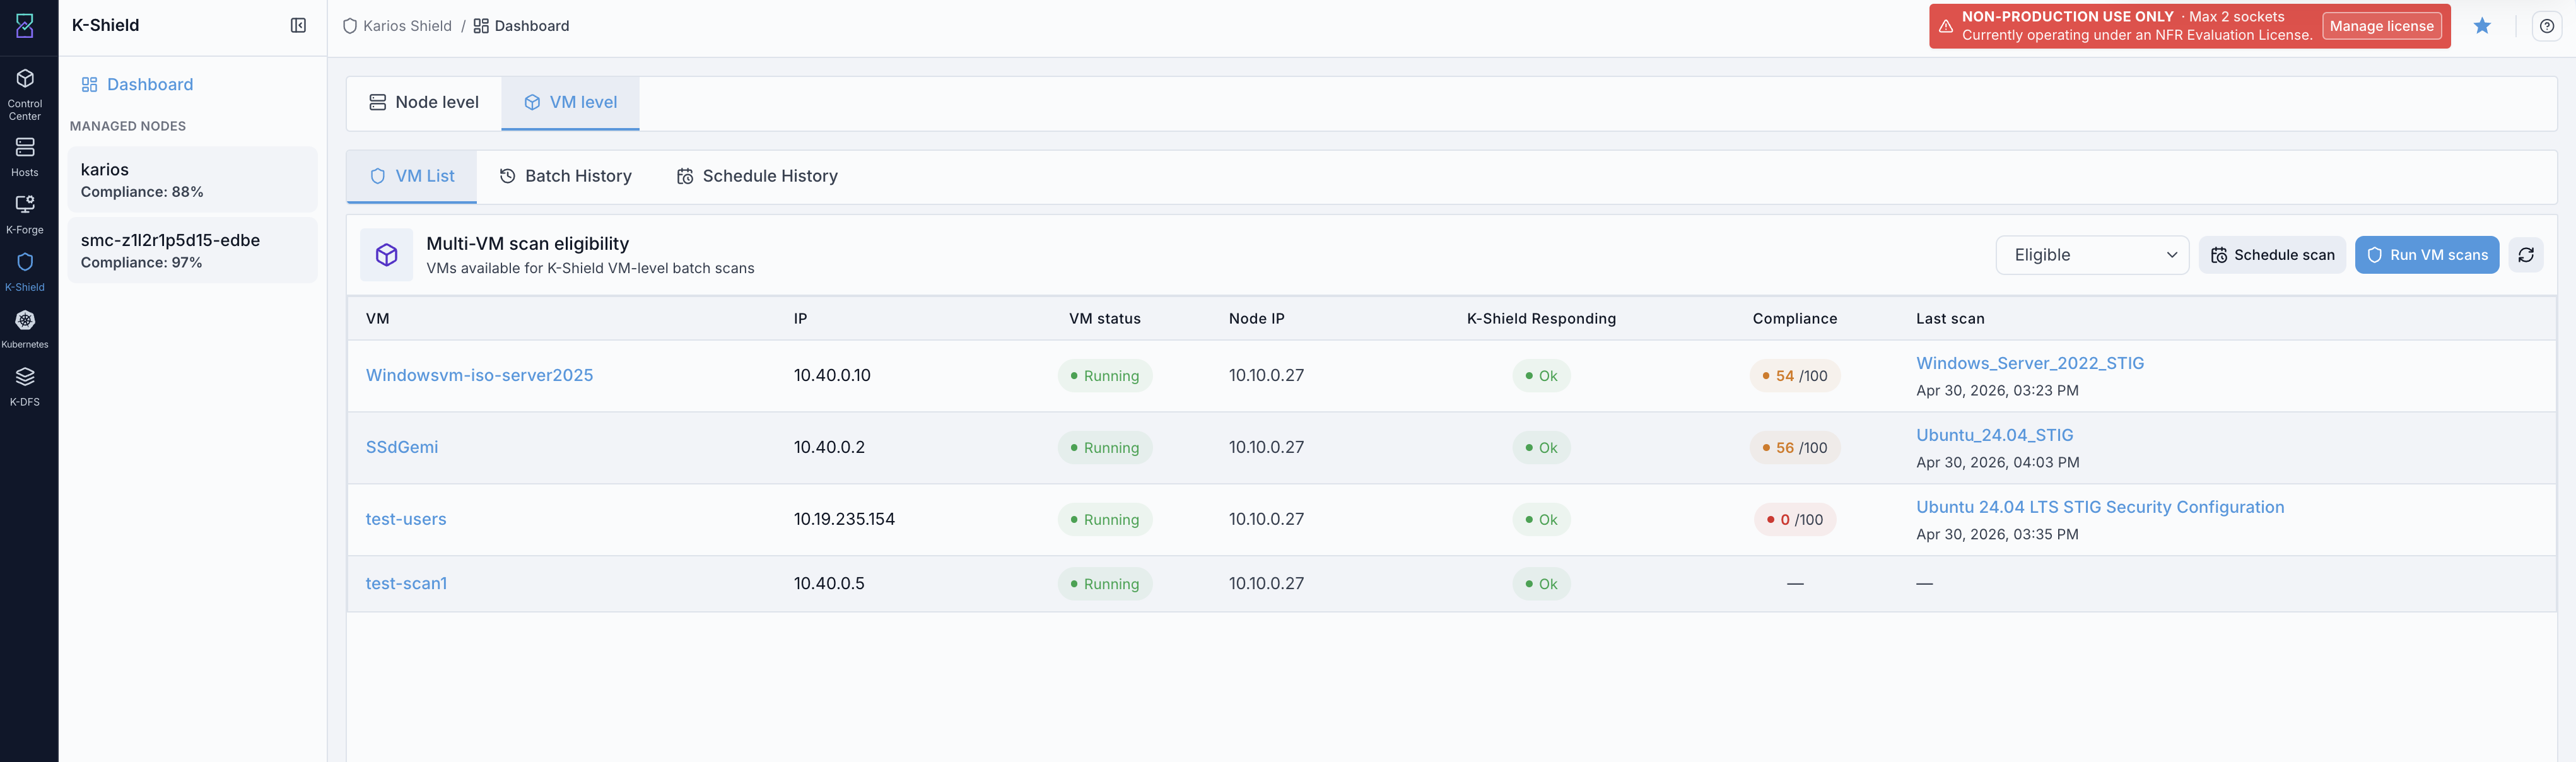
K-Shield VM-level dashboard.
What this screenshot shows:
VM levelselected on the dashboard.VM List,Batch History, andSchedule Historytabs.VM scan eligibility table.
VM name, IP, VM status, node IP, K-Shield responding state, compliance score, and last scan.
Eligibility filter dropdown,
Schedule scanbutton,Run VM scansbutton, and refresh icon.
What you can do from this screen:
Find VMs shown in the eligibility table.
Confirm whether K-Shield is responding for each VM.
Use row checkboxes to select VMs before running or scheduling scans.
Run immediate VM scans.
Schedule VM scans.
Use the refresh icon to reload VM eligibility.
Open batch and schedule history.
As a new user, review this after the node-level dashboard so both dashboard scopes are covered.
Expected Outcome:
VM-level dashboard information is visible and readable.
VM scan actions are visible on the page.
If this fails:
Refresh the VM list.
Confirm the
VM leveltab is selected.Confirm VM rows are visible.
3. Run VM Scans
When to Use:
Use this when selecting VMs from the VM list shown below.
Purpose:
Select VMs and open the scan action shown on the VM-level dashboard.
Important
K-Shield enablement runs on the target VM during a scan, so confirm these reachability and account prerequisites first.
Ubuntu / Linux
The VM must be reachable over SSH on port 22.
Use
rootor a user withsudoprivileges.Package repositories must be reachable from the VM; Ubuntu/Debian systems require access to
aptrepositories.systemdmust be available, because the installer enables and starts K-Shield withsystemctl.Sufficient free space must be available on
/and/tmpfor package installation.
Windows
The VM must be reachable from the management node by at least one supported method: WinRM on port 5985, or SSH on port 22 if Windows OpenSSH access is already enabled.
Use an Administrator-level account.
The VM must be able to download the installer from the configured installer source; if the installer is hosted externally, outbound HTTP/HTTPS access may be required.
Windows Firewall and network rules must allow the selected management path (WinRM and/or SSH) and allow the service to be installed and started.
Steps:
Open
K-Shield -> Dashboard -> VM level.Open
VM List.Select one or more VMs.
Click
Run VM scans.Select the correct security profile for each VM.
Choose
Run nowwhen immediate validation is required.
VM scan selection from the VM-level dashboard.
What this screenshot shows:
Eligible VM rows selected for scanning.
Row checkboxes showing selected VMs.
VM status and K-Shield responding status.
Run VM scansaction available.Schedule scanaction and refresh icon beside the scan action.Compliance score and last scan information.
What you can do from this screen:
Select VMs for a batch scan.
Filter to eligible VMs.
Open the VM scan dialog.
Use the refresh icon if eligibility or scan state looks stale.
Refresh scan eligibility.
Expected Outcome:
Selected VM rows are clear.
The
Run VM scansaction is available.
If this fails:
Confirm at least one VM row is selected.
Refresh the VM list.
Confirm the
Run VM scansbutton is visible.
4. Start or Schedule VM Scan
When to Use:
Use this after the scan dialog shown below opens.
Purpose:
Review selected VMs, profile selectors, and run or schedule controls.
Steps:
Confirm the selected VMs in the dialog.
Select the correct security profile for each VM.
Choose
Run nowfor immediate execution.Choose
Schedulefor future execution.If scheduling, select the date and time.
Click the visible scan or schedule action.
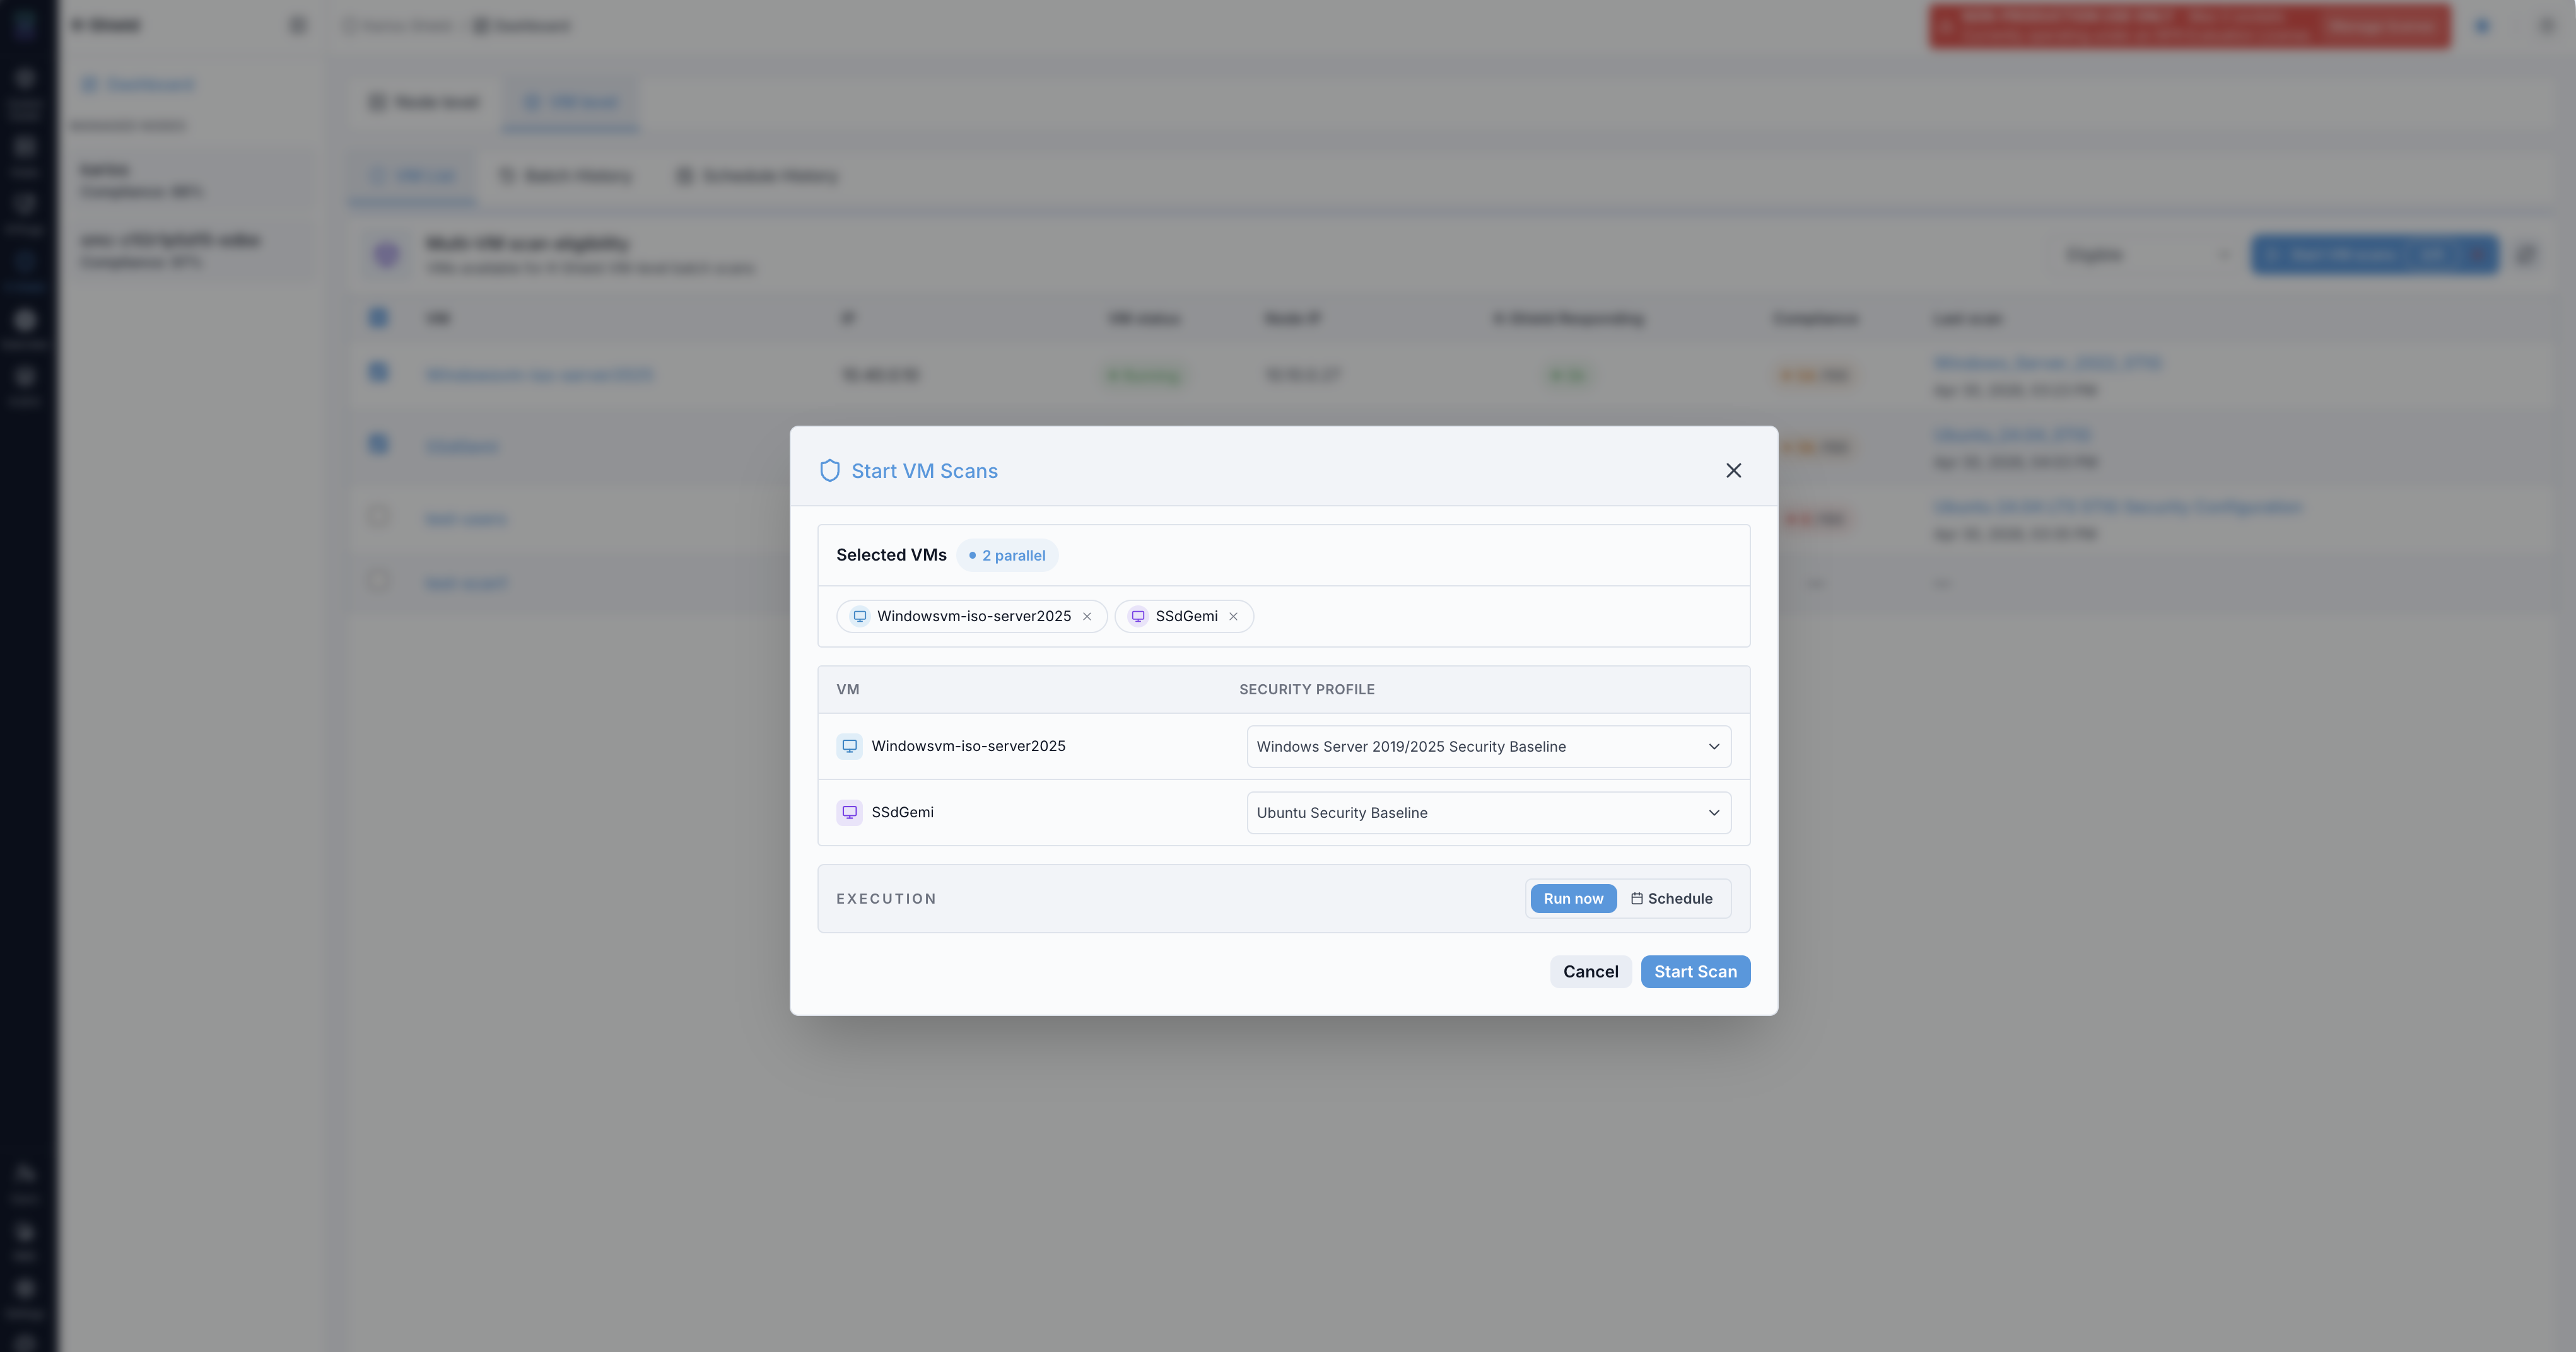
Start VM Scans dialog.
What this screenshot shows:
Selected VMs.
Selected VM chips at the top of the dialog.
Per-VM security profile selectors.
Execution controls for
Run nowandSchedule.Date and time fields for scheduled execution.
Close icon in the upper-right of the dialog.
Final
Schedule Scanaction.
What you can do from this screen:
Assign different profiles to different VMs.
Run the selected scans immediately.
Schedule scans for the selected date and time.
Use the close icon or
Cancelif the selected VMs or profiles are wrong.Cancel if the wrong VMs or profiles were selected.
Expected Outcome:
Selected VMs and profile selectors are visible.
Run and schedule controls are visible.
If this fails:
Reopen the dialog.
Confirm selected VMs are listed.
Confirm profile selectors are visible.
Confirm date and time fields are visible when
Scheduleis selected.
5. Schedule VM Scan Selection
When to Use:
Use this when the schedule selection screen shown below is open.
Purpose:
Review the schedule selection controls for the selected VMs.
Steps:
Select eligible VMs from
VM List.Click
Schedule scan.Confirm selected VMs.
Select profiles.
Select date and time.
Save the schedule.

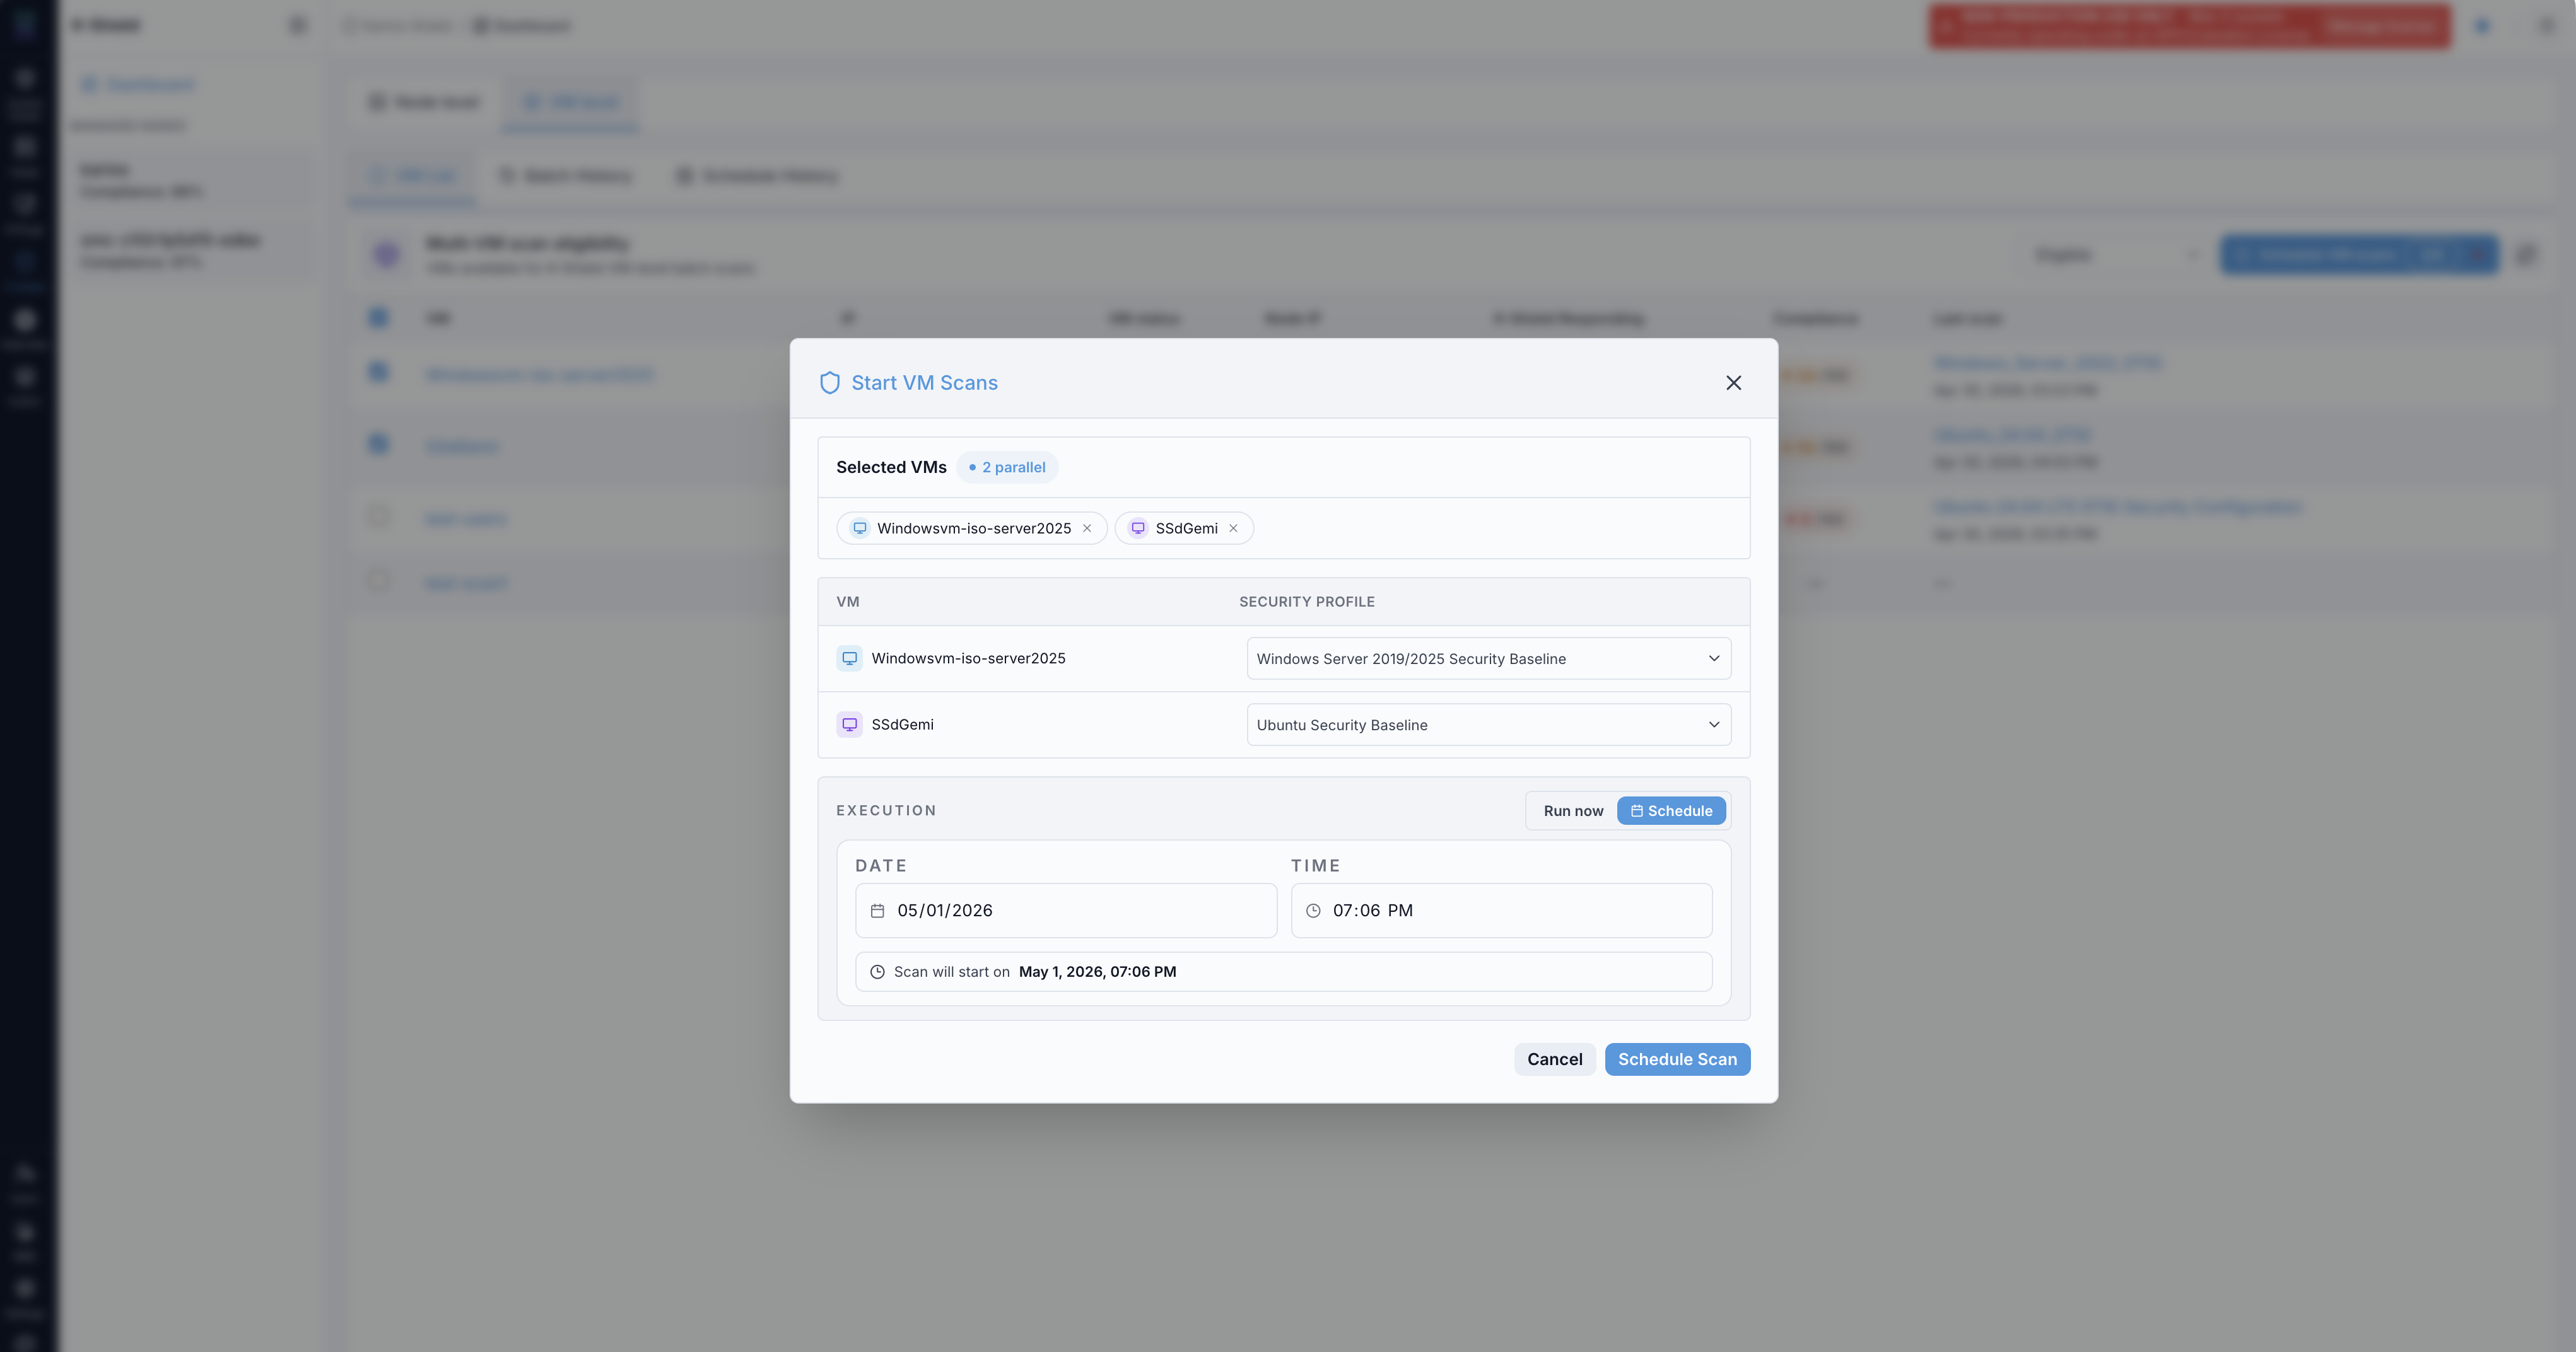
VM scan schedule selection.
What this screenshot shows:
Selected VM scan schedule flow.
Selected VM chips and security profile selectors.
Security profile selection.
Schedule controls for date and time.
Canceland final schedule action.
What you can do from this screen:
Prepare a scheduled VM scan.
Review schedule controls.
Confirm the selected baseline profile before saving.
Cancel before saving if the selected VM or time is incorrect.
Expected Outcome:
Schedule controls are visible.
Selected VM scan details are visible.
If this fails:
Confirm at least one VM is selected.
Confirm the selected time is valid.
Refresh and retry.
6. VM Batch History
When to Use:
Use this when viewing the VM batch history screen shown below.
Purpose:
Review VM scan batch records.
Steps:
Open
K-Shield -> Dashboard -> VM level.Open
Batch History.Review scan batch status.
Confirm included VMs.
Check start and completion times.
Review rows that need attention.
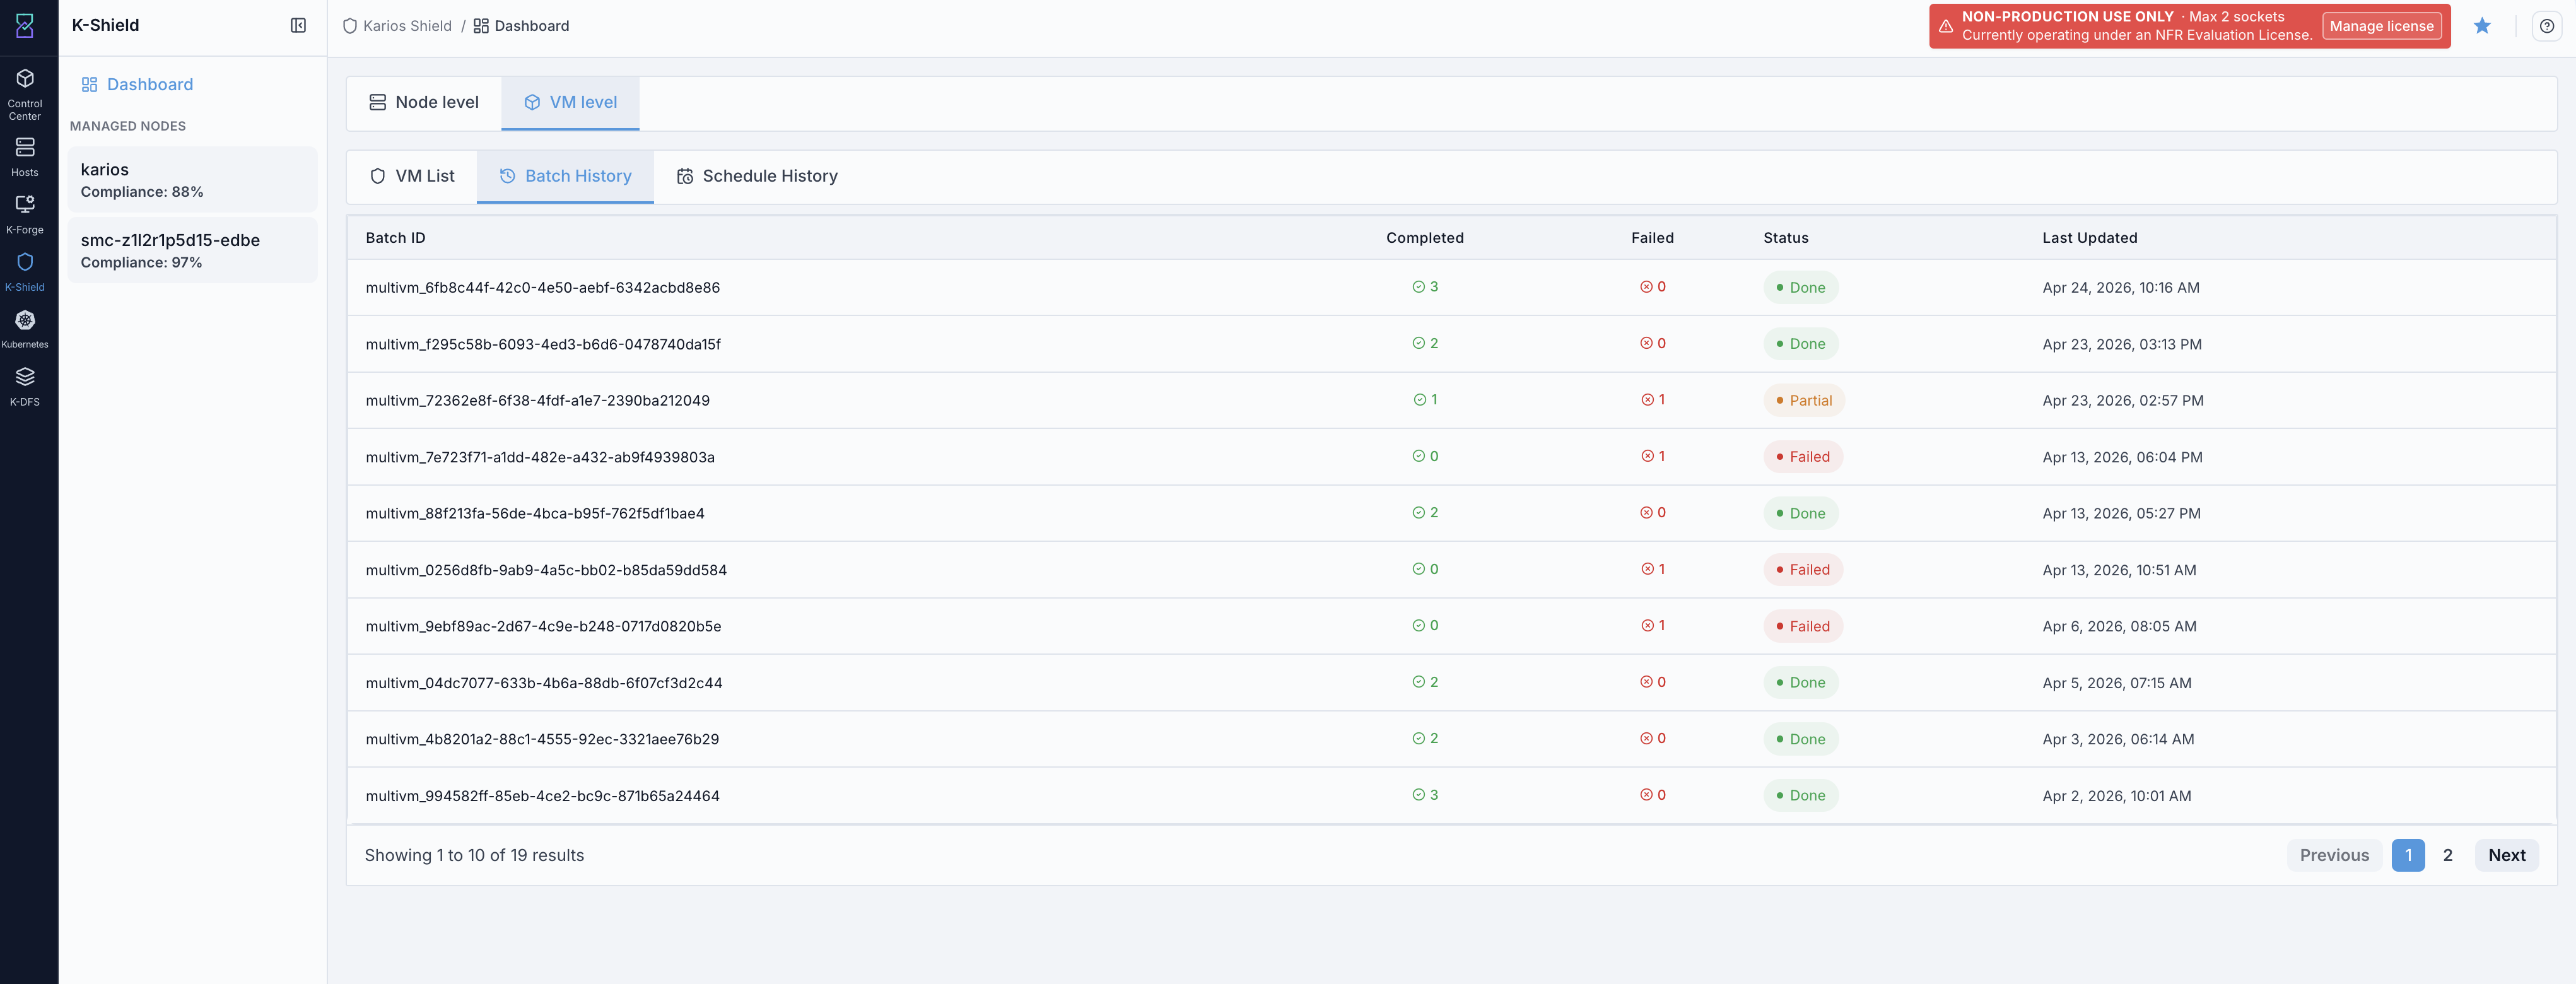
VM batch history.
What this screenshot shows:
VM scan batch history.
Batch execution records.
Status and timing information.
Batch history tab selected in the VM-level view.
What you can do from this screen:
Confirm that a VM scan batch started.
Review which VMs were included.
Review visible status badges.
Identify rows with incomplete or non-success status.
Review batch status information.
Expected Outcome:
VM batch records are visible.
Batch status and timing information are visible.
If this fails:
Refresh batch history.
Confirm the
Batch Historytab is selected.Confirm batch rows are visible.
7. VM Schedule History
When to Use:
Use this when viewing the VM schedule history screen shown below.
Purpose:
Review scheduled VM scan records.
Steps:
Open
K-Shield -> Dashboard -> VM level.Open
Schedule History.Confirm the scheduled scan appears.
Review schedule time and target VMs.
Check completed scheduled runs after execution time.
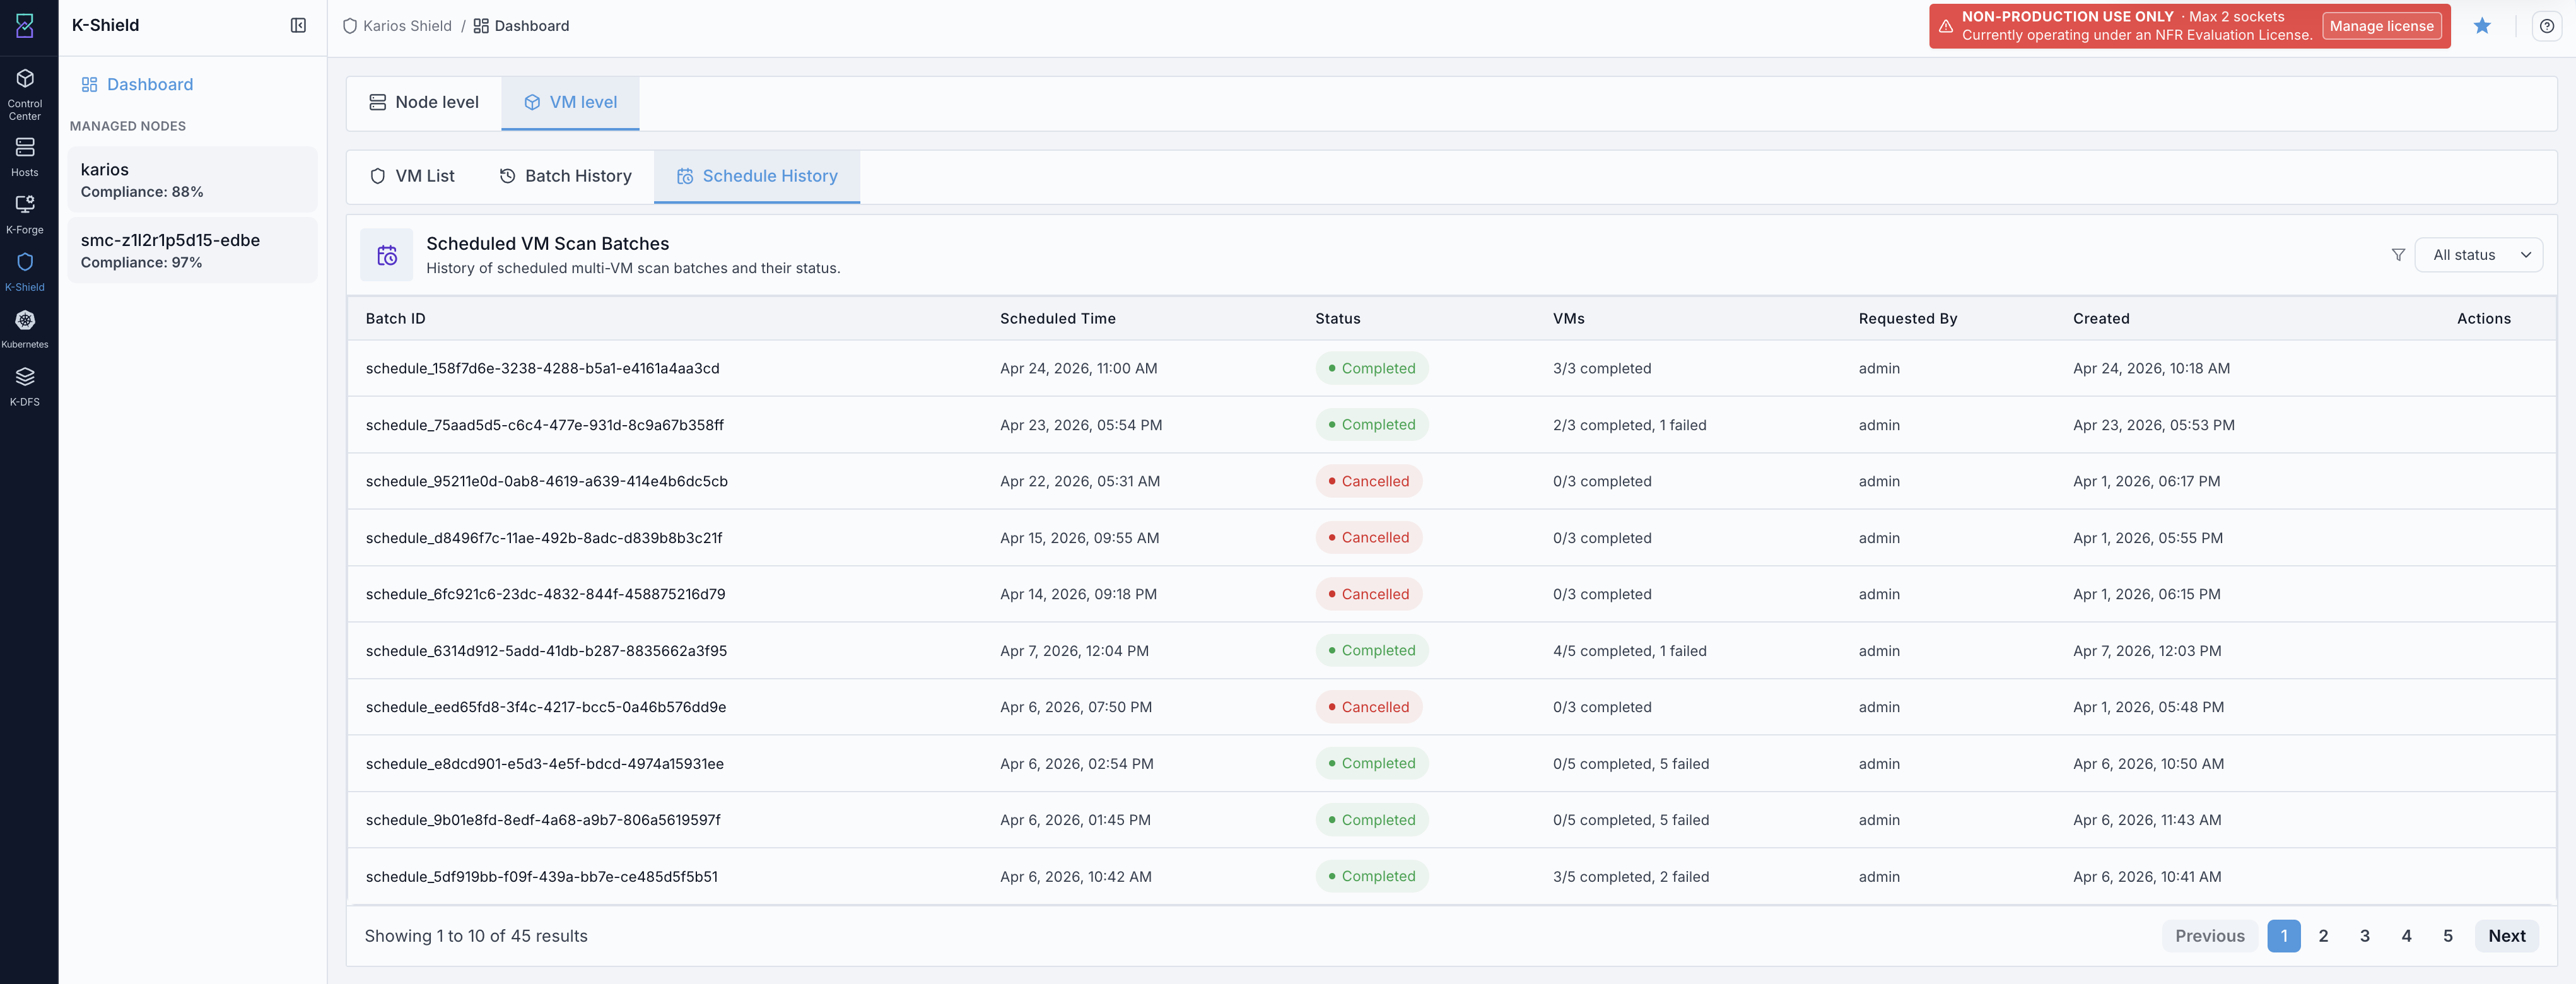
VM schedule history.
What this screenshot shows:
Scheduled VM scan records.
Schedule history tab.
Scheduled or completed execution information.
Schedule history tab selected in the VM-level view.
What you can do from this screen:
Verify scheduled scans.
Review past scheduled scan runs.
Confirm scheduled scan records.
Use visible status/timing fields to confirm the scheduled entry.
Expected Outcome:
Schedule history records are visible.
Schedule details are readable.
If this fails:
Refresh schedule history.
Confirm the
Schedule Historytab is selected.Confirm schedule rows are visible.
8. Dashboard Help
When to Use:
Use this when a user needs help interpreting K-Shield dashboard fields.
Purpose:
Explain the node-level and VM-level dashboard areas without leaving the K-Shield workflow.
Steps:
Open
K-Shield -> Dashboard.Click the help icon.
Review dashboard guidance.
Return to the dashboard.
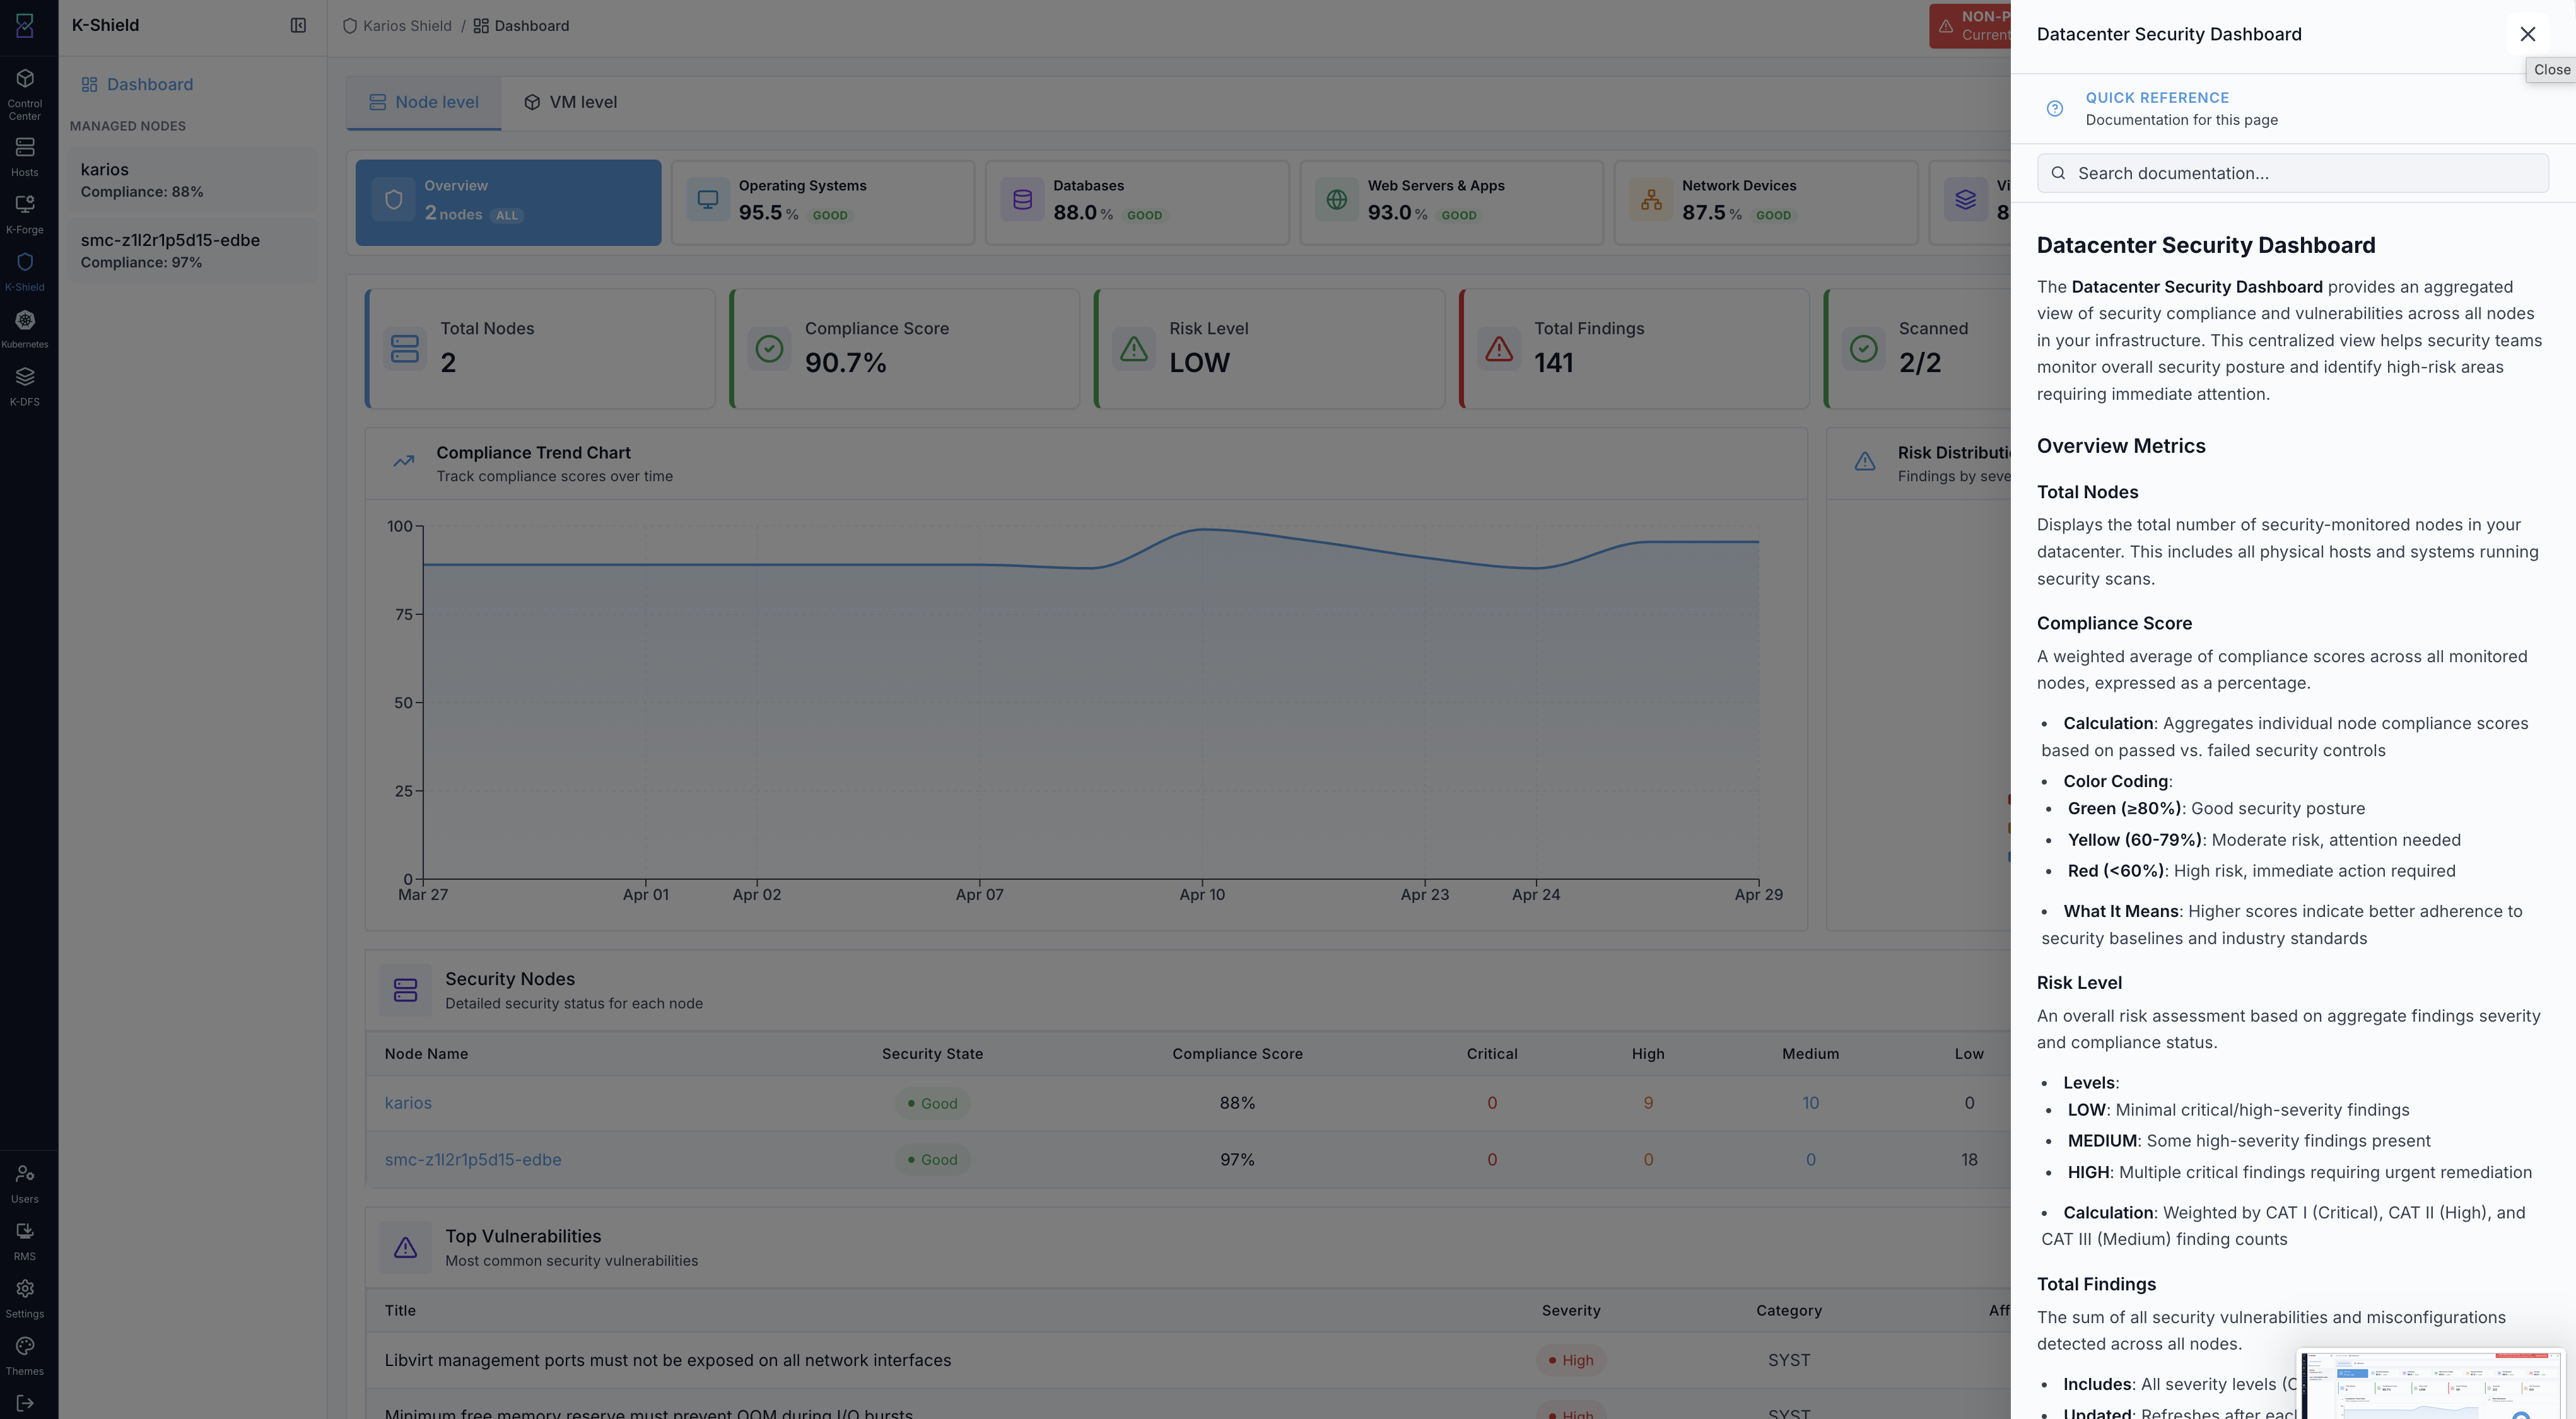
K-Shield dashboard help.
What this screenshot shows:
Dashboard help content.
Guidance for node-level and VM-level dashboard review.
Help icon that opens the dashboard guidance.
What you can do from this screen:
Confirm what dashboard fields mean.
Help a new user understand the workflow.
Use the help icon when a dashboard field is unfamiliar.
Return to dashboard review after reading guidance.
Expected Outcome:
Dashboard help content is visible.
If this fails:
Close and reopen the help panel.
Refresh the page.
Confirm the help icon is visible.
Managed Node Tabs
Selecting a managed node from the Node level dashboard opens a tabbed page:
FIPS Compliance, Scan's Overview, History, Monitoring, and Audit stream.
Start Security Scan is available from every tab. The sections below follow the tab
order shown in the UI: FIPS Compliance, Scan's Overview, History,
Monitoring, and Audit stream. The Audit stream tab is optional — use it only
if you forward this node’s audit logs to a SIEM.
Important
A new managed node has no data until a scan runs. Run a security scan first (see
12. Start Security Scan below, or the 5-10 minute path in
K-Shield Quick Tasks); the Scan's Overview, FIPS Compliance,
and History tabs populate from scan results. A healthy node typically shows
System Status = COMPLIANT, CAT I Issues = 0, a FIPS status of PASS, and
Rootkit Hunter CLEAN.
Terms used in this section:
CAT I/CAT II/CAT III: STIG severity categories —CAT Iis the most severe (fix first),CAT IIIthe least.STIG: Security Technical Implementation Guide — the hardening baseline the node is scanned against.FIPS 140-3: cryptographic-module standard; theFIPS Compliancetab scores the node against this profile.XCCDF profile ID: the exact machine-readable ID of the scanned compliance profile.Nmap: the network port scanner behind theMonitoringport results.Rootkit Hunter(rkhunter): the rootkit / local-threat scanner shown underMonitoring.CVSS/CWE ID: the vulnerability severity score and weakness classifier shown per finding.SIEM: Security Information and Event Management system; theAudit streamtab forwards audit logs to it.mTLS: mutual TLS (both sides present certificates) — anAudit streamtransport option.
For shared platform terms, see Glossary.
9. FIPS Compliance
Note
If this tab (and Scan's Overview / History) is empty, no scan has run yet — run
one first (see 12. Start Security Scan).
When to Use:
Use this when validating the node against the FIPS 140-3 security profile on the FIPS Compliance tab.
Purpose:
Review the FIPS score, cryptographic validation, scan outcome, severity breakdown, and findings.
Steps:
Open the
FIPS Compliancetab.Review the score gauge and
STATUS.Review the
PASSED,FAILED,NOT APPLICABLE,COULD NOT EVALUATE, andLAST SCANcards.Review
FIPS 140-3 Cryptographic Validation.Review
Scan OutcomeandSeverity Breakdown.Open
Findingsand filter byPassed/Failed/Not applicableand by severity.Review each rule and its rule ID.
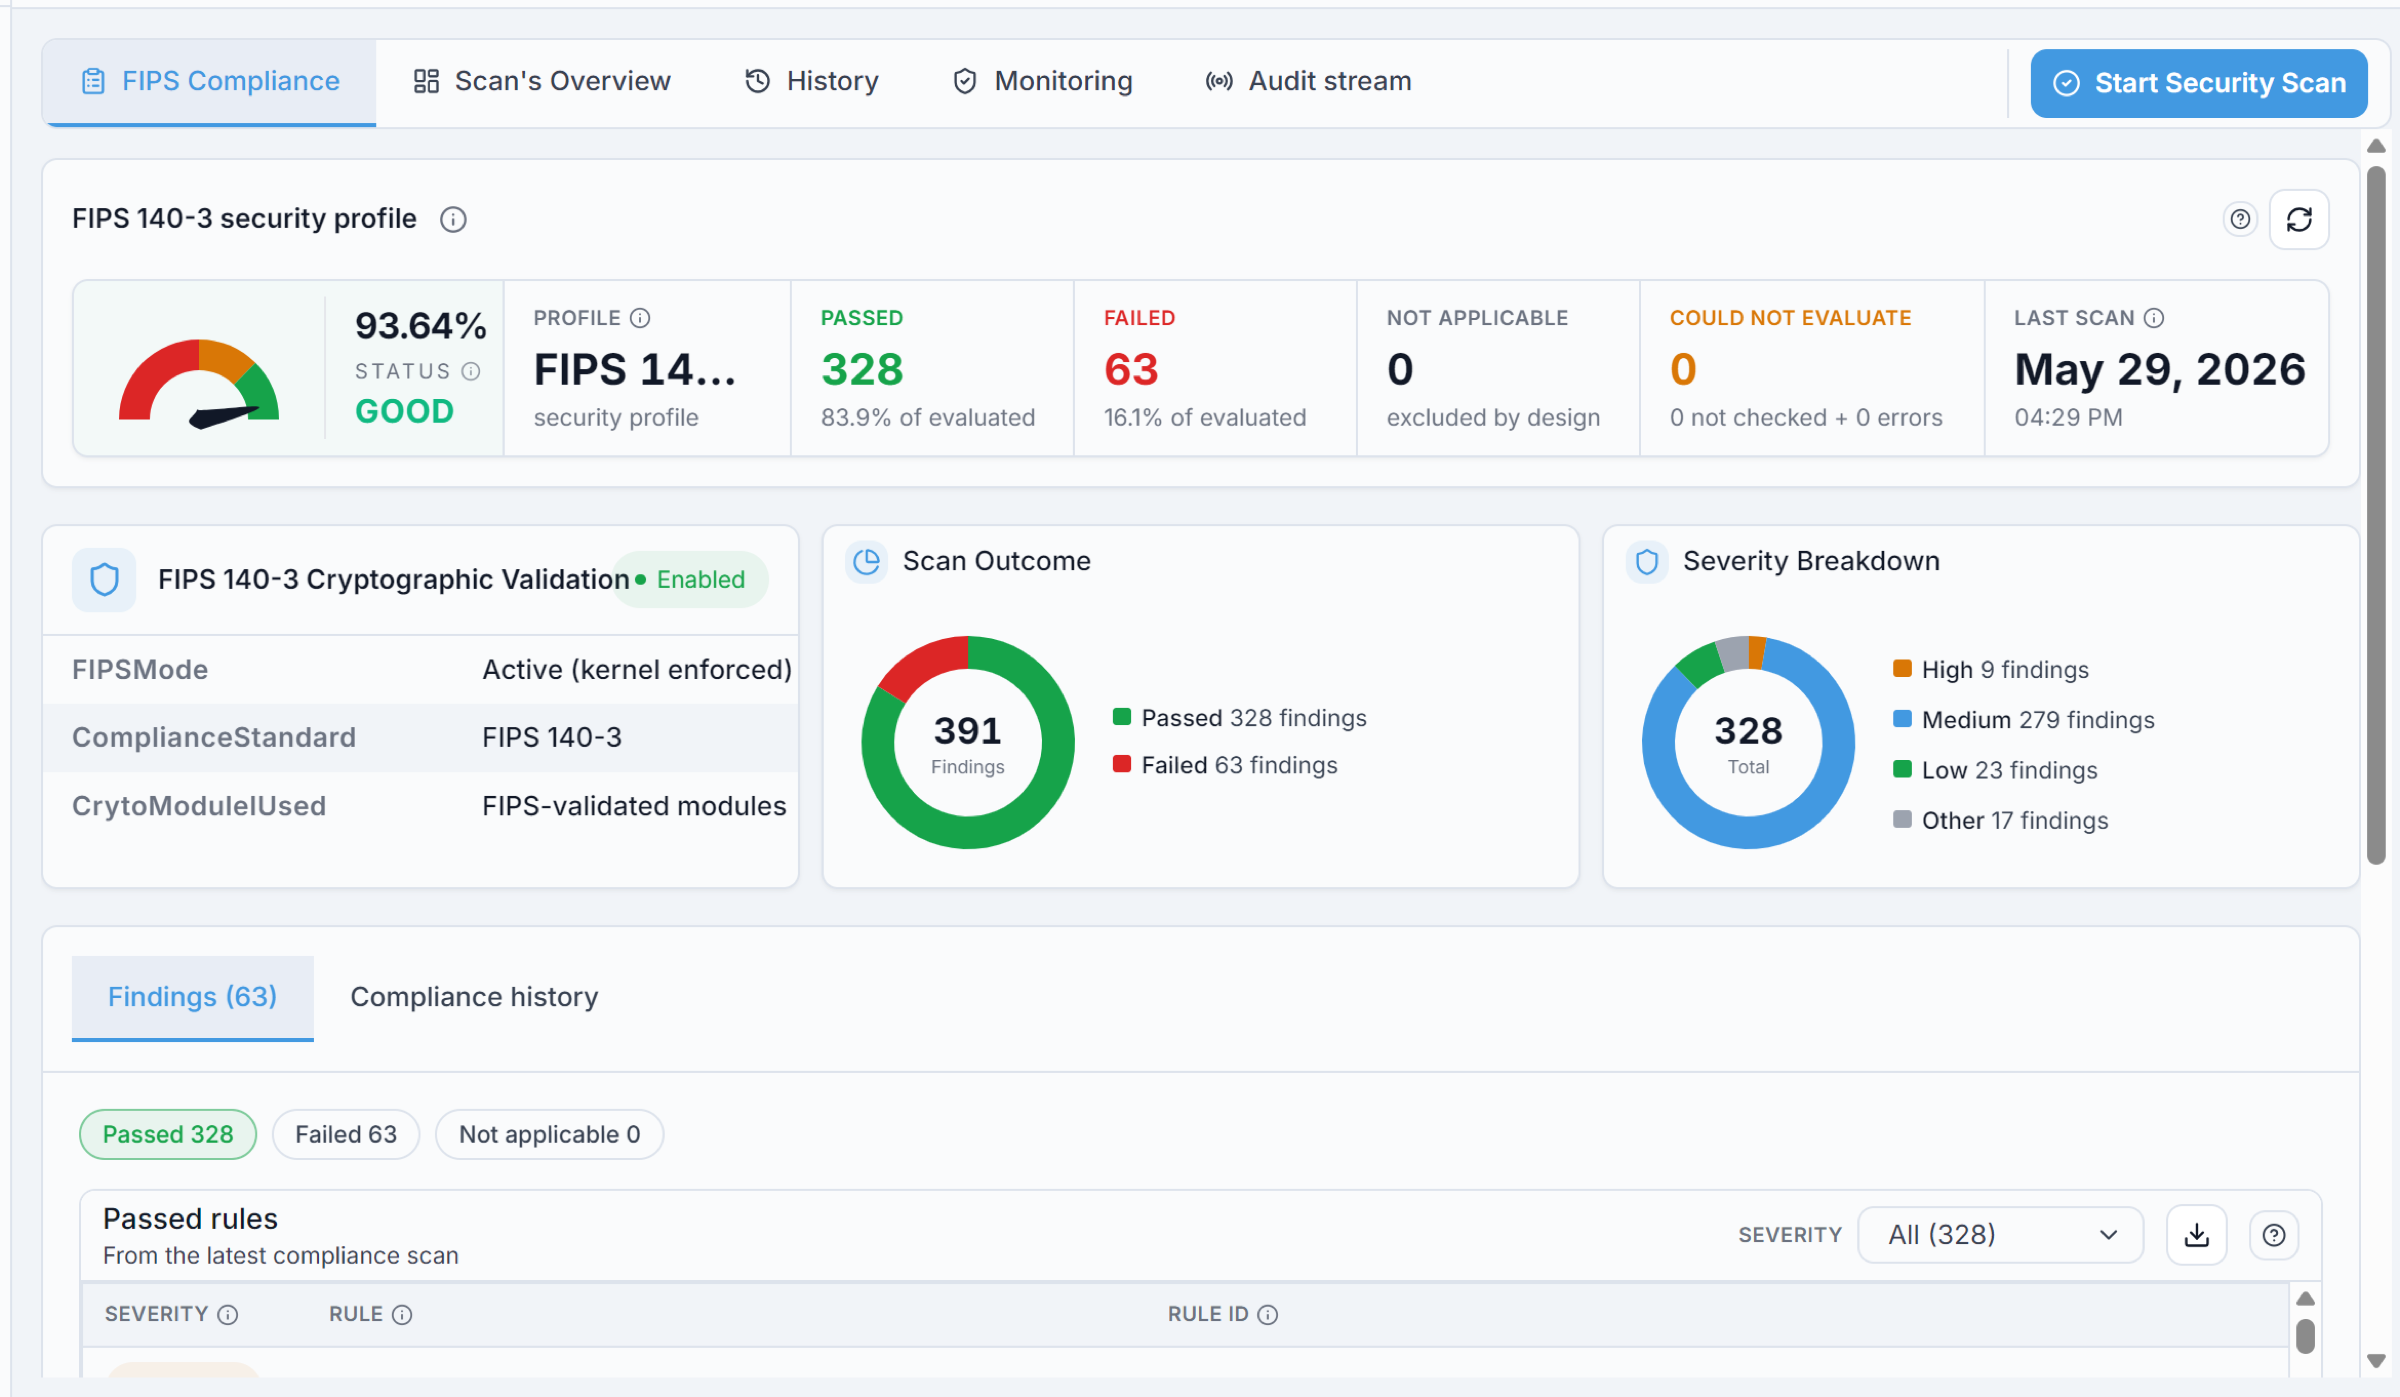
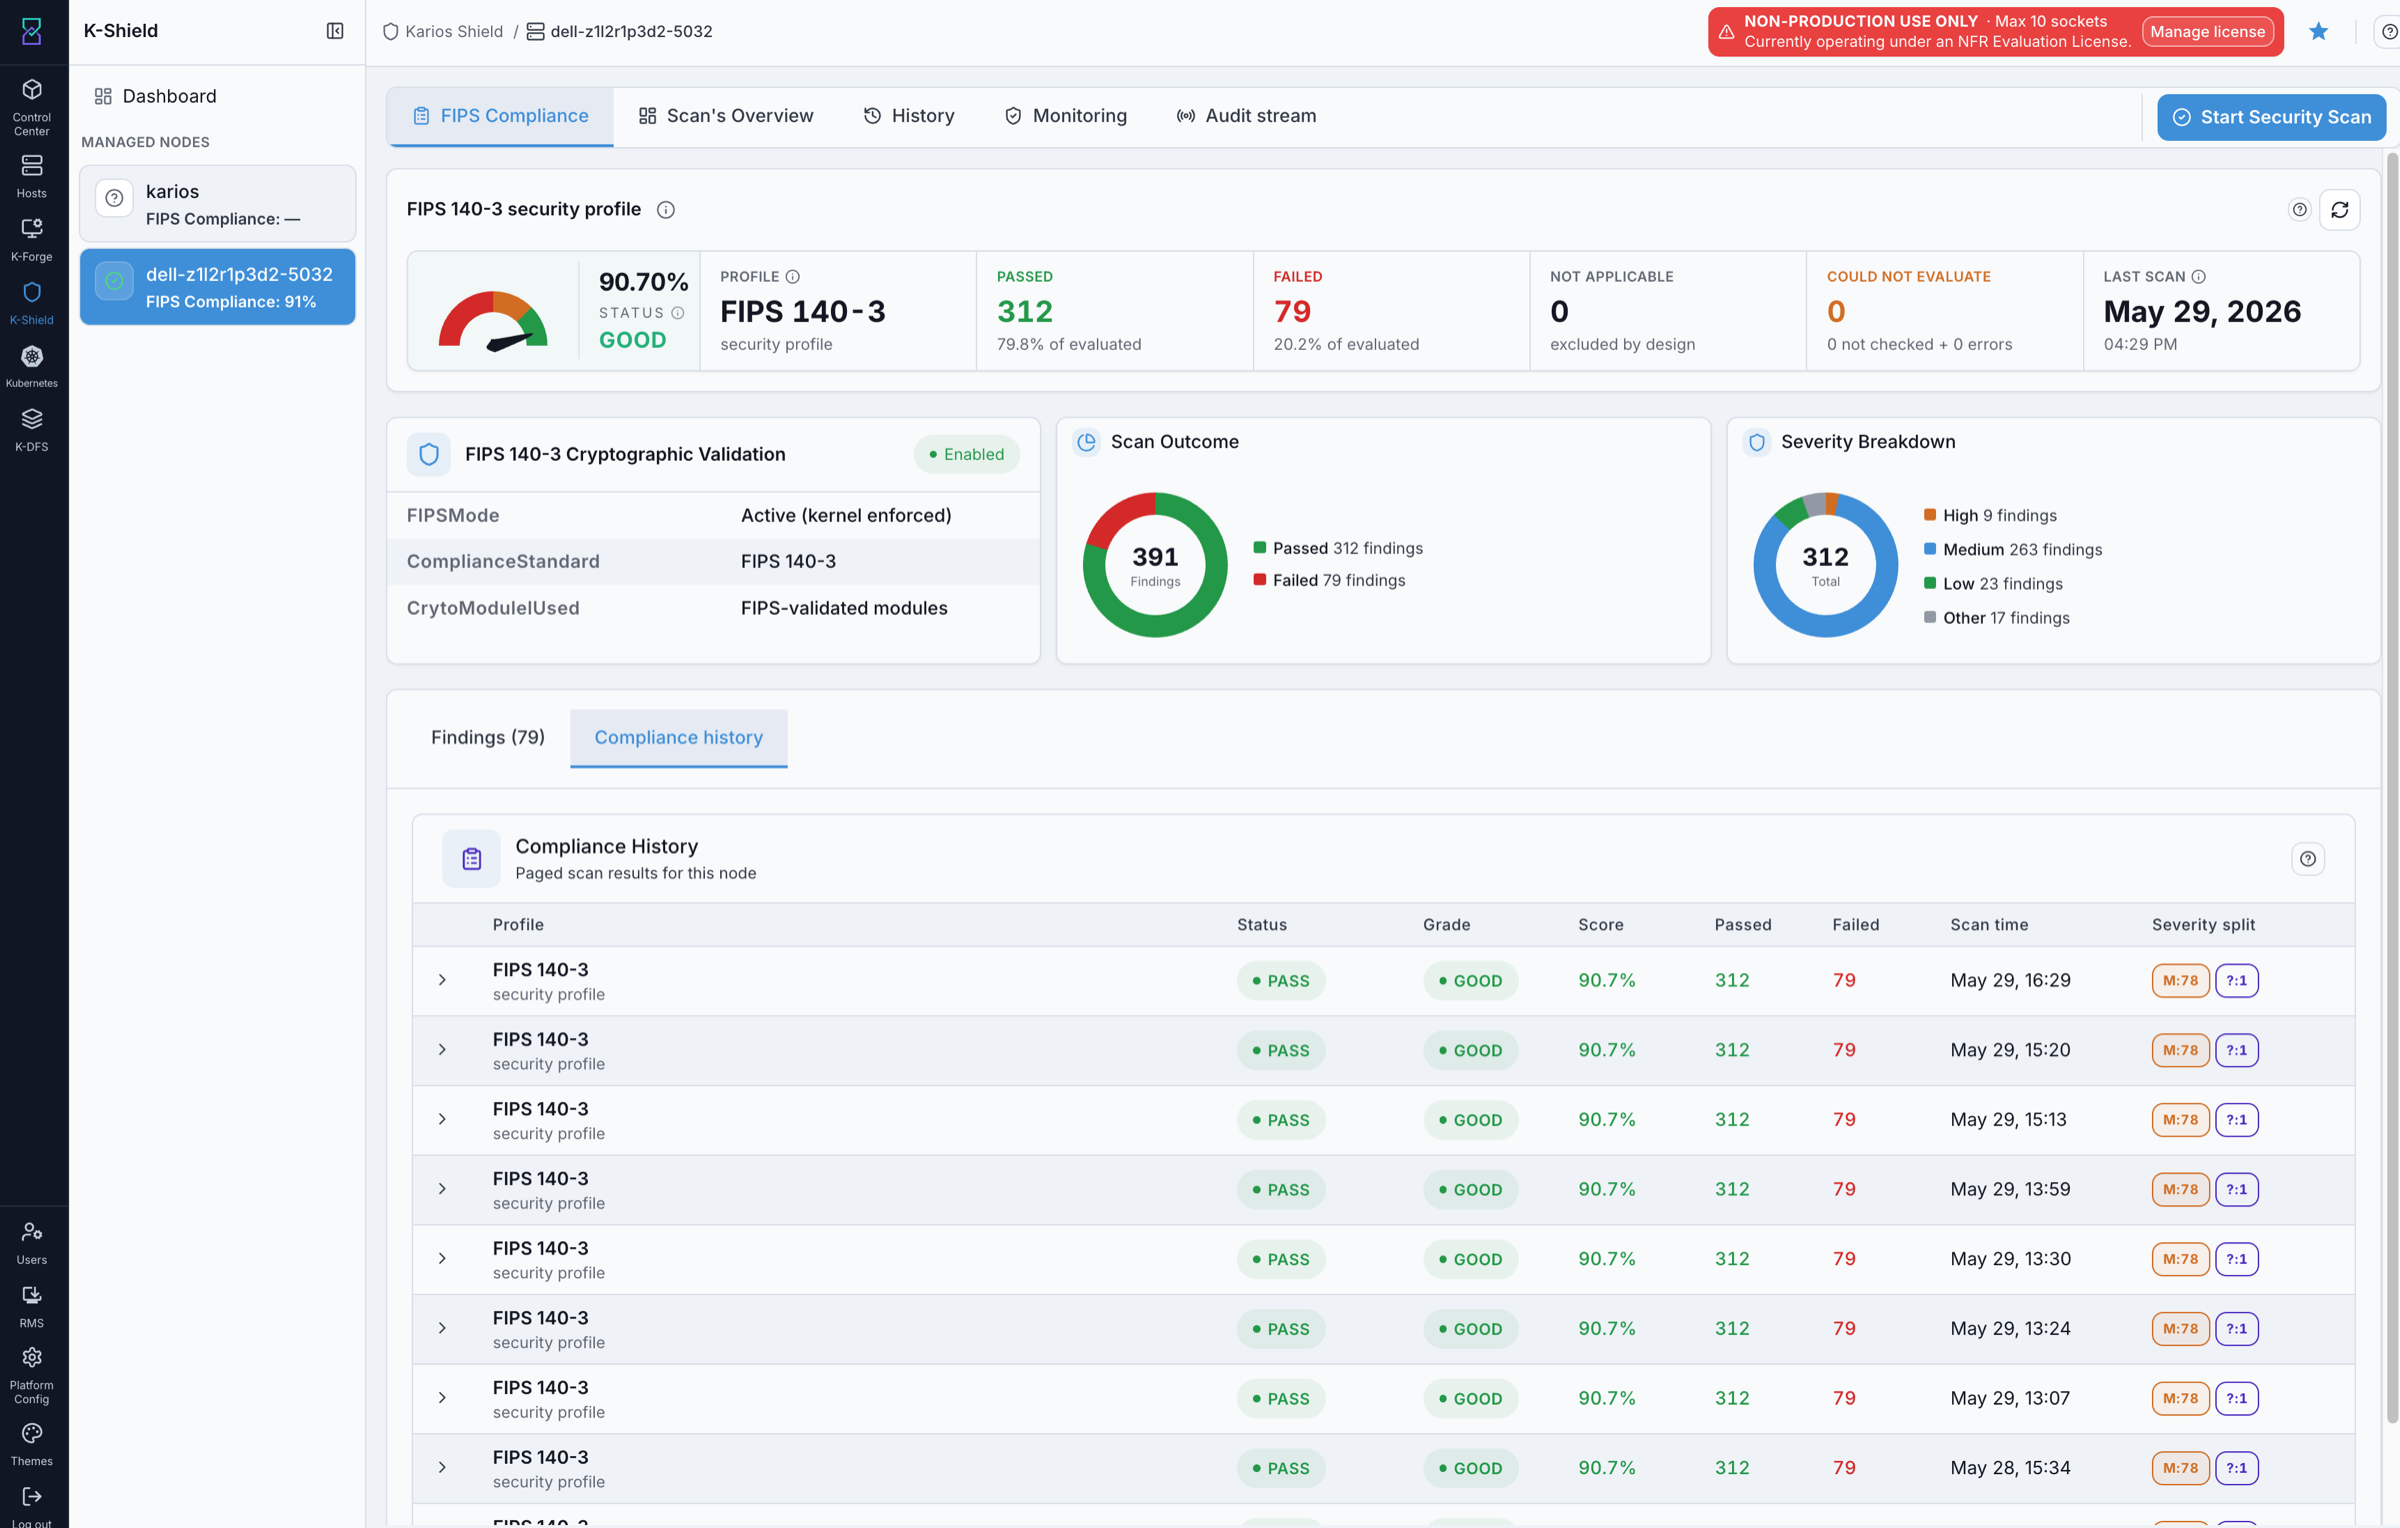
What this screenshot shows:
Score gauge with percentage and
STATUS(for exampleGOOD).Cards:
PROFILE(FIPS 140-3),PASSED,FAILED,NOT APPLICABLE,COULD NOT EVALUATE, andLAST SCAN.FIPS 140-3 Cryptographic Validationcard:FIPSMode(active, kernel enforced),ComplianceStandard(FIPS 140-3), andCrytoModuleUsed(FIPS-validated modules).Scan Outcomedonut (passed vs failed findings) andSeverity Breakdowndonut (high / medium / low / other).FindingsandCompliance historysub-tabs.Findings table with
Severity,Rule, andRule ID, plus passed / failed / not-applicable filters, a severity filter, and an export control.
What you can do from this screen:
Read the FIPS compliance percentage and status at a glance.
Confirm FIPS mode and cryptographic-module validation.
Review passed / failed counts and the severity breakdown.
Filter findings and export the list.
Expected Outcome:
The gauge, cards, donuts, and findings table are visible for the node.
If this fails:
Refresh the compliance tab.
Confirm the
FIPS Compliancetab is selected.Confirm the findings table is visible.
10. Compliance history
When to Use:
Use this when comparing FIPS compliance results across scans.
Purpose:
Review prior FIPS compliance runs for the node.
Steps:
Open the
FIPS Compliancetab.Open the
Compliance historysub-tab.Review the history rows.
FIPS Compliance history.
What this screenshot shows:
Compliance historytable withProfile,Status,Grade,Score,Passed,Failed,Scan time, and severity split per row.
What you can do from this screen:
Compare prior FIPS compliance results.
Track score and grade trend over time.
Expected Outcome:
Compliance history rows are visible.
If this fails:
Refresh the compliance tab.
Confirm the
Compliance historysub-tab is selected.
11. Scan’s Overview
When to Use:
Use this when reviewing a managed node’s security posture on the Scan's Overview tab shown below.
Purpose:
Review the node’s compliance and CAT issue cards, compliance trend, security score panel, and the vulnerabilities table.
Note
The Vulnerabilities here are detected misconfigurations and CVEs from the scan —
distinct from the FIPS Compliance tab’s Findings, which are pass/fail results of
FIPS 140-3 hardening rules.
Steps:
Open
K-Shield -> Dashboard -> Node level.Select a managed node from the left panel or the
Security Nodestable.Open
Scan's Overview.Review the
Compliance Score,System Status, andCAT I/II/III Issuescards.Review the
Compliance Trendchart and theSecurity Score Panel.Review the
Vulnerabilitiestable and filter by severity when triaging.Click
Recommendon a finding to open its remediation dialog.
Managed-node Scan’s Overview.
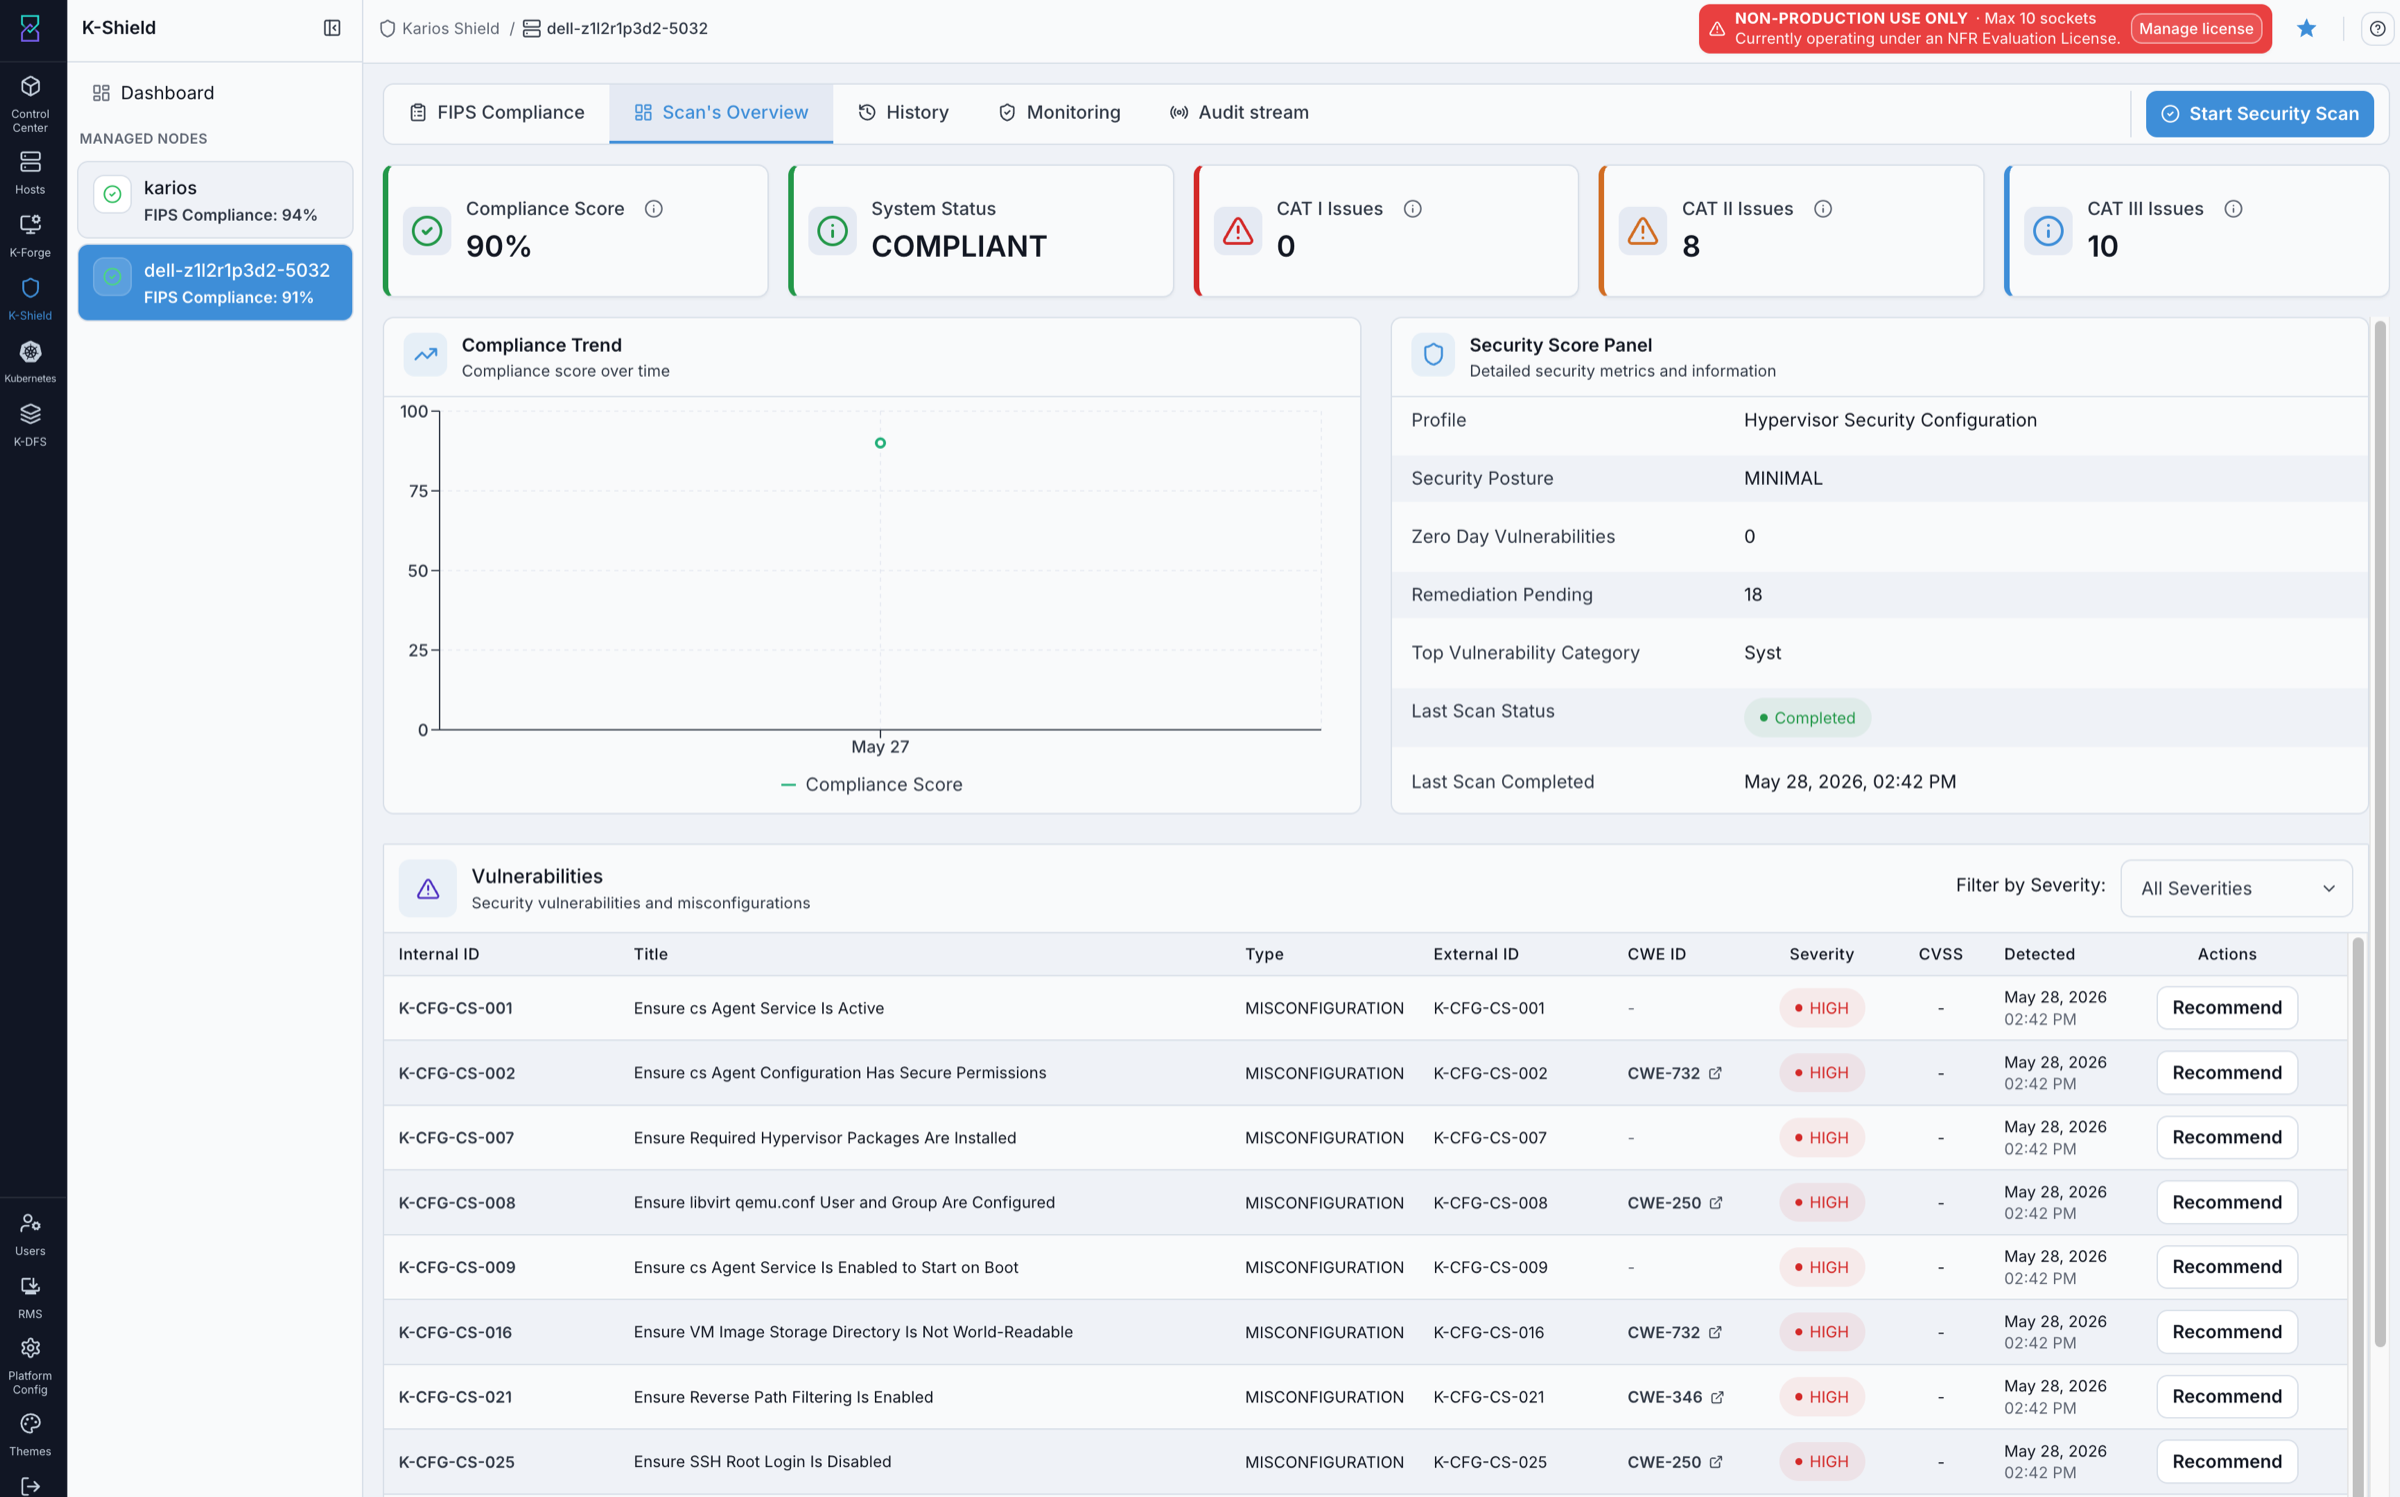
What this screenshot shows:
Managed-node breadcrumb and the left
Managed Nodespanel with per-node FIPS compliance.Tab bar:
FIPS Compliance,Scan's Overview,History,Monitoring, andAudit stream.Start Security Scanaction (available from every node tab).Cards for
Compliance Score,System Status,CAT I Issues,CAT II Issues, andCAT III Issues.Compliance Trendchart for score movement across scan dates.Security Score Panelwith profile, security posture (a qualitative rating such asMINIMAL— read it alongside the compliance score and CAT counts, not as a pass/fail), zero-day vulnerabilities, remediation pending, top vulnerability category, last scan status, and last scan completed.Vulnerabilitiestable with internal ID, title, type, external ID, CWE ID, severity, CVSS, detected-on date, and aRecommendaction per row.Severity filter for the vulnerability rows.
What you can do from this screen:
Confirm the latest compliance score, system status, and CAT issue counts.
Review the security profile and posture in the score panel.
Filter vulnerabilities by severity and open
Recommendfor a finding’s remediation dialog.Start a new security scan.
Move to the FIPS Compliance, History, Monitoring, or Audit stream tabs.
Clicking Recommend on a vulnerability opens its remediation dialog:
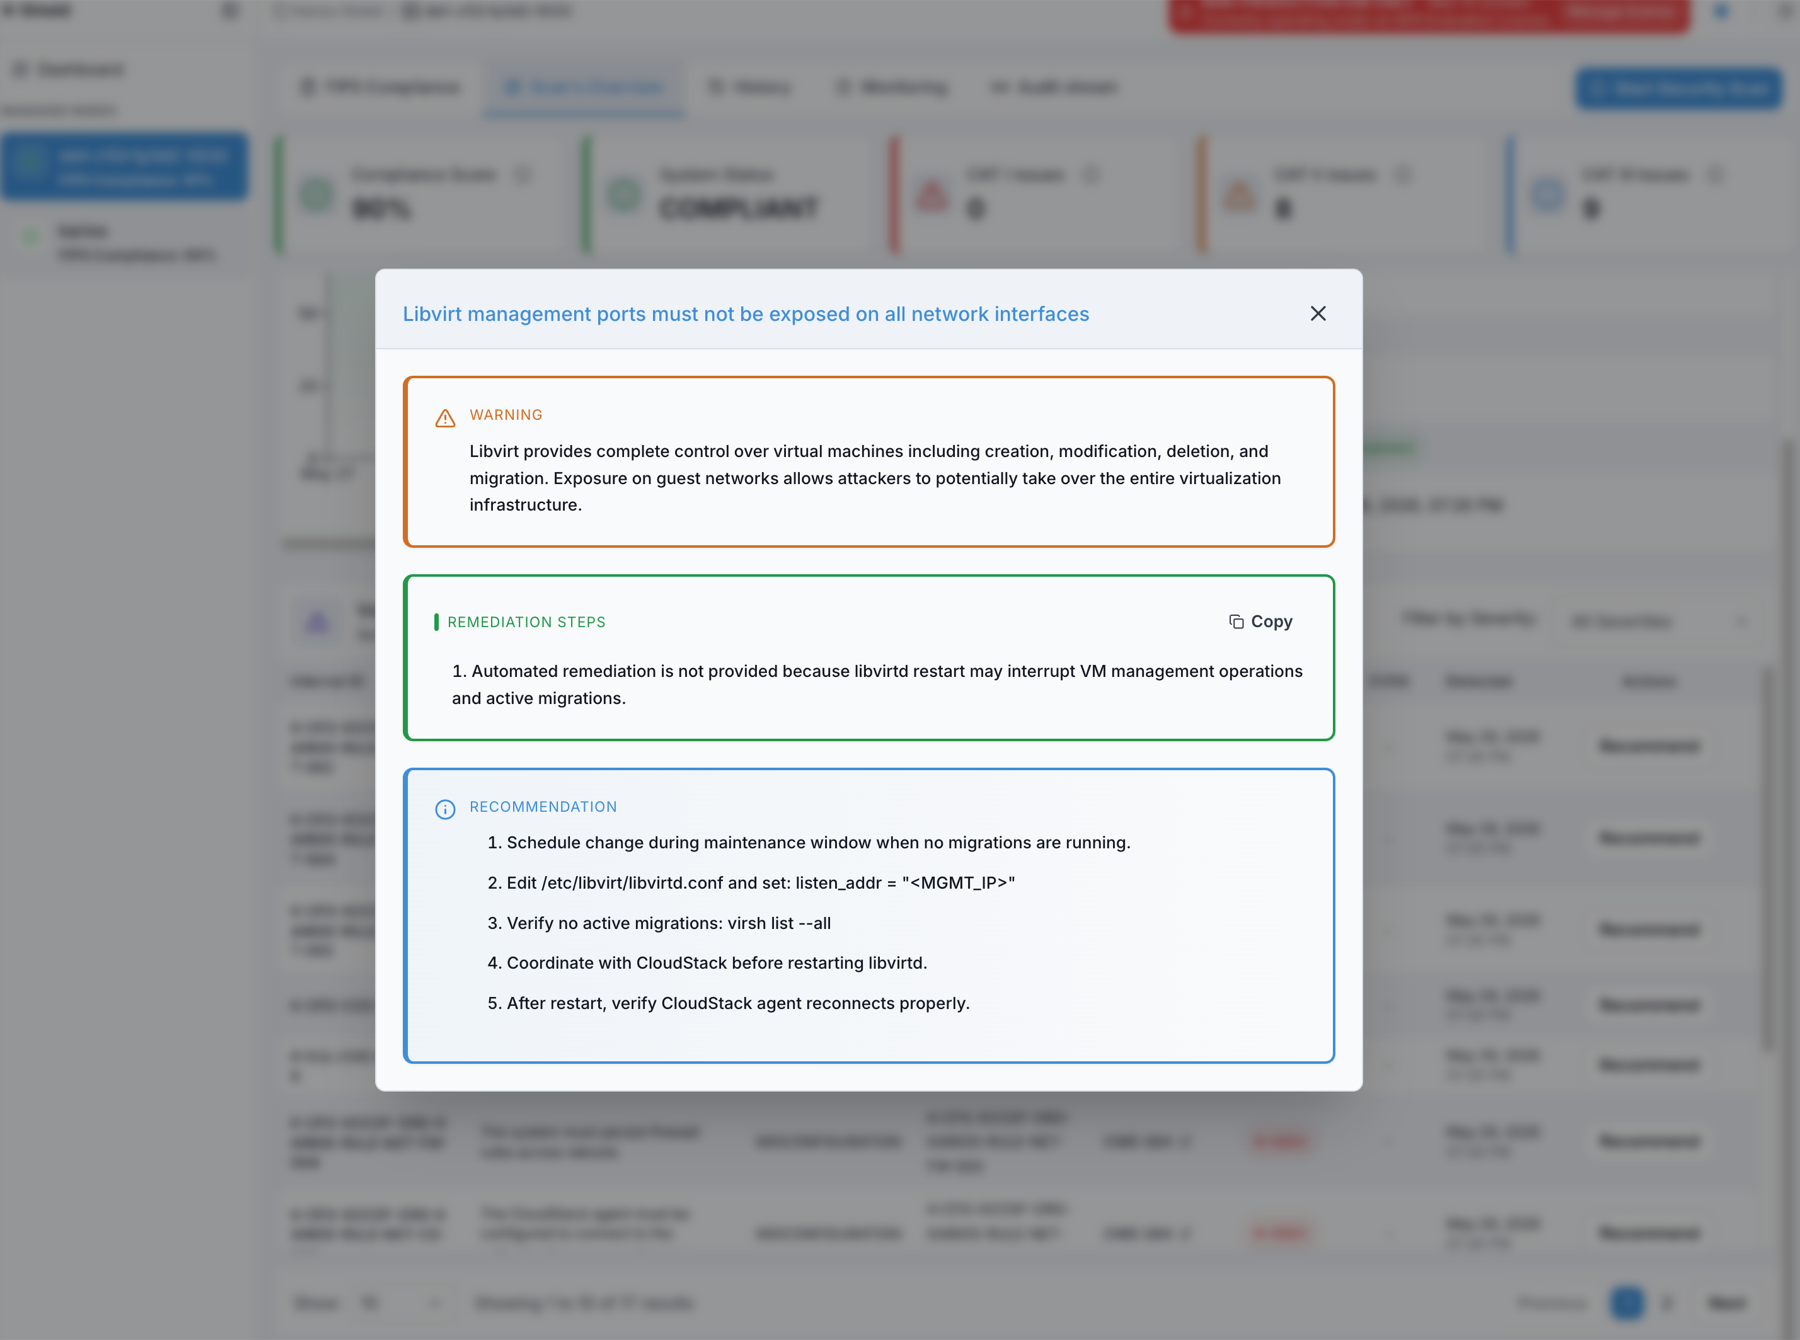
Remediation recommendation for a selected vulnerability.
The recommendation dialog shows:
A
WARNINGdescribing the risk and impact of the finding.REMEDIATION STEPSwith aCopyaction, including a note when automated remediation is not provided.A numbered
RECOMMENDATIONwith the manual steps to remediate the finding safely.
Expected Outcome:
The selected node’s overview cards, trend chart, score panel, and vulnerability rows are visible.
If this fails:
Refresh the managed-node page.
Confirm the selected node appears in the breadcrumb.
Confirm the
Scan's Overviewtab is selected.
12. Start Security Scan
When to Use:
Use this when you need a fresh compliance scan of the selected managed node.
Purpose:
Choose a validated STIG profile and start the scan.
Tip
Pick the profile that matches the node’s role and your security team’s approved baseline.
The profile names indicate their scope — for example, Hypervisor Security Configuration
for hypervisor / compute hosts, Network Security Configuration or Storage Security
Configuration for network or storage roles, and Karios Debian Security Baseline as the
general OS baseline. Use the same profile on re-scans so results stay comparable.
Steps:
Click
Start Security Scan.Choose a validated STIG profile from the list.
Confirm the value shown under
Selected Profile.Click
Start Security Scanin the dialog.Optionally close the window — the scan continues in the background.
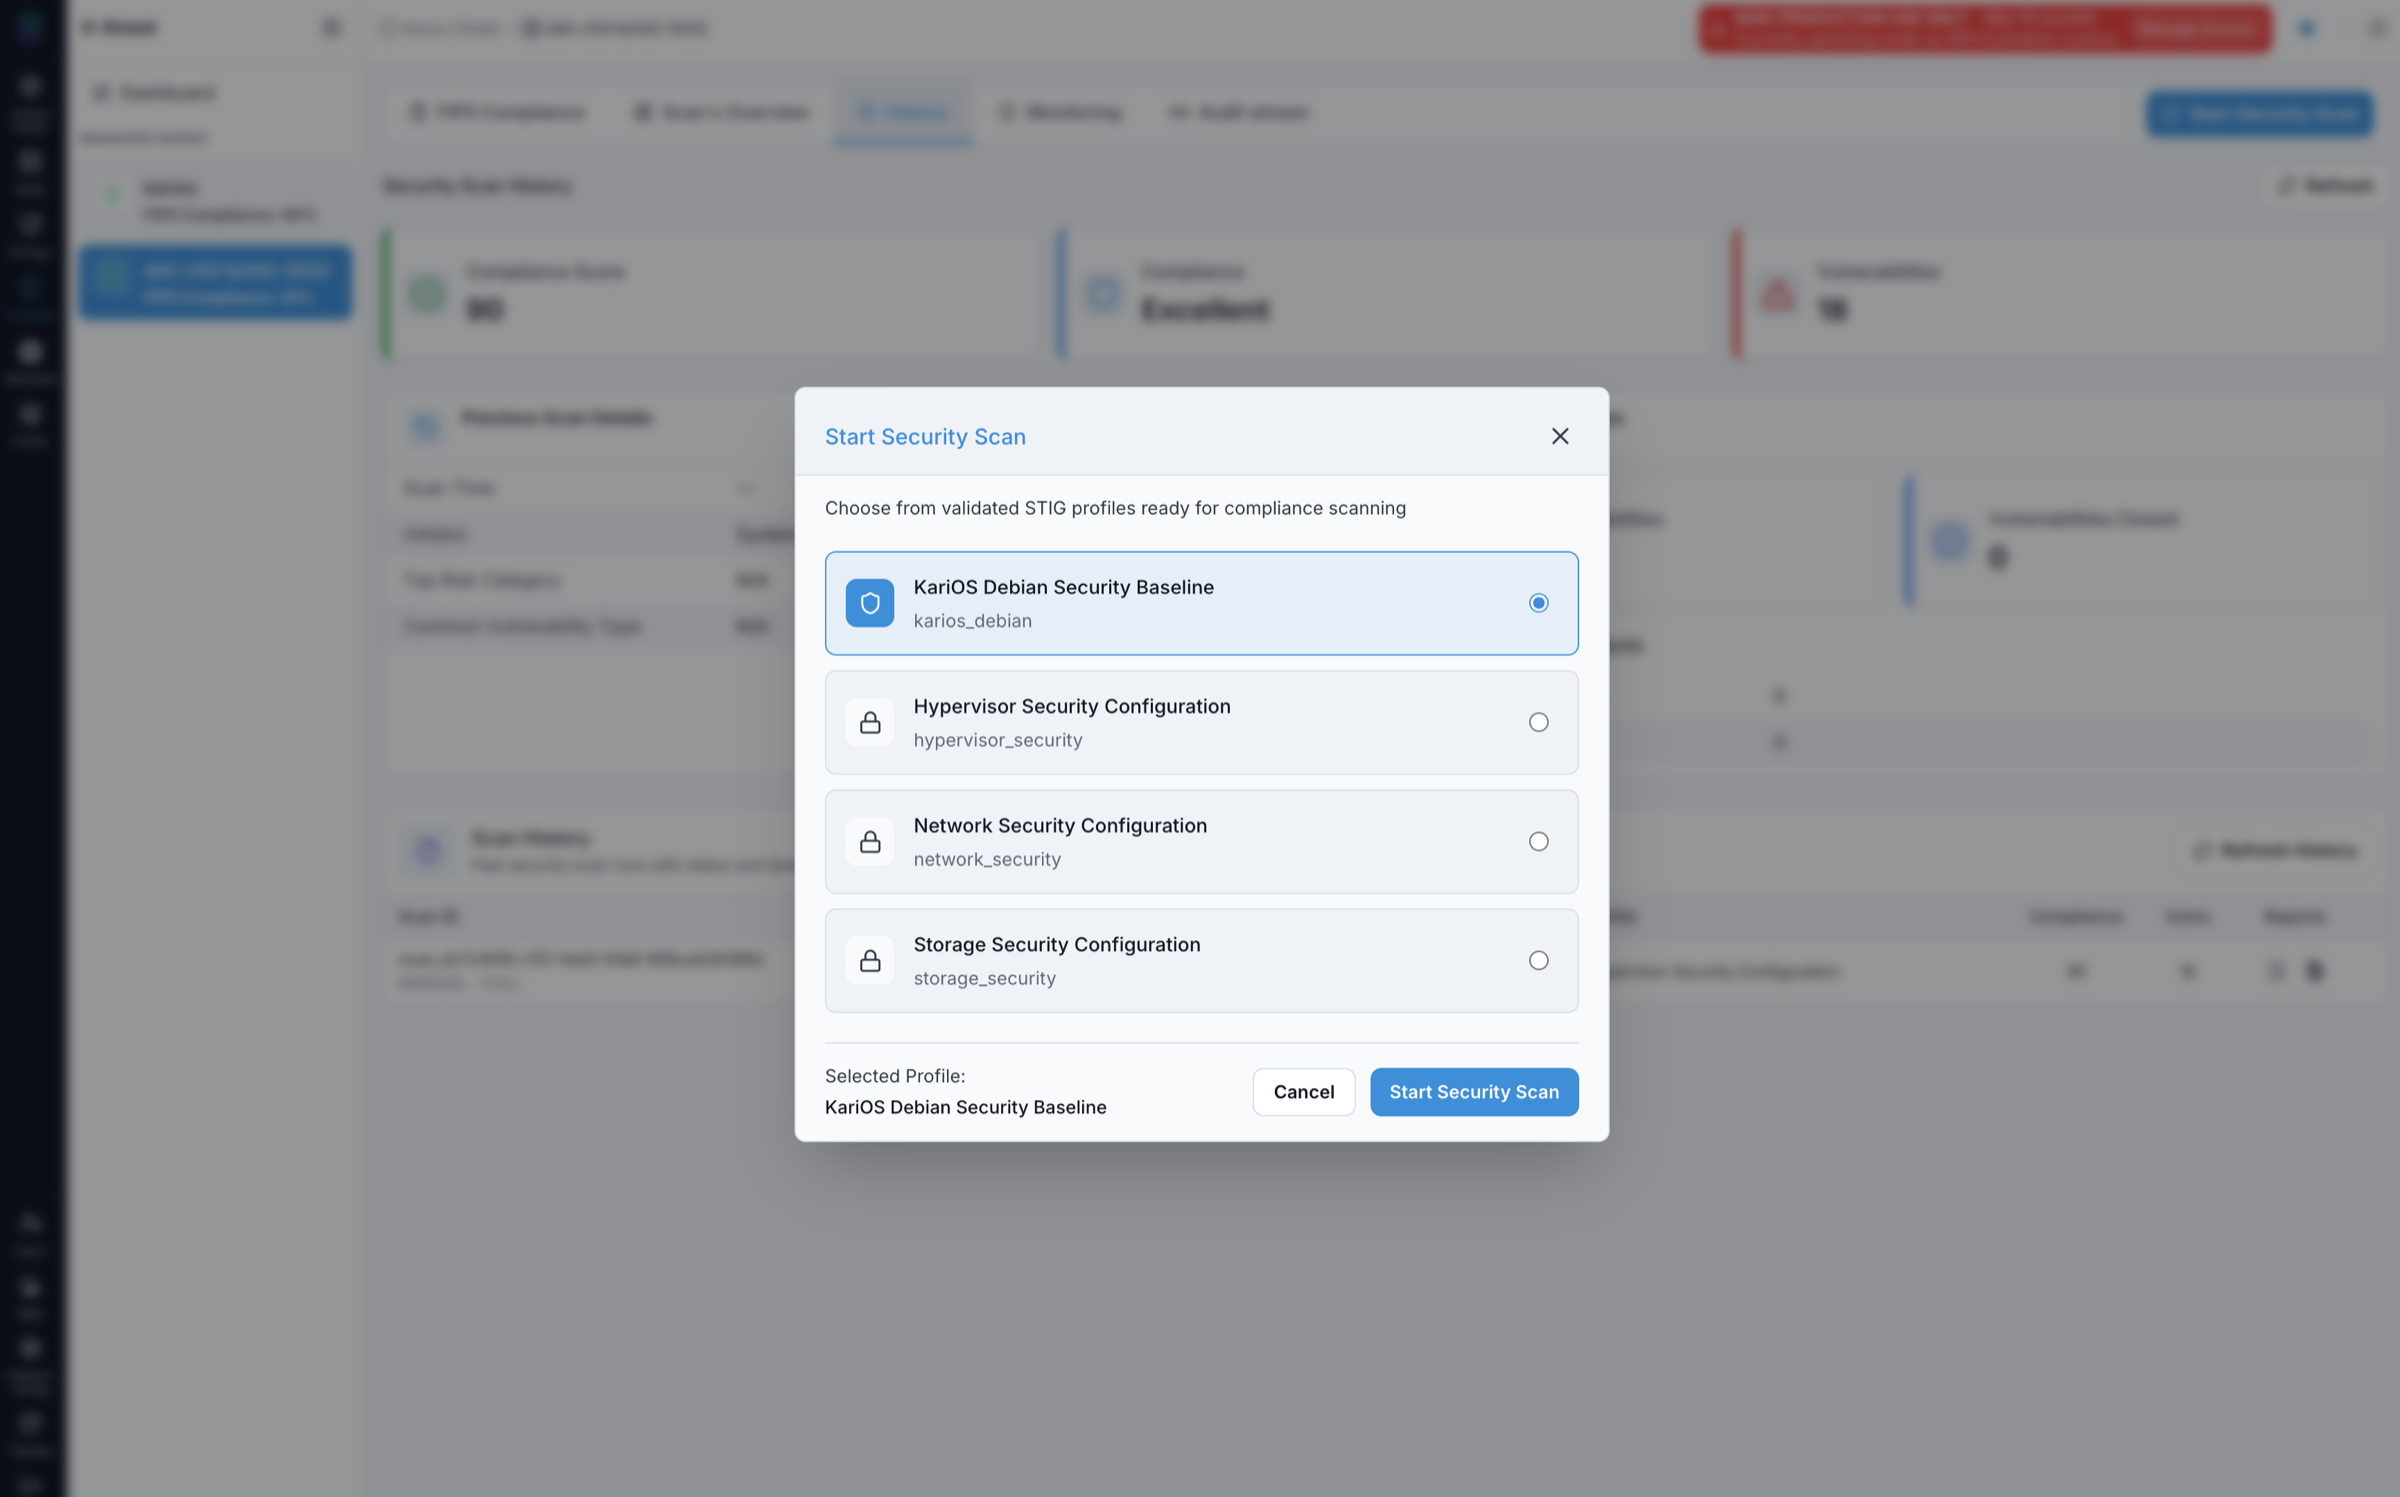
Choose a validated STIG profile for the scan.
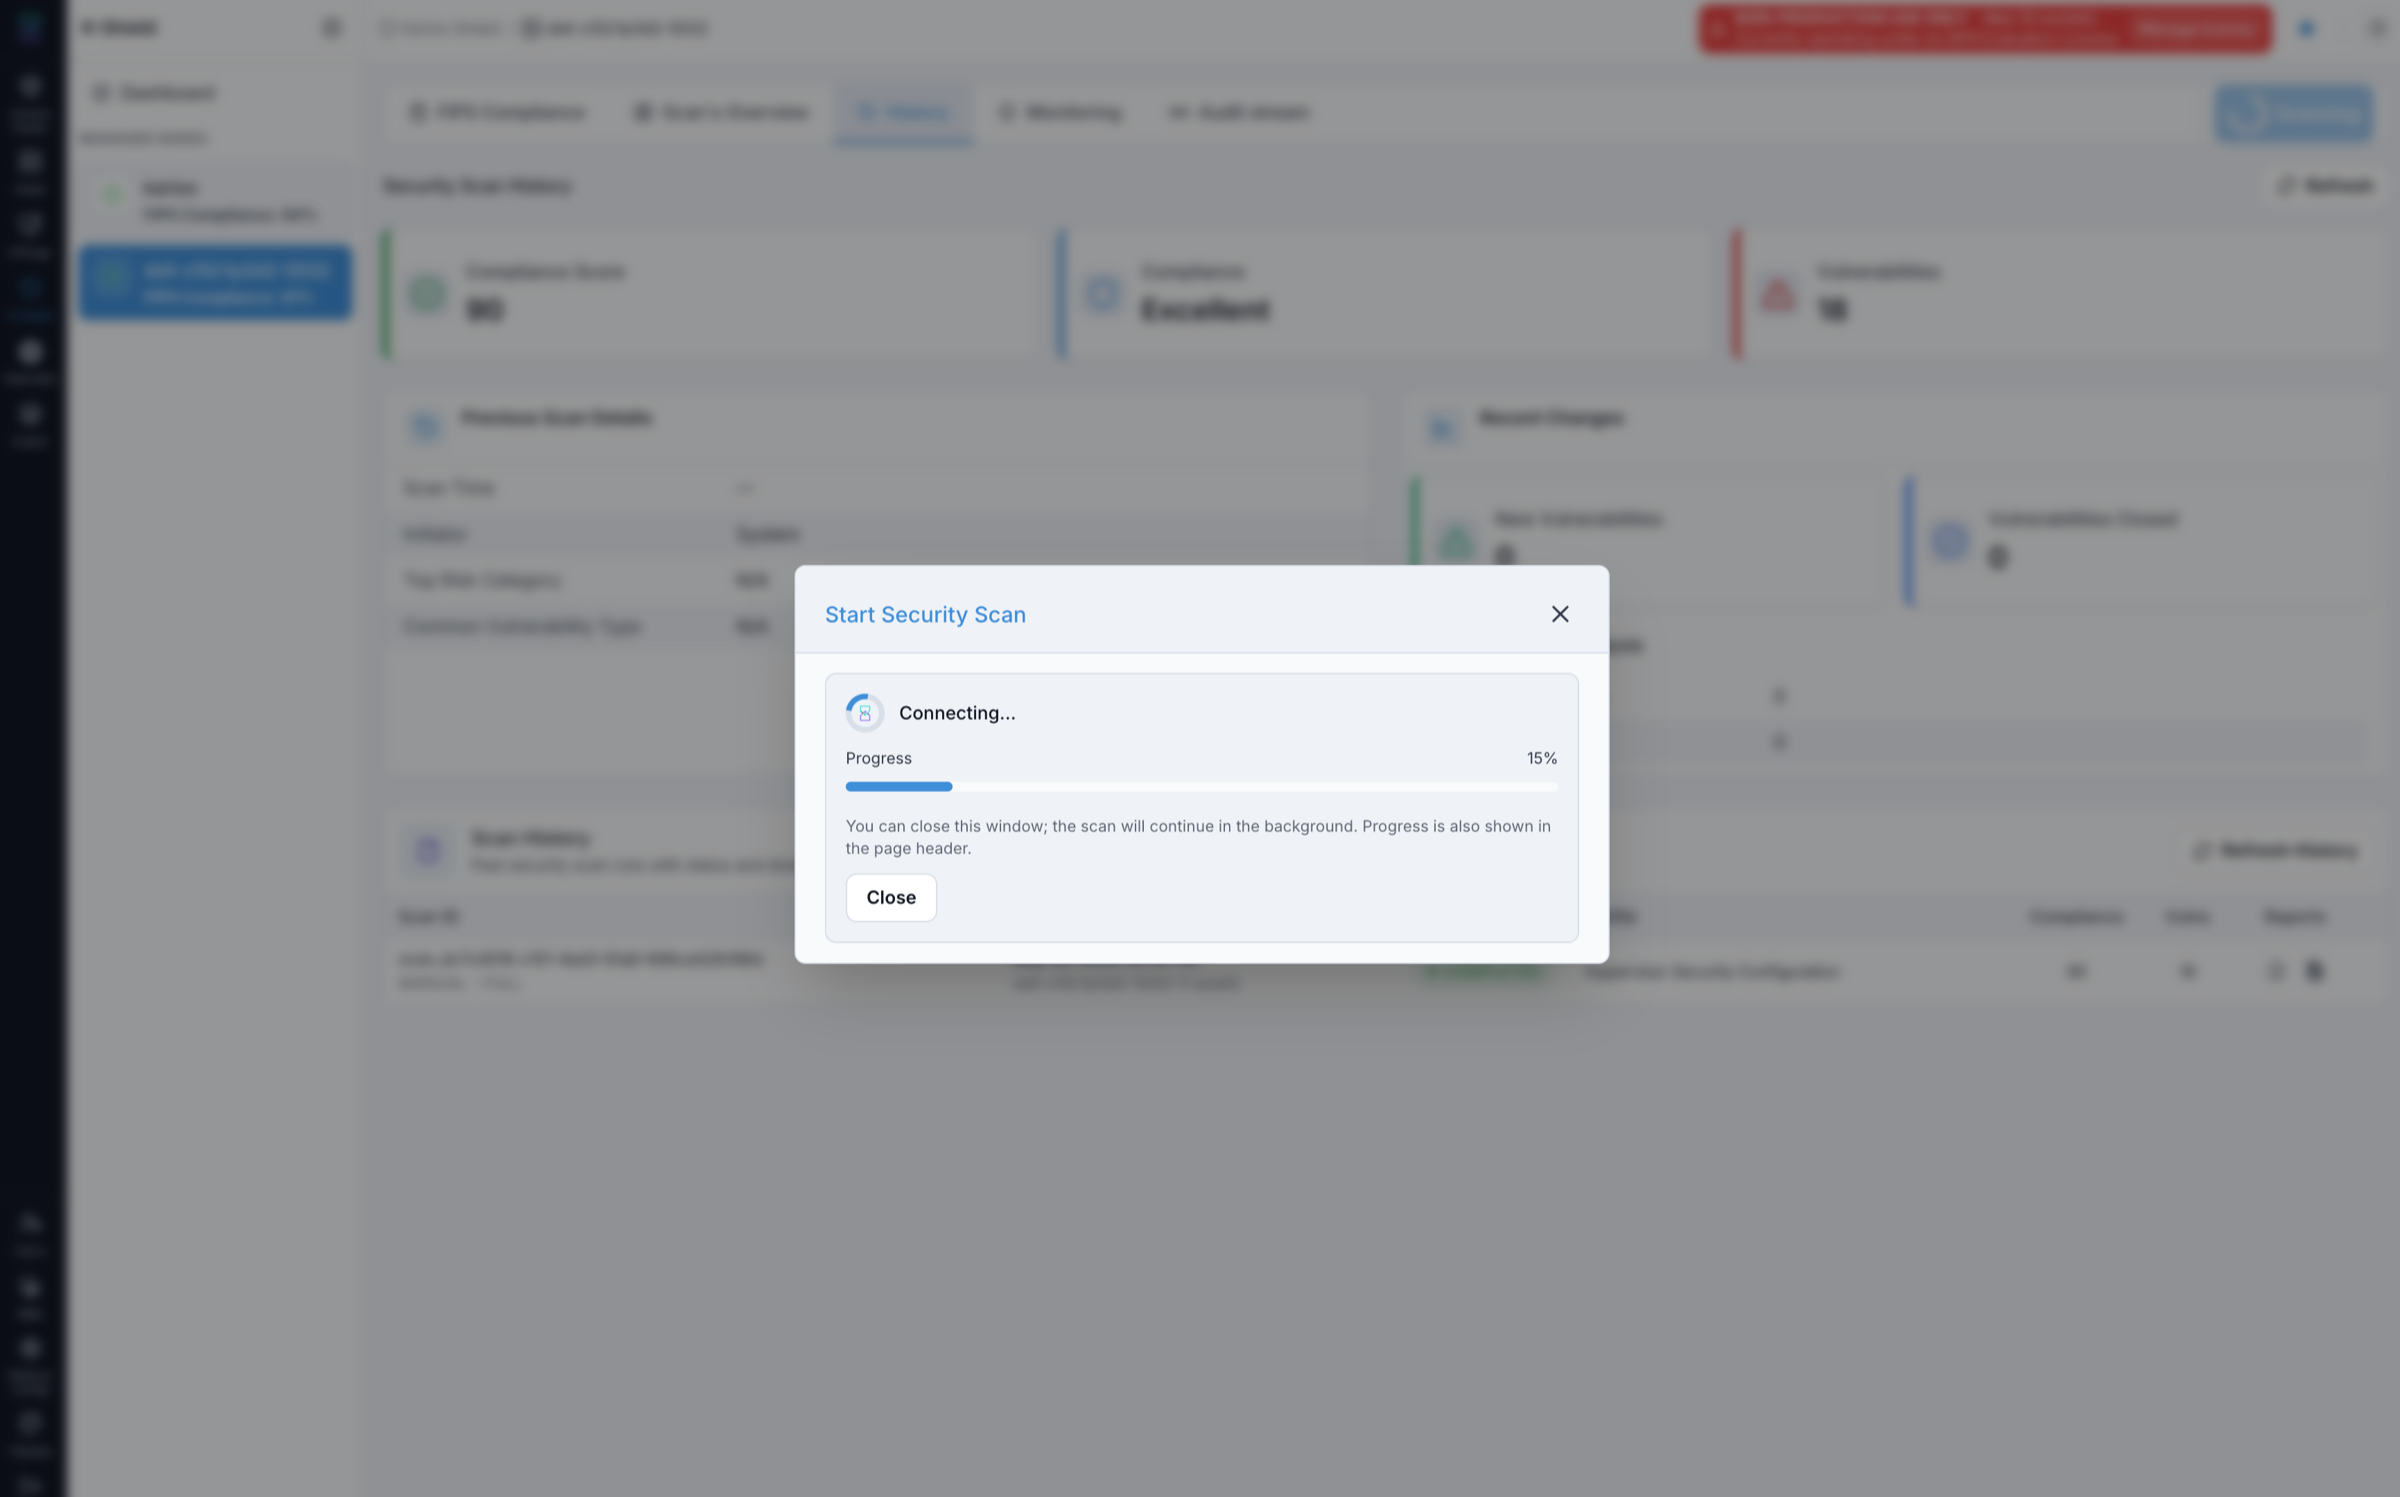
The scan runs in the background after it starts.
What this screenshot shows:
Profile dialog titled
Choose from validated STIG profiles ready for compliance scanning.Selectable profiles:
Karios Debian Security Baseline,Hypervisor Security Configuration,Network Security Configuration, andStorage Security Configuration.Selected Profilesummary and theCancel/Start Security Scanactions.Progress modal with a status (for example
Connecting...), a progress bar and percentage, and the note that you can close the window while the scan continues in the background.
What you can do from this screen:
Select the approved security profile for the node.
Start the scan immediately.
Close the window and let the scan finish in the background.
Expected Outcome:
The scan is submitted and progress is shown.
Results populate
Scan's OverviewandHistoryafter completion.
If this fails:
Reopen the dialog.
Confirm a profile is selected.
Refresh the page and retry.
13. Security Scan History
When to Use:
Use this when reviewing past scans and downloading reports on the History tab.
Purpose:
Review previous scan details, recent changes, and download HTML/PDF reports.
Steps:
Open the
Historytab.Review the
Compliance Score,Compliance, andVulnerabilitiescards.Review
Previous Scan Details,Recent Changes, andCompliance Gap Analysis.In the
Scan Historytable, find the scan row to review.In the
Reportscolumn, click the HTML report icon to download the HTML report.Click the PDF report icon to download the PDF report.
Open the downloaded report from your browser downloads to review it outside K-Shield.
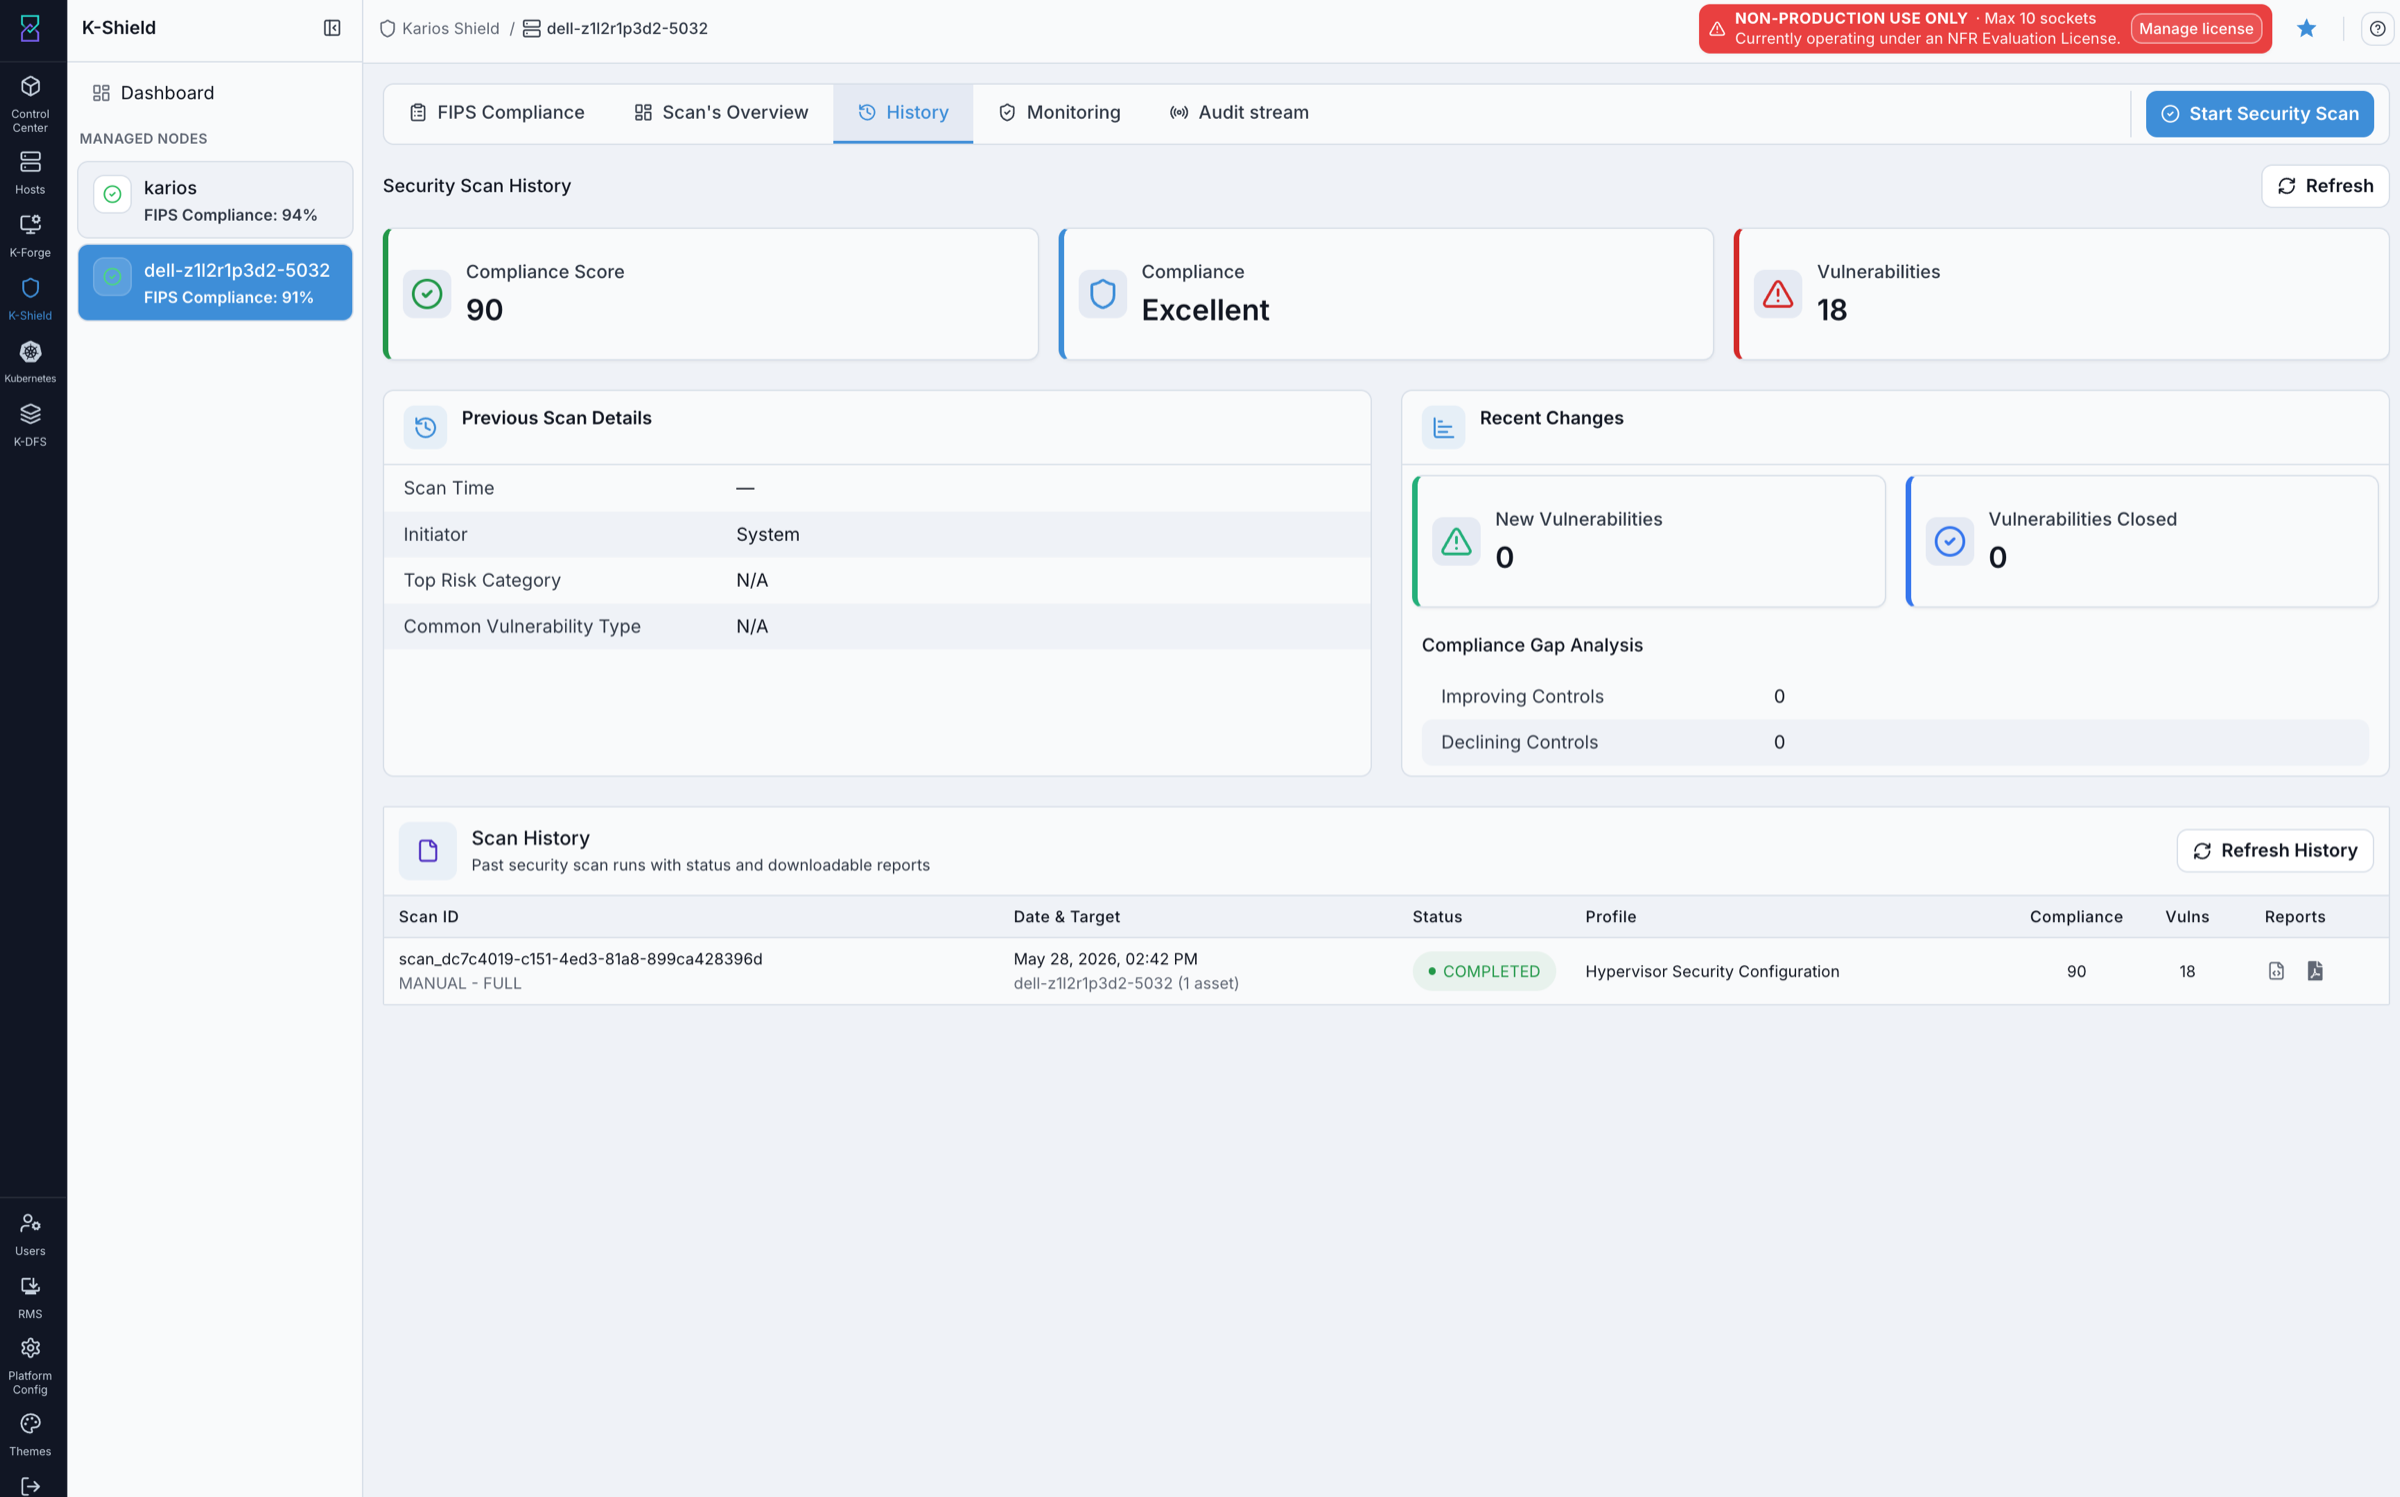
Security scan history with downloadable reports.
What this screenshot shows:
Cards for
Compliance Score,Compliance, andVulnerabilities.Previous Scan Details(scan time, initiator, top risk category, common vulnerability type).Recent Changes(new vulnerabilities, vulnerabilities closed) andCompliance Gap Analysis(improving / declining controls).Scan Historytable with scan ID, date and target, status, profile, compliance score, vulnerabilities count, and aReportscolumn with HTML and PDF download icons.Refresh HistoryandStart Security Scanactions.
What you can do from this screen:
Review the previous scan and what changed since the last run.
Download the HTML and PDF reports for any scan row.
Refresh history after a new scan completes.
Expected Outcome:
History cards, scan rows, and the report icons in the
Reportscolumn are visible.
If this fails:
Refresh history.
Confirm the
Historytab is selected.Confirm the
Reportscolumn contains the report icons.
14. Monitoring
When to Use:
Use this when reviewing node network exposure and rootkit status on the Monitoring tab.
Purpose:
Review the Nmap score, port-scan summary, open ports, and supporting monitoring cards.
Steps:
Open the
Monitoringtab.Review the
NMAP Score,Latest Port Scan Summary,Unexpected Ports,Rkhunter Status, andRkhunter Warningscards.Review
Nmap Scan Detailsand thePort Security Risk Timeline.Open
Open Portsand review each port, protocol, service, and impact.Click
View detailson a port row when you need the full guidance.
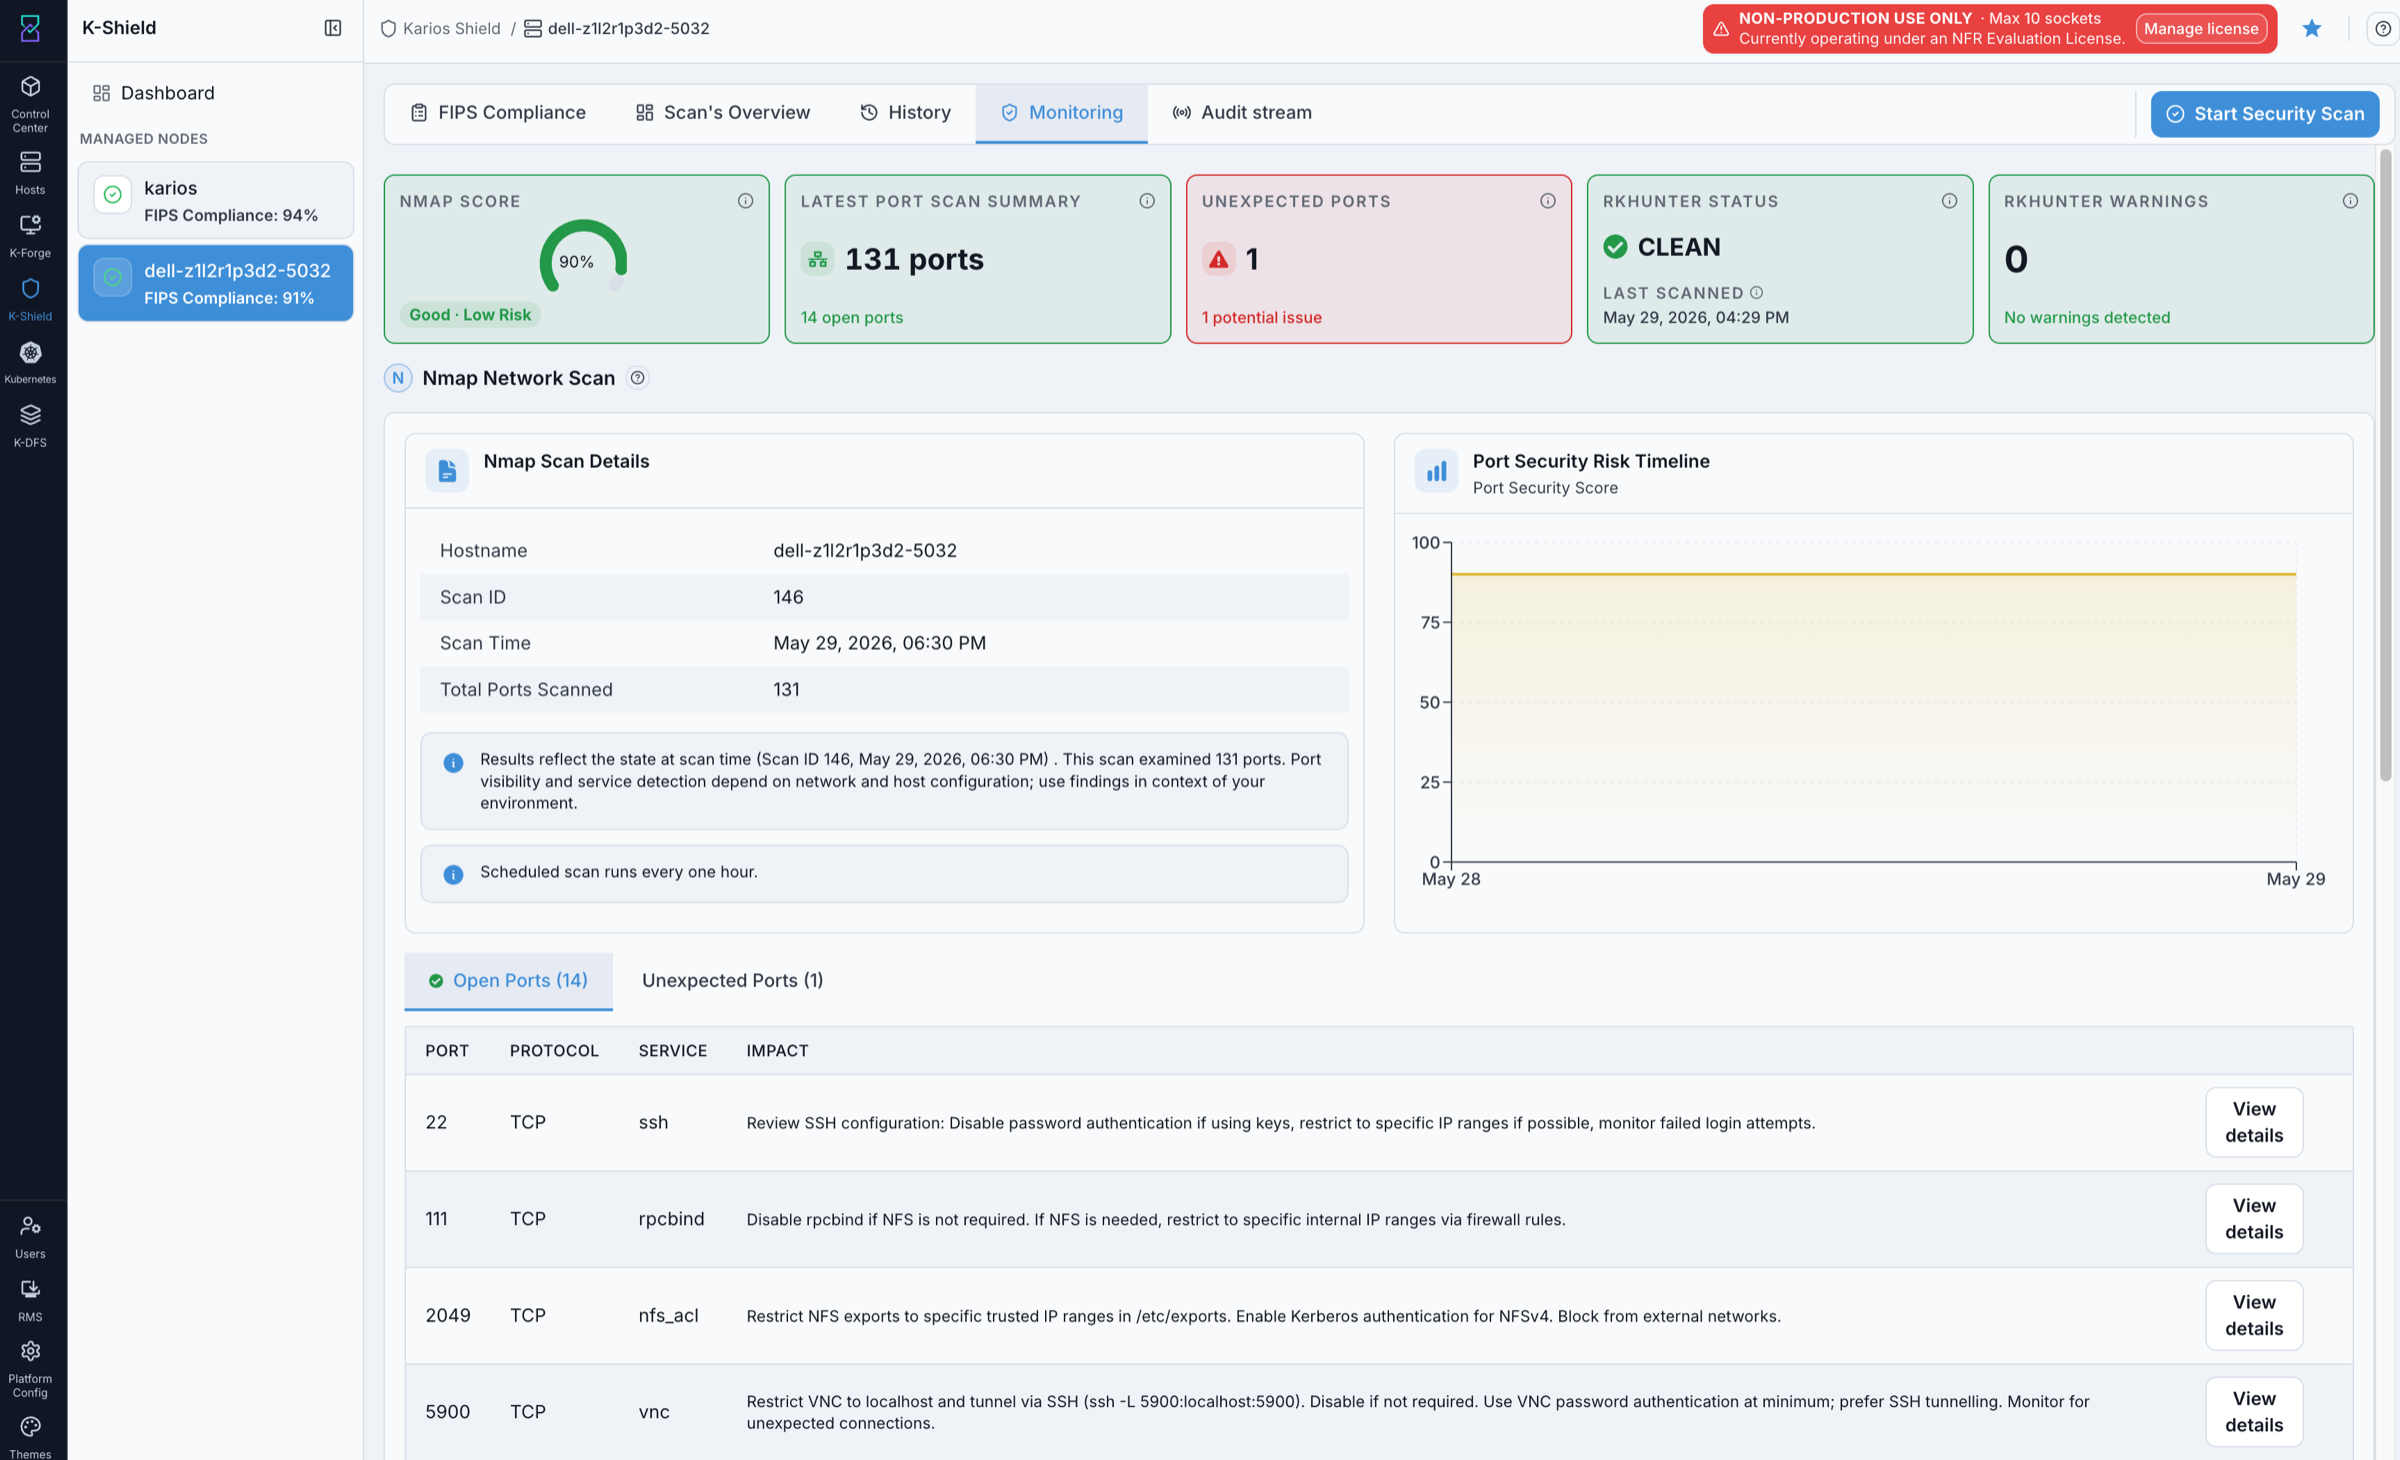
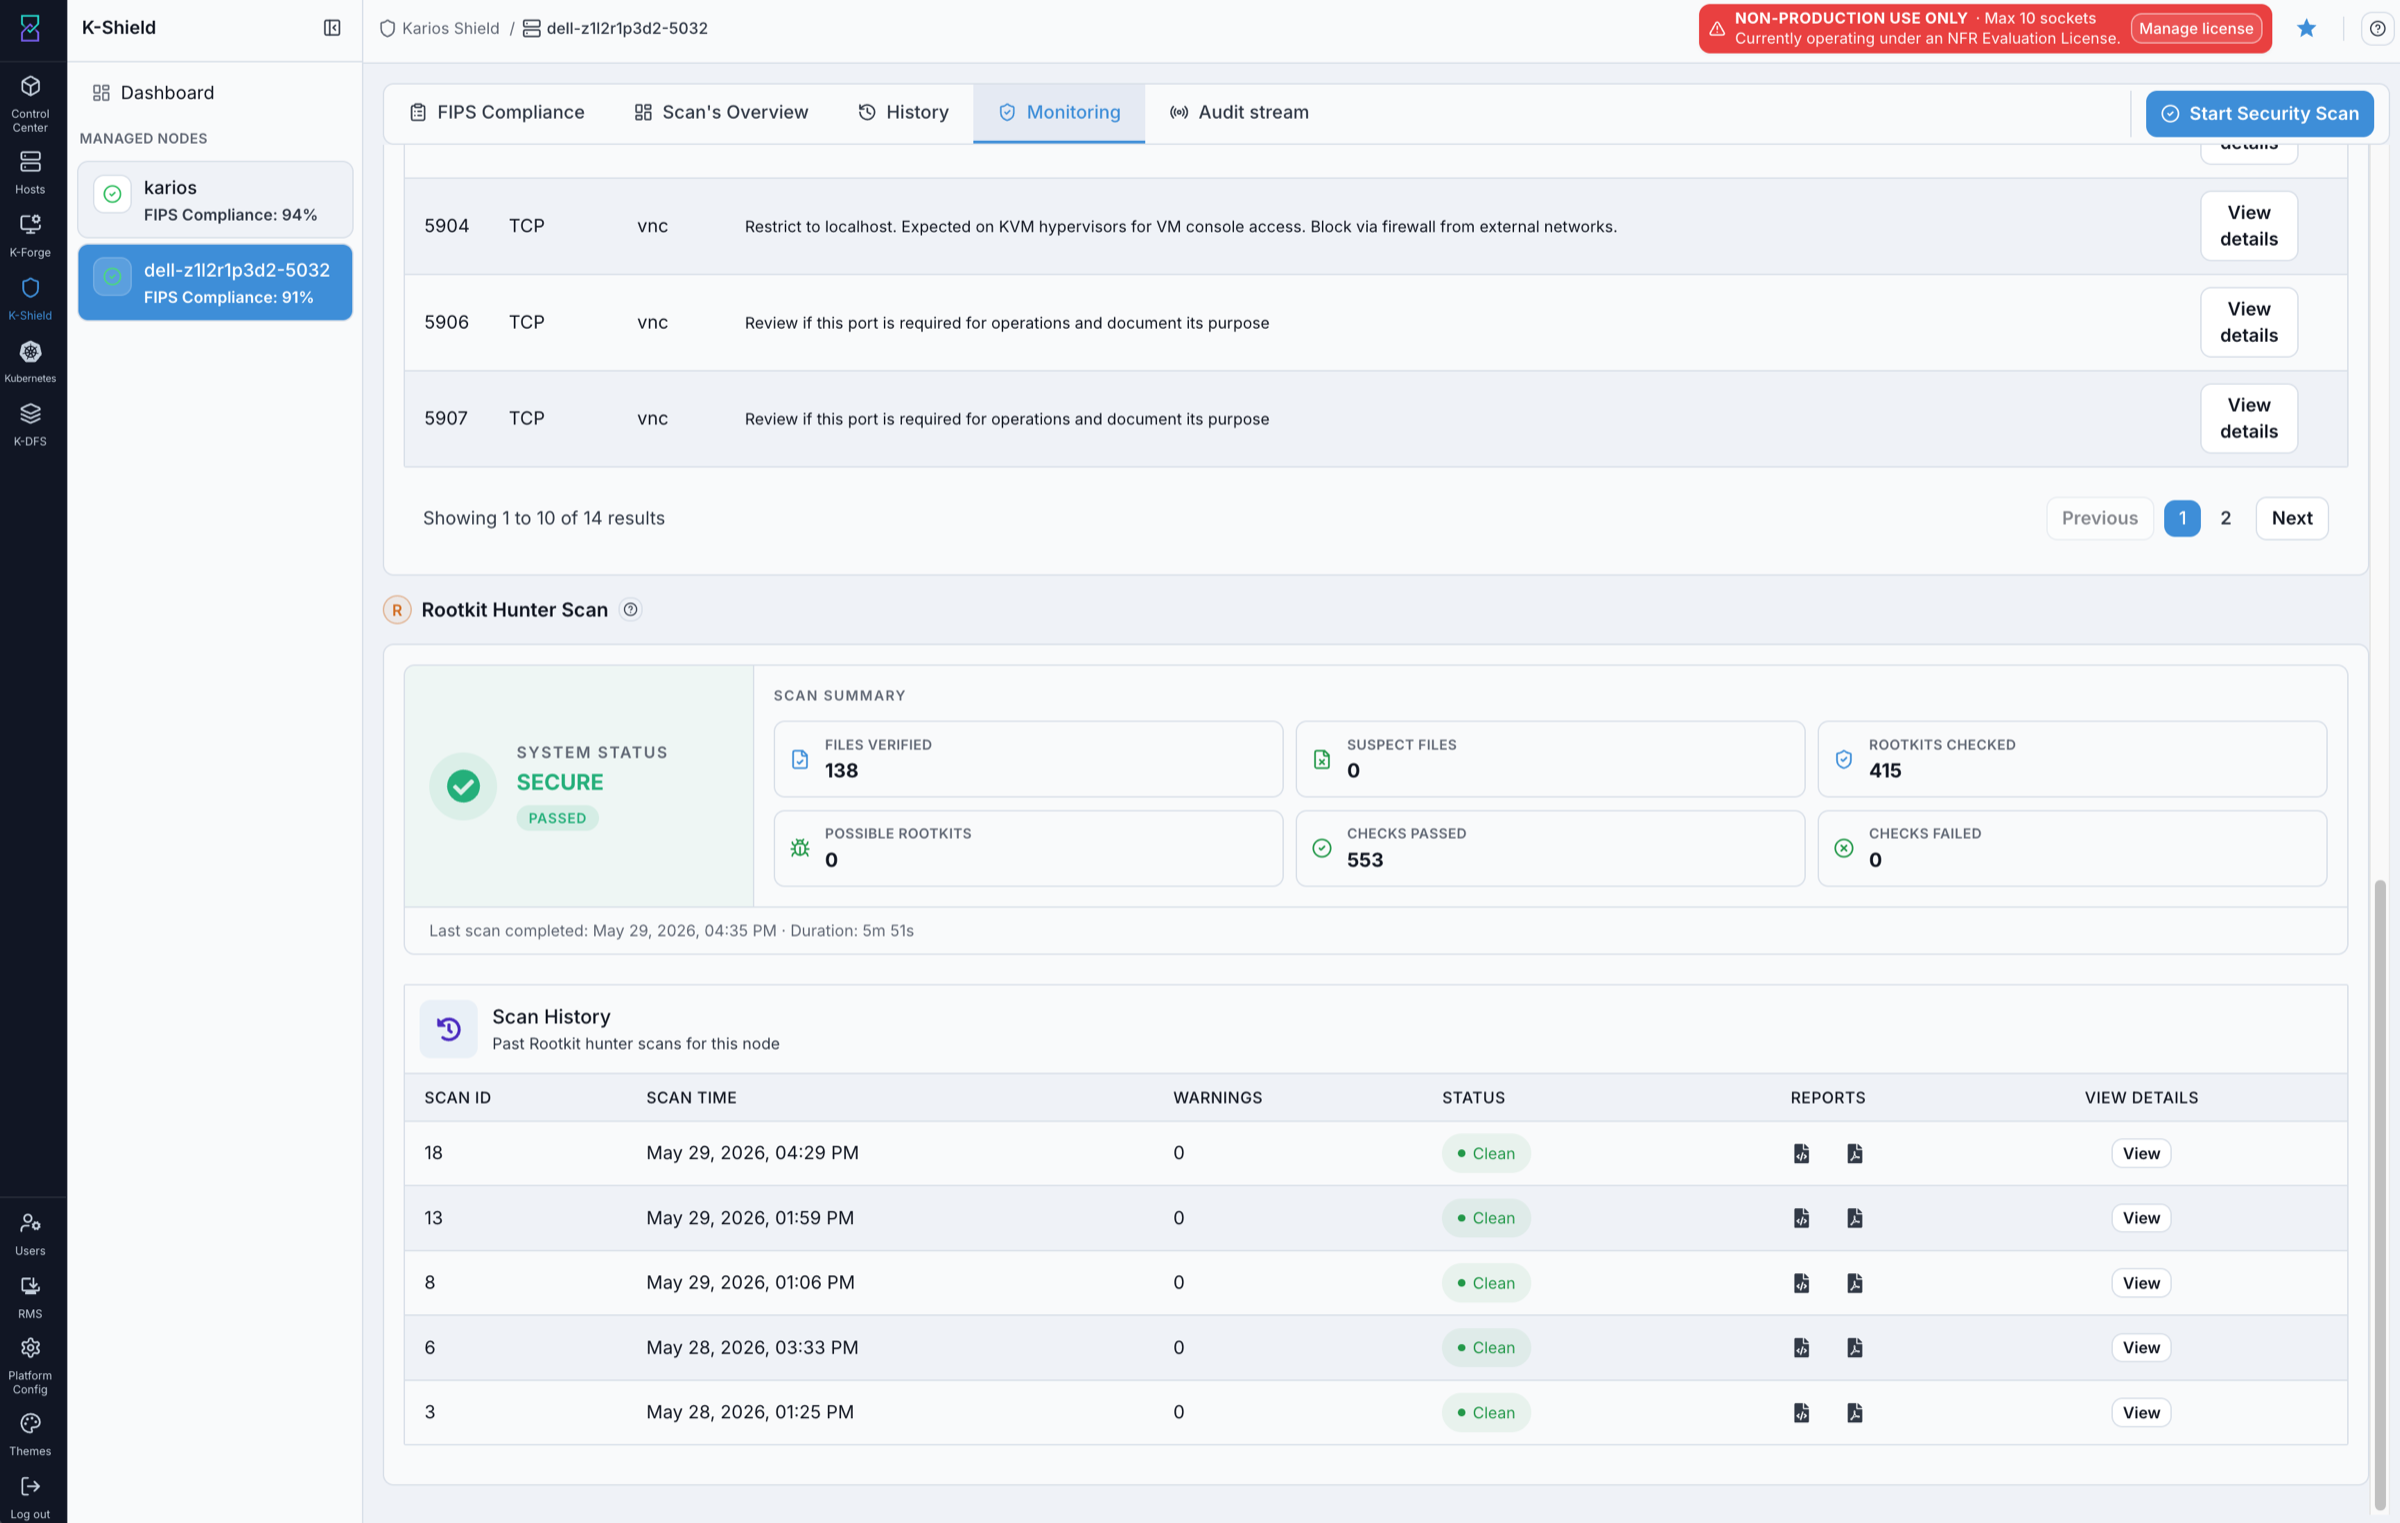
Monitoring overview with Nmap score and port summary.
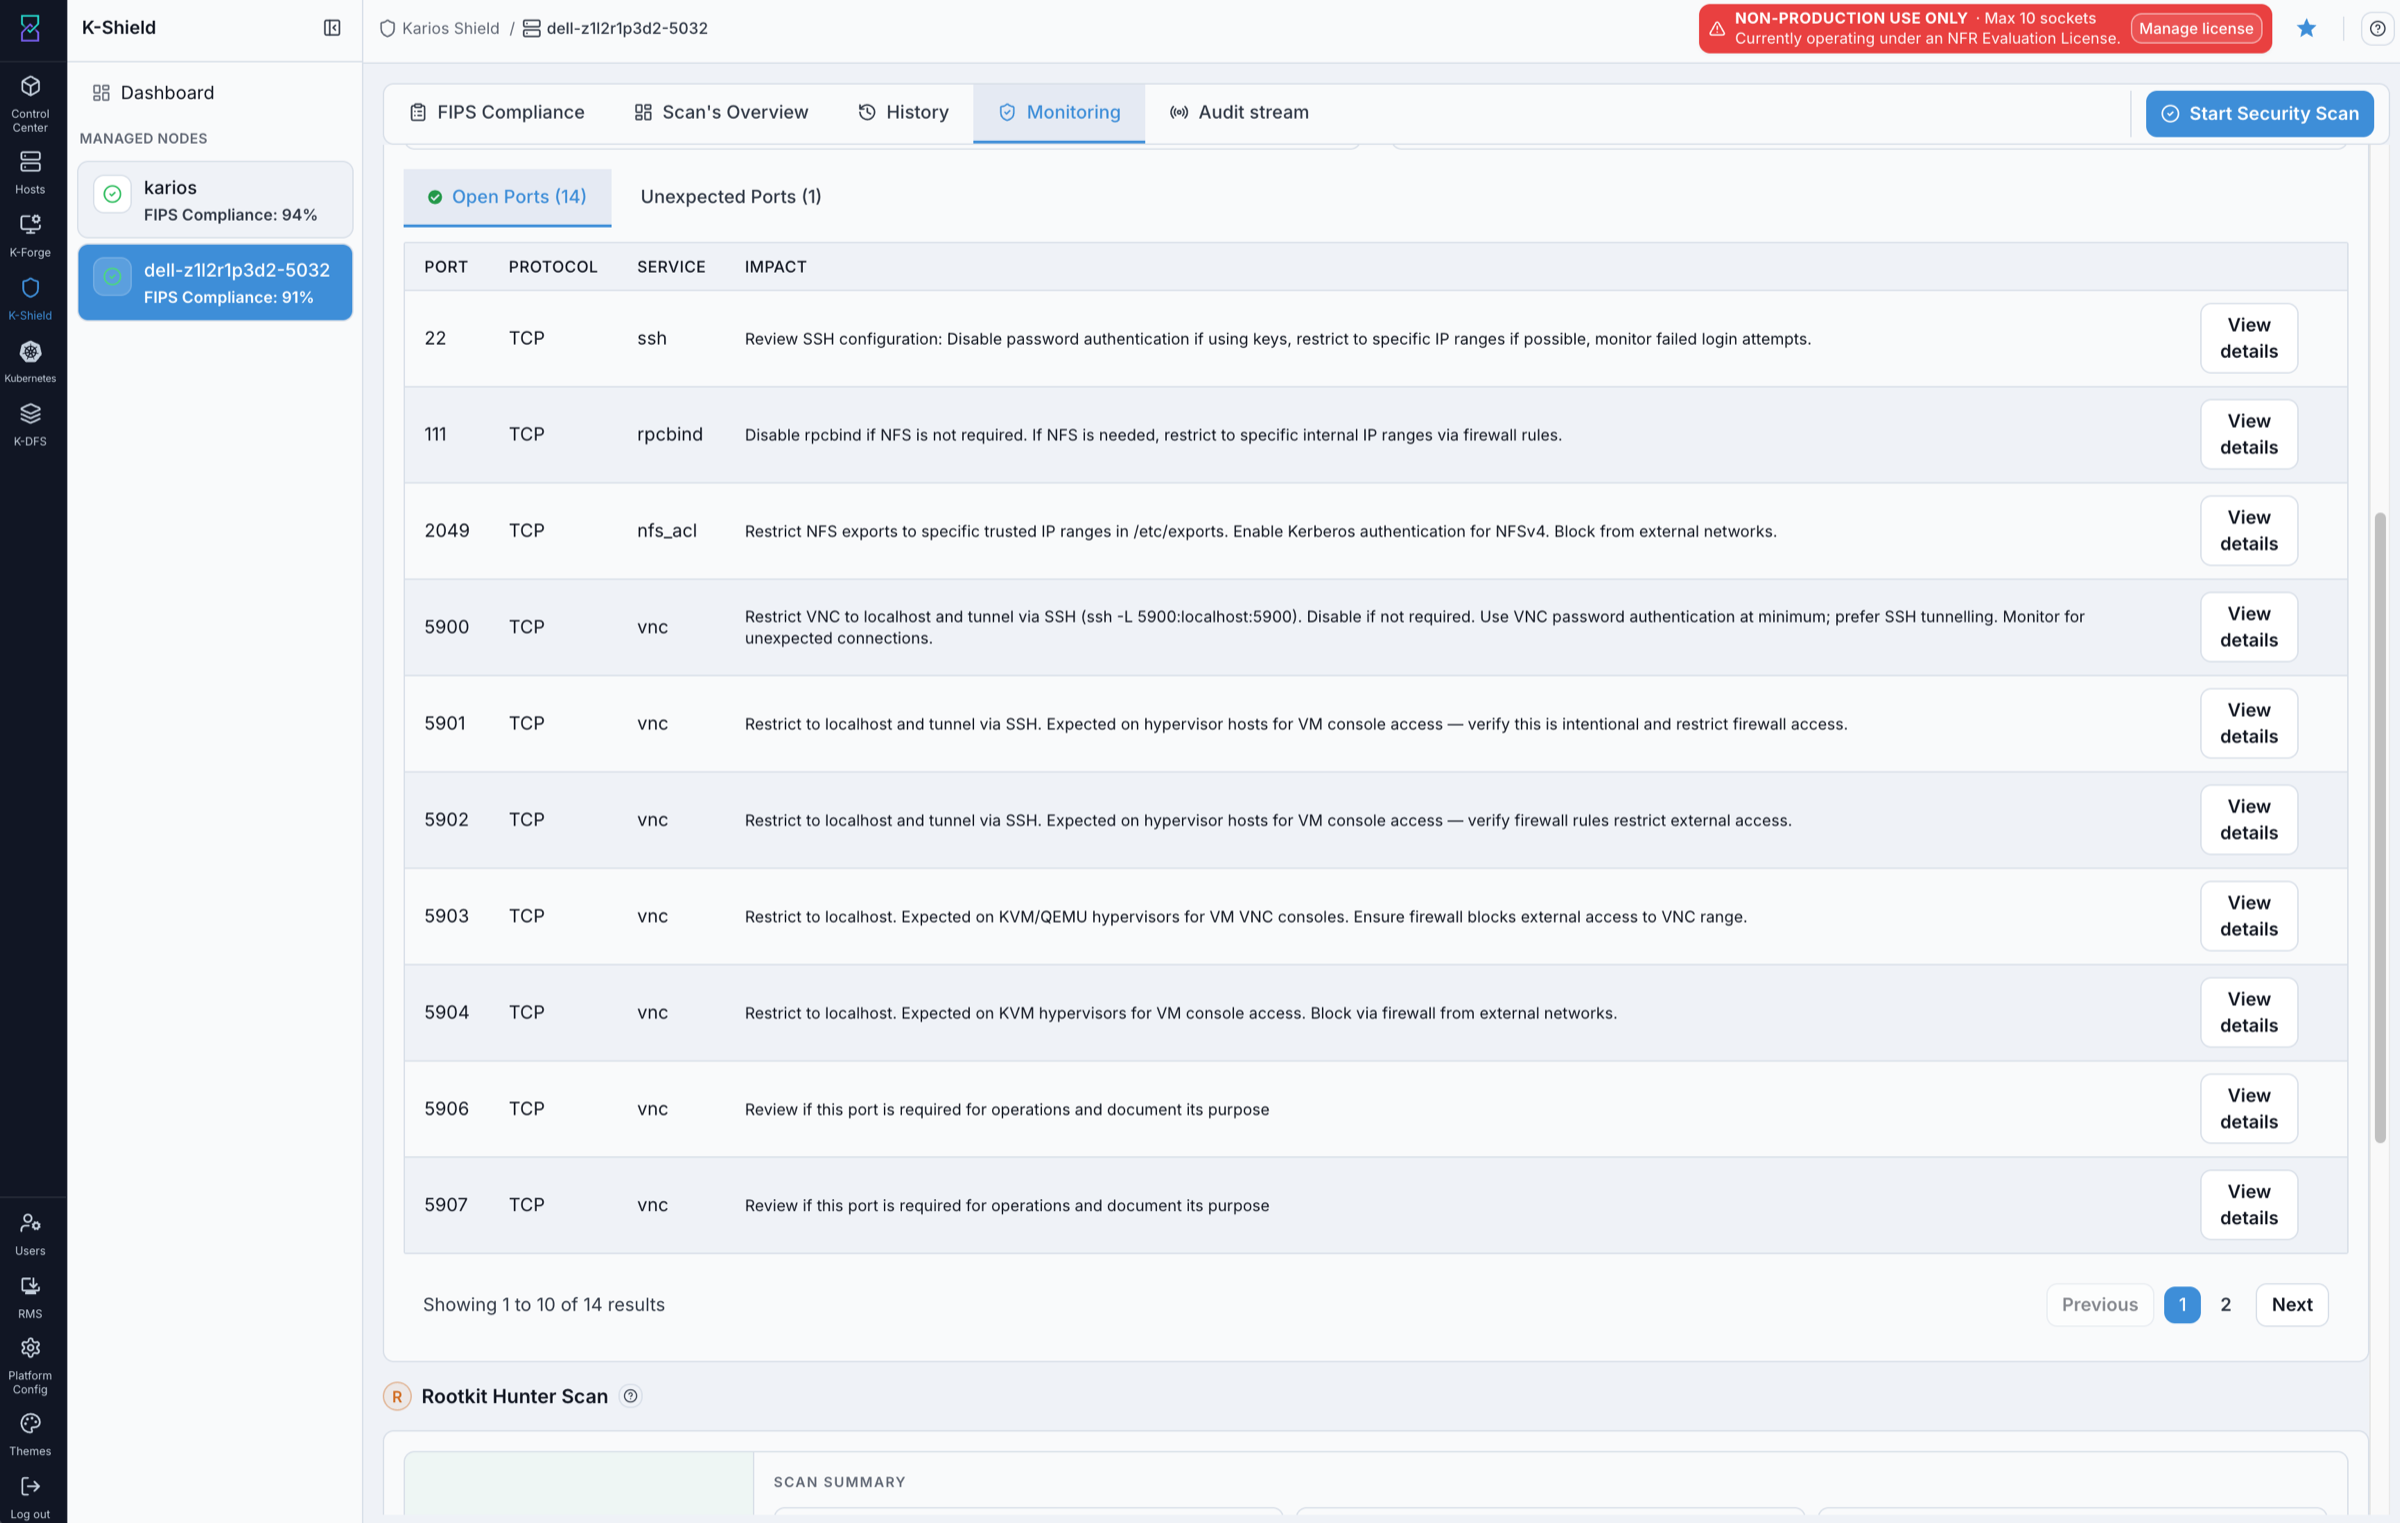
Open Ports table with per-port impact and details.
What this screenshot shows:
Cards:
NMAP Score(with risk band),Latest Port Scan Summary(ports count),Unexpected Ports,Rkhunter Status(for exampleCLEAN), andRkhunter Warnings.Nmap Scan Details(hostname, scan ID, scan time, total ports scanned).Port Security Risk Timelinechart.Open PortsandUnexpected Portssub-tabs.Open Portstable with port, protocol, service, impact text, andView details; rows are paginated.
What you can do from this screen:
Review the node’s network exposure and Nmap score.
Open per-port details and impact guidance.
Switch to
Unexpected Portsfor flagged ports.
Expected Outcome:
Monitoring cards, Nmap details, and the open-ports table are visible.
If this fails:
Refresh the monitoring tab.
Confirm the
Monitoringtab is selected.Confirm the monitoring cards are visible.
15. Unexpected Ports
When to Use:
Use this when triaging unexpected open ports on the Monitoring tab.
Purpose:
Review ports flagged as unexpected and act on them.
Steps:
Open the
Monitoringtab.Select
Unexpected Ports.Review each port, protocol, service, and status.
Click
View detailsfor impact and remediation guidance.
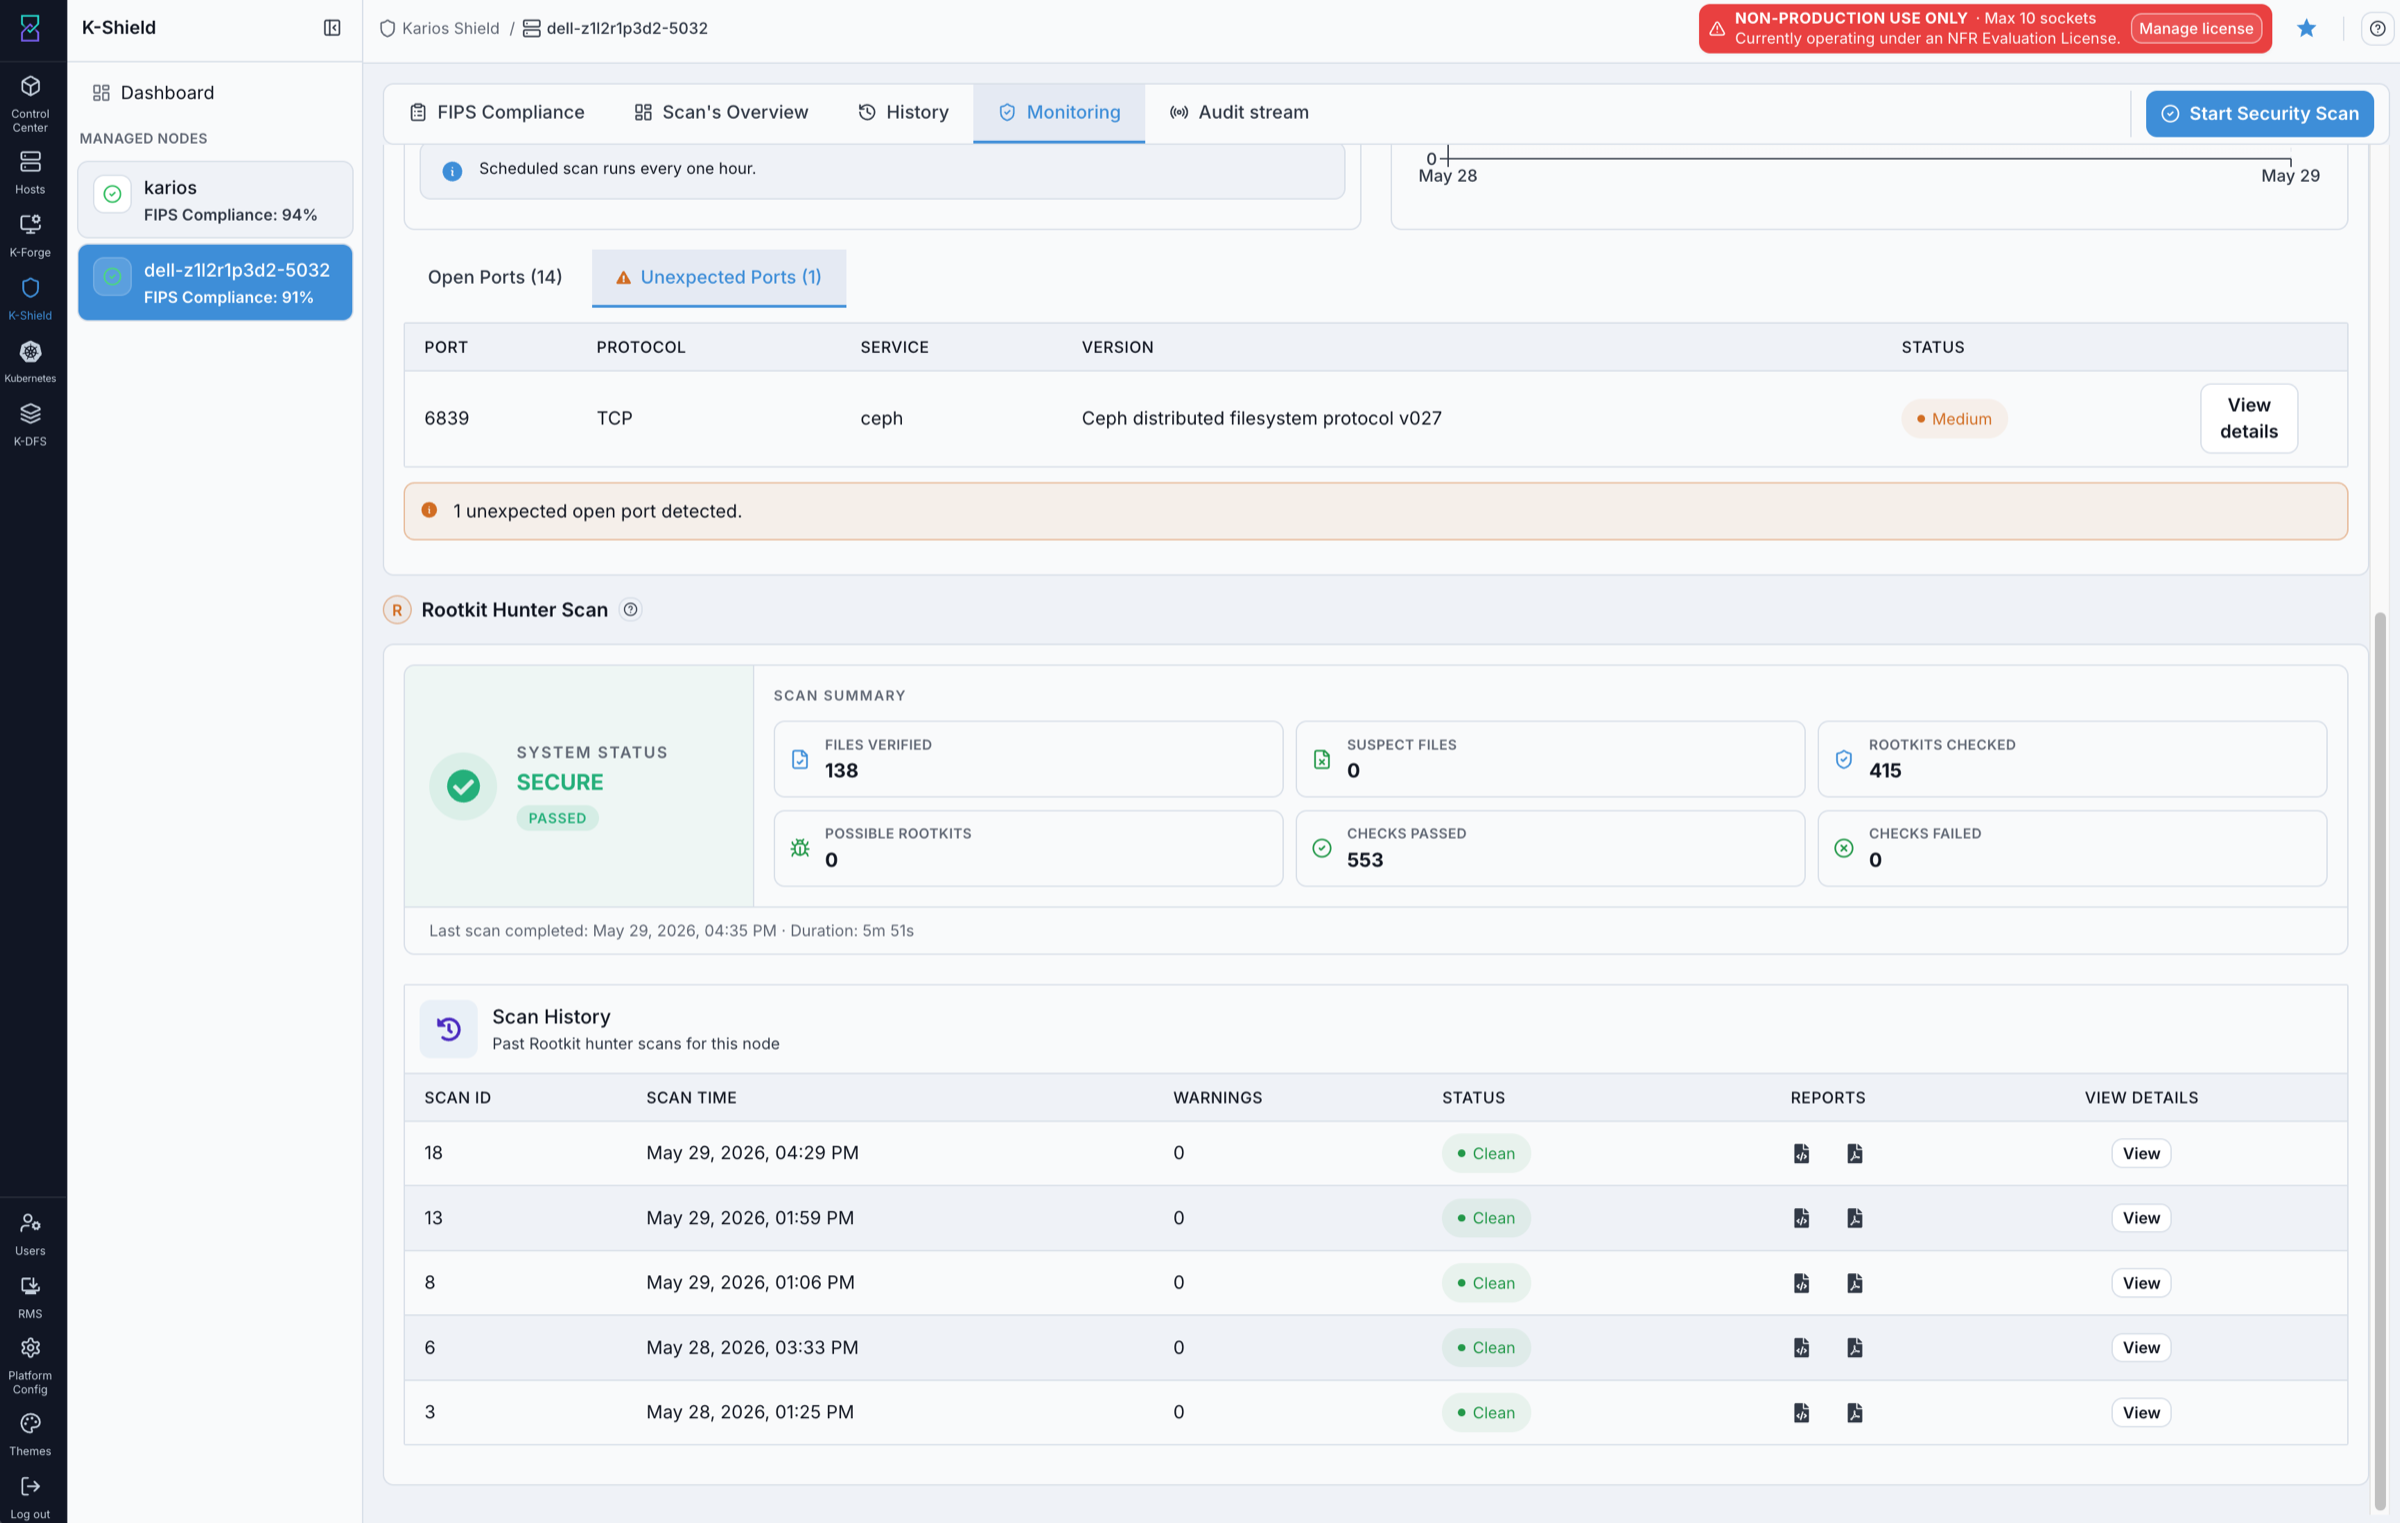
Unexpected open ports flagged for review.
What this screenshot shows:
Unexpected Portssub-tab table with port, protocol, service, version, status (severity), andView details.A banner stating how many unexpected open ports were detected.
What you can do from this screen:
Review unexpected ports and their severity.
Open per-port details and act on flagged ports.
Expected Outcome:
Unexpected-port rows are visible.
If this fails:
Refresh the monitoring tab.
Confirm
Unexpected Portsis selected.Confirm unexpected-port rows are visible.
16. Rootkit Hunter Scan
When to Use:
Use this when reviewing rootkit scan results for the node.
Purpose:
Confirm rootkit status and review the rootkit scan history.
Steps:
Open the
Monitoringtab.Scroll to
Rootkit Hunter Scan.Review
System Statusand the scan summary cards.Review the
Scan Historytable and download reports when needed.
Rootkit Hunter Scan summary and history.
What this screenshot shows:
System Status(for exampleSECURE/PASSED).Summary cards:
Files Verified,Suspect Files,Rootkits Checked,Possible Rootkits,Checks Passed, andChecks Failed.Last scan completed time and duration.
Scan Historytable with scan ID, scan time, warnings, status (for exampleClean), reports, andViewdetails.
What you can do from this screen:
Confirm the node’s rootkit status.
Review the rootkit scan history and download reports.
Expected Outcome:
Rootkit status and scan history are visible.
If this fails:
Refresh the monitoring tab.
Confirm the
Monitoringtab is selected.Confirm the Rootkit Hunter fields are visible.
17. Audit stream
Note
The Audit stream tab is optional. Configure it only when this node’s audit logs must
be forwarded to a SIEM. Scanning, monitoring, and compliance all work without it.
When to Use:
Use the Audit stream tab to forward this node’s audit logs to a SIEM and to monitor that forwarding.
Purpose:
Enable forwarding, set the SIEM endpoint, review the runtime and transport configuration, and watch live delivery status and raw audit lines.
Steps:
Open the
Audit streamtab.Turn on the
Audit streamtoggle, enter theSIEM EndpointURL, and clickSave changes(Resetdiscards unsaved changes;Refreshreloads config and status).Confirm the status chips (for example
HealthyandStream active).Review
Runtime Settings,Transport,Stream Status, andHTTP Metrics.Use the
SIEM Delivery StatusandRaw Audit Linessub-tabs to inspect activity.
Audit Stream Configuration
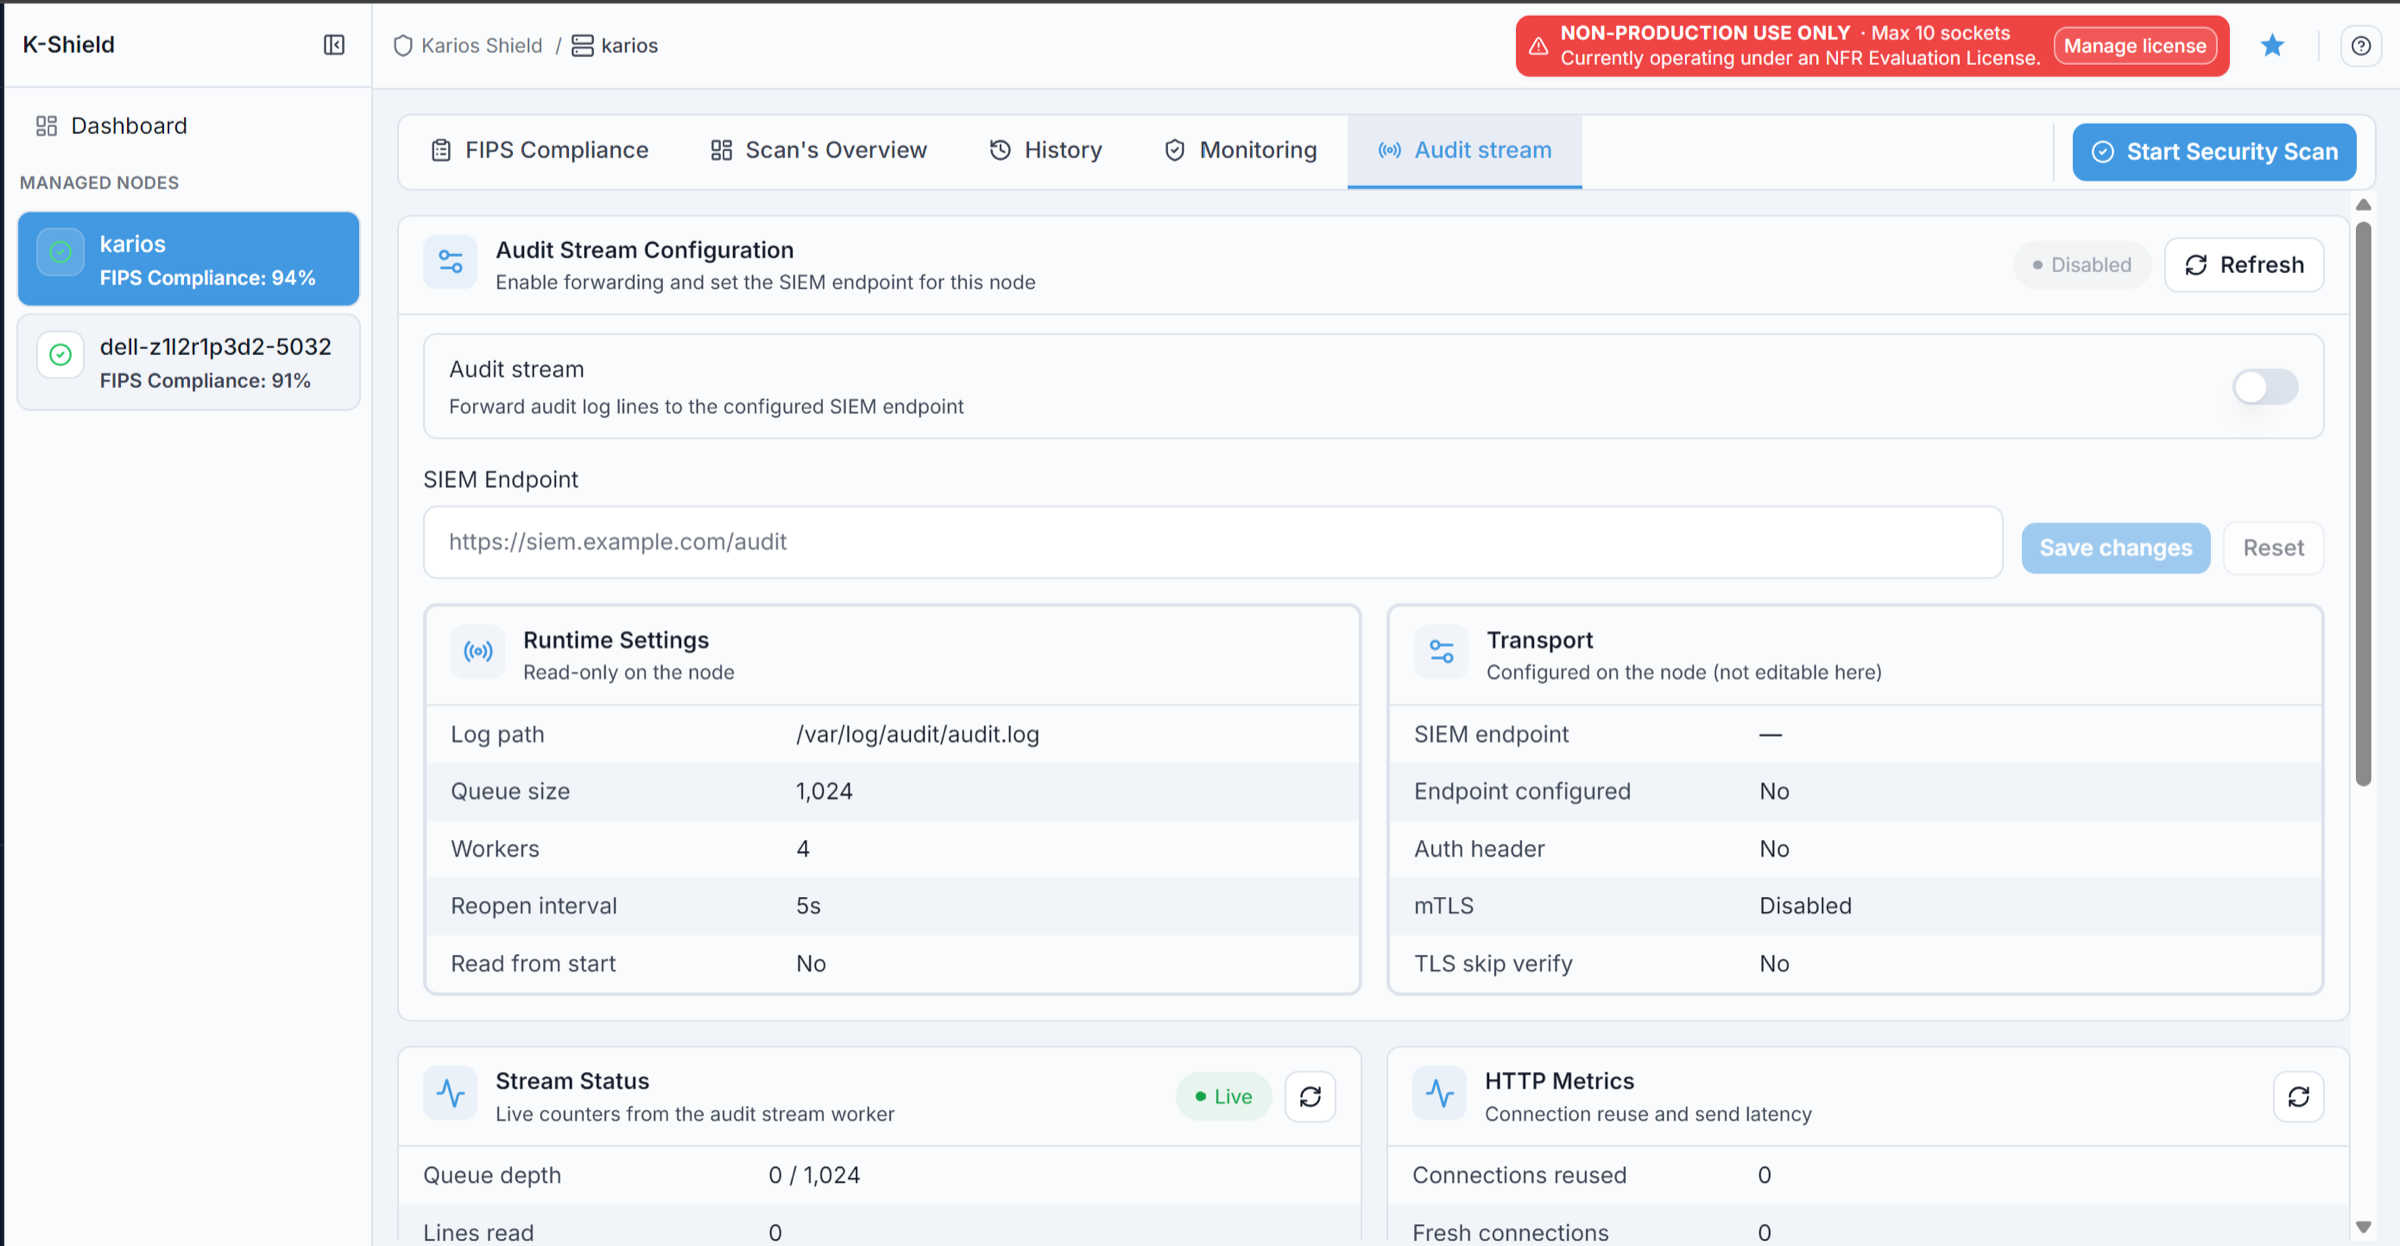
Audit stream disabled, before a SIEM endpoint is set.
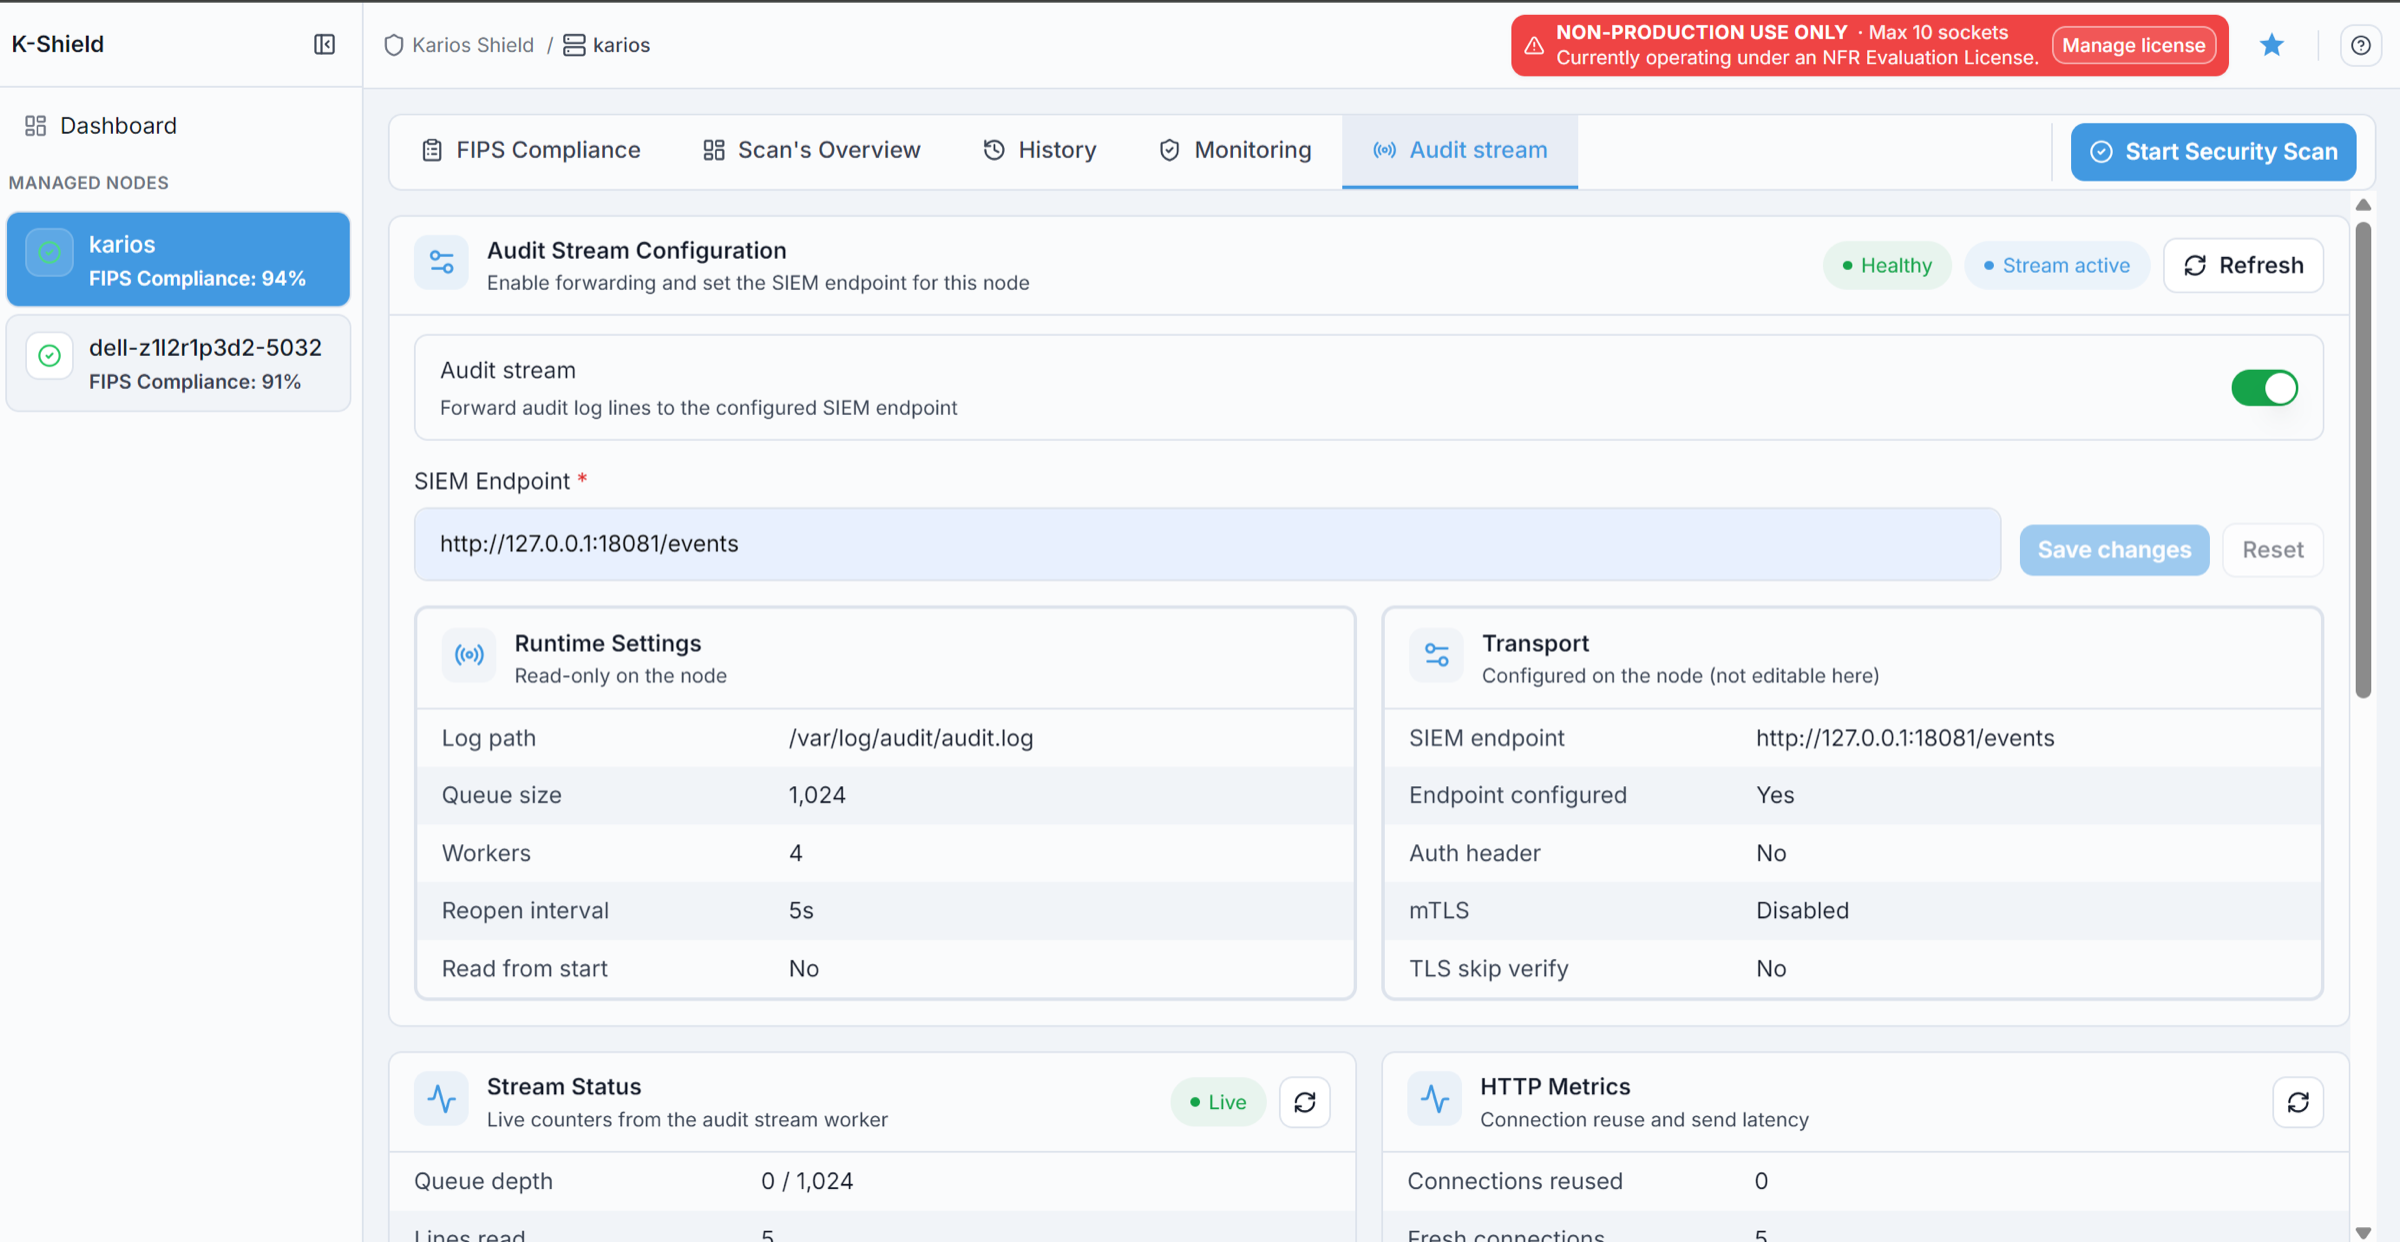
Audit stream enabled and forwarding to the configured SIEM endpoint.
Audit stream: enables or disables forwarding of audit log events from this node to the configured SIEM endpoint.SIEM Endpoint: the destination URL where audit events from this node are sent.Save changes/Reset/Refresh: apply the setting and endpoint; discard unsaved changes; reload the latest config, status, and activity.Runtime Settings— read-only node-side settings:Log path: the audit log file currently being monitored on the node.Queue size: the maximum number of audit events that can be buffered before sending.Workers: how many background workers are forwarding audit events.Reopen interval: how often the service rechecks and reopens the audit log file if needed.Read from start: whether the stream reads the file from the beginning or only new entries.
Transport— current delivery configuration and security settings:SIEM endpoint: the currently active endpoint configured on the node.Endpoint configured: whether a SIEM destination is configured on the node.Auth header: whether a custom authentication header is configured for outbound requests.mTLS: whether mutual TLS is enabled for SIEM delivery.TLS skip verify: whether TLS certificate verification is disabled for the endpoint.
Stream Status and HTTP Metrics
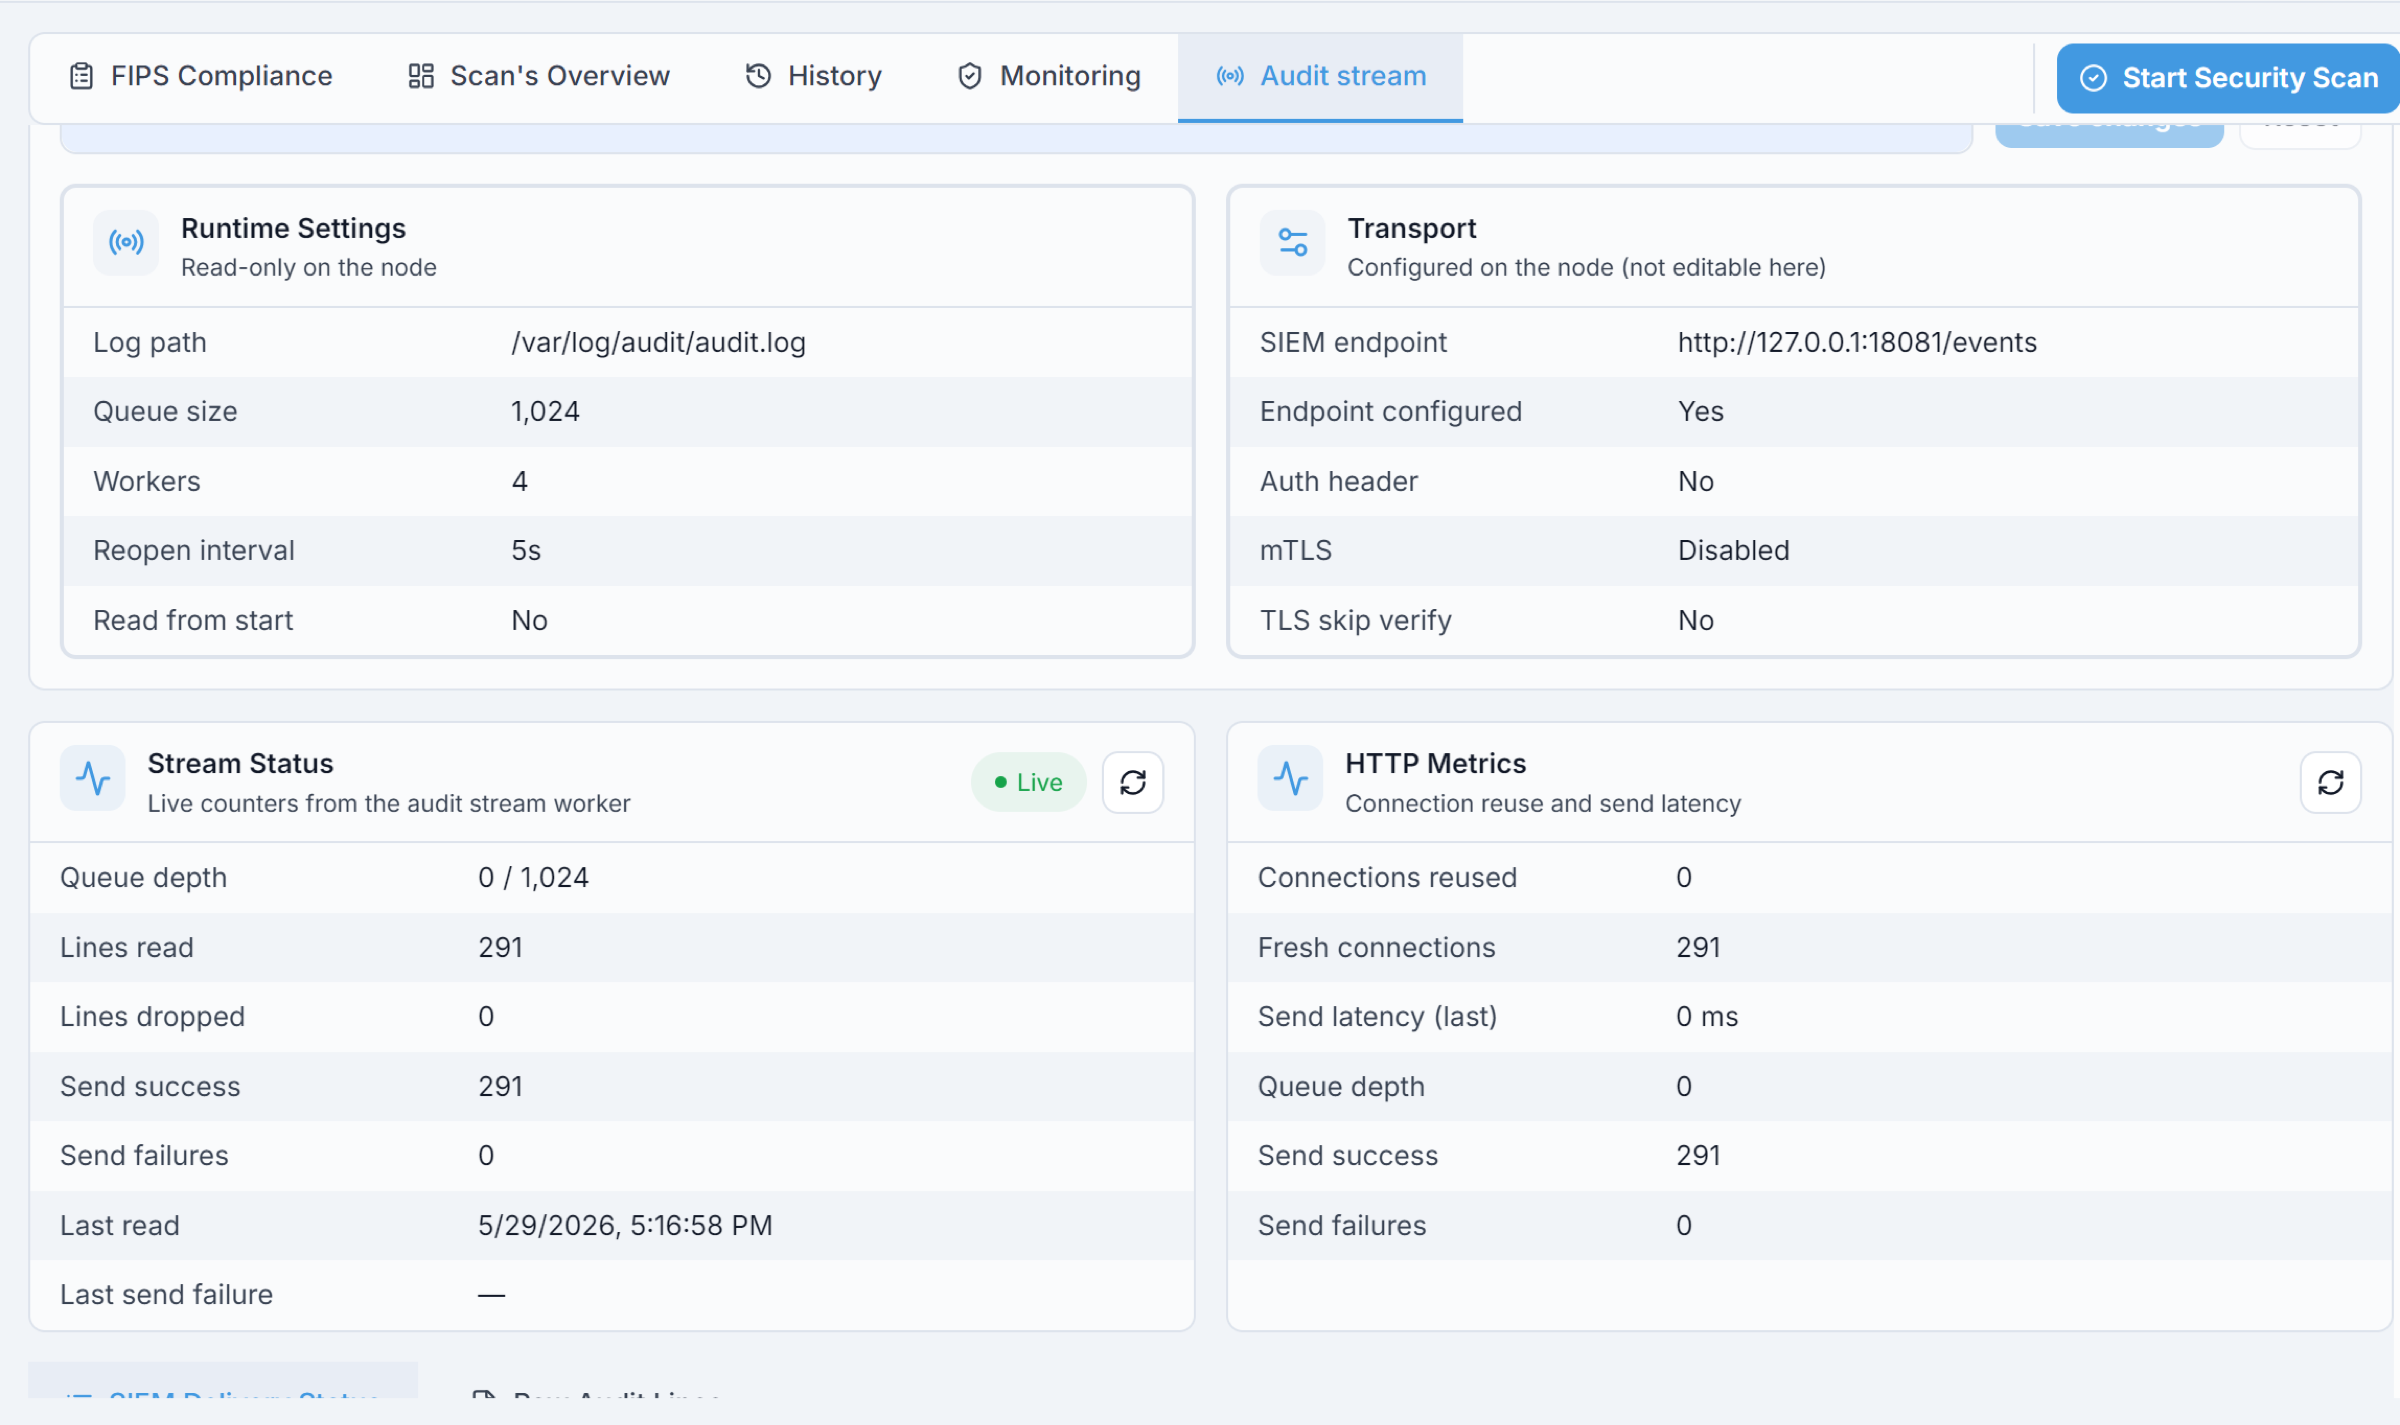
Live stream counters and HTTP delivery metrics.
Stream Status— live counters from the audit stream worker:Queue depth: events currently buffered versus total queue capacity.Lines read: total audit log lines read from the node.Lines dropped: audit lines dropped before delivery, usually due to queue pressure.Send success/Send failures: total events successfully forwarded / failed forwarding attempts.Last read/Last send failure: when the most recent line was read / the most recent failure occurred.
HTTP Metrics— delivery-layer connection usage and latency:Connections reused/Fresh connections: sends that reused an existing HTTP connection / opened a new one.Send latency (last): how long the most recent send took.Queue depth,Send success, andSend failureshere mirrorStream Statusfrom the delivery layer’s perspective.
SIEM Delivery Status
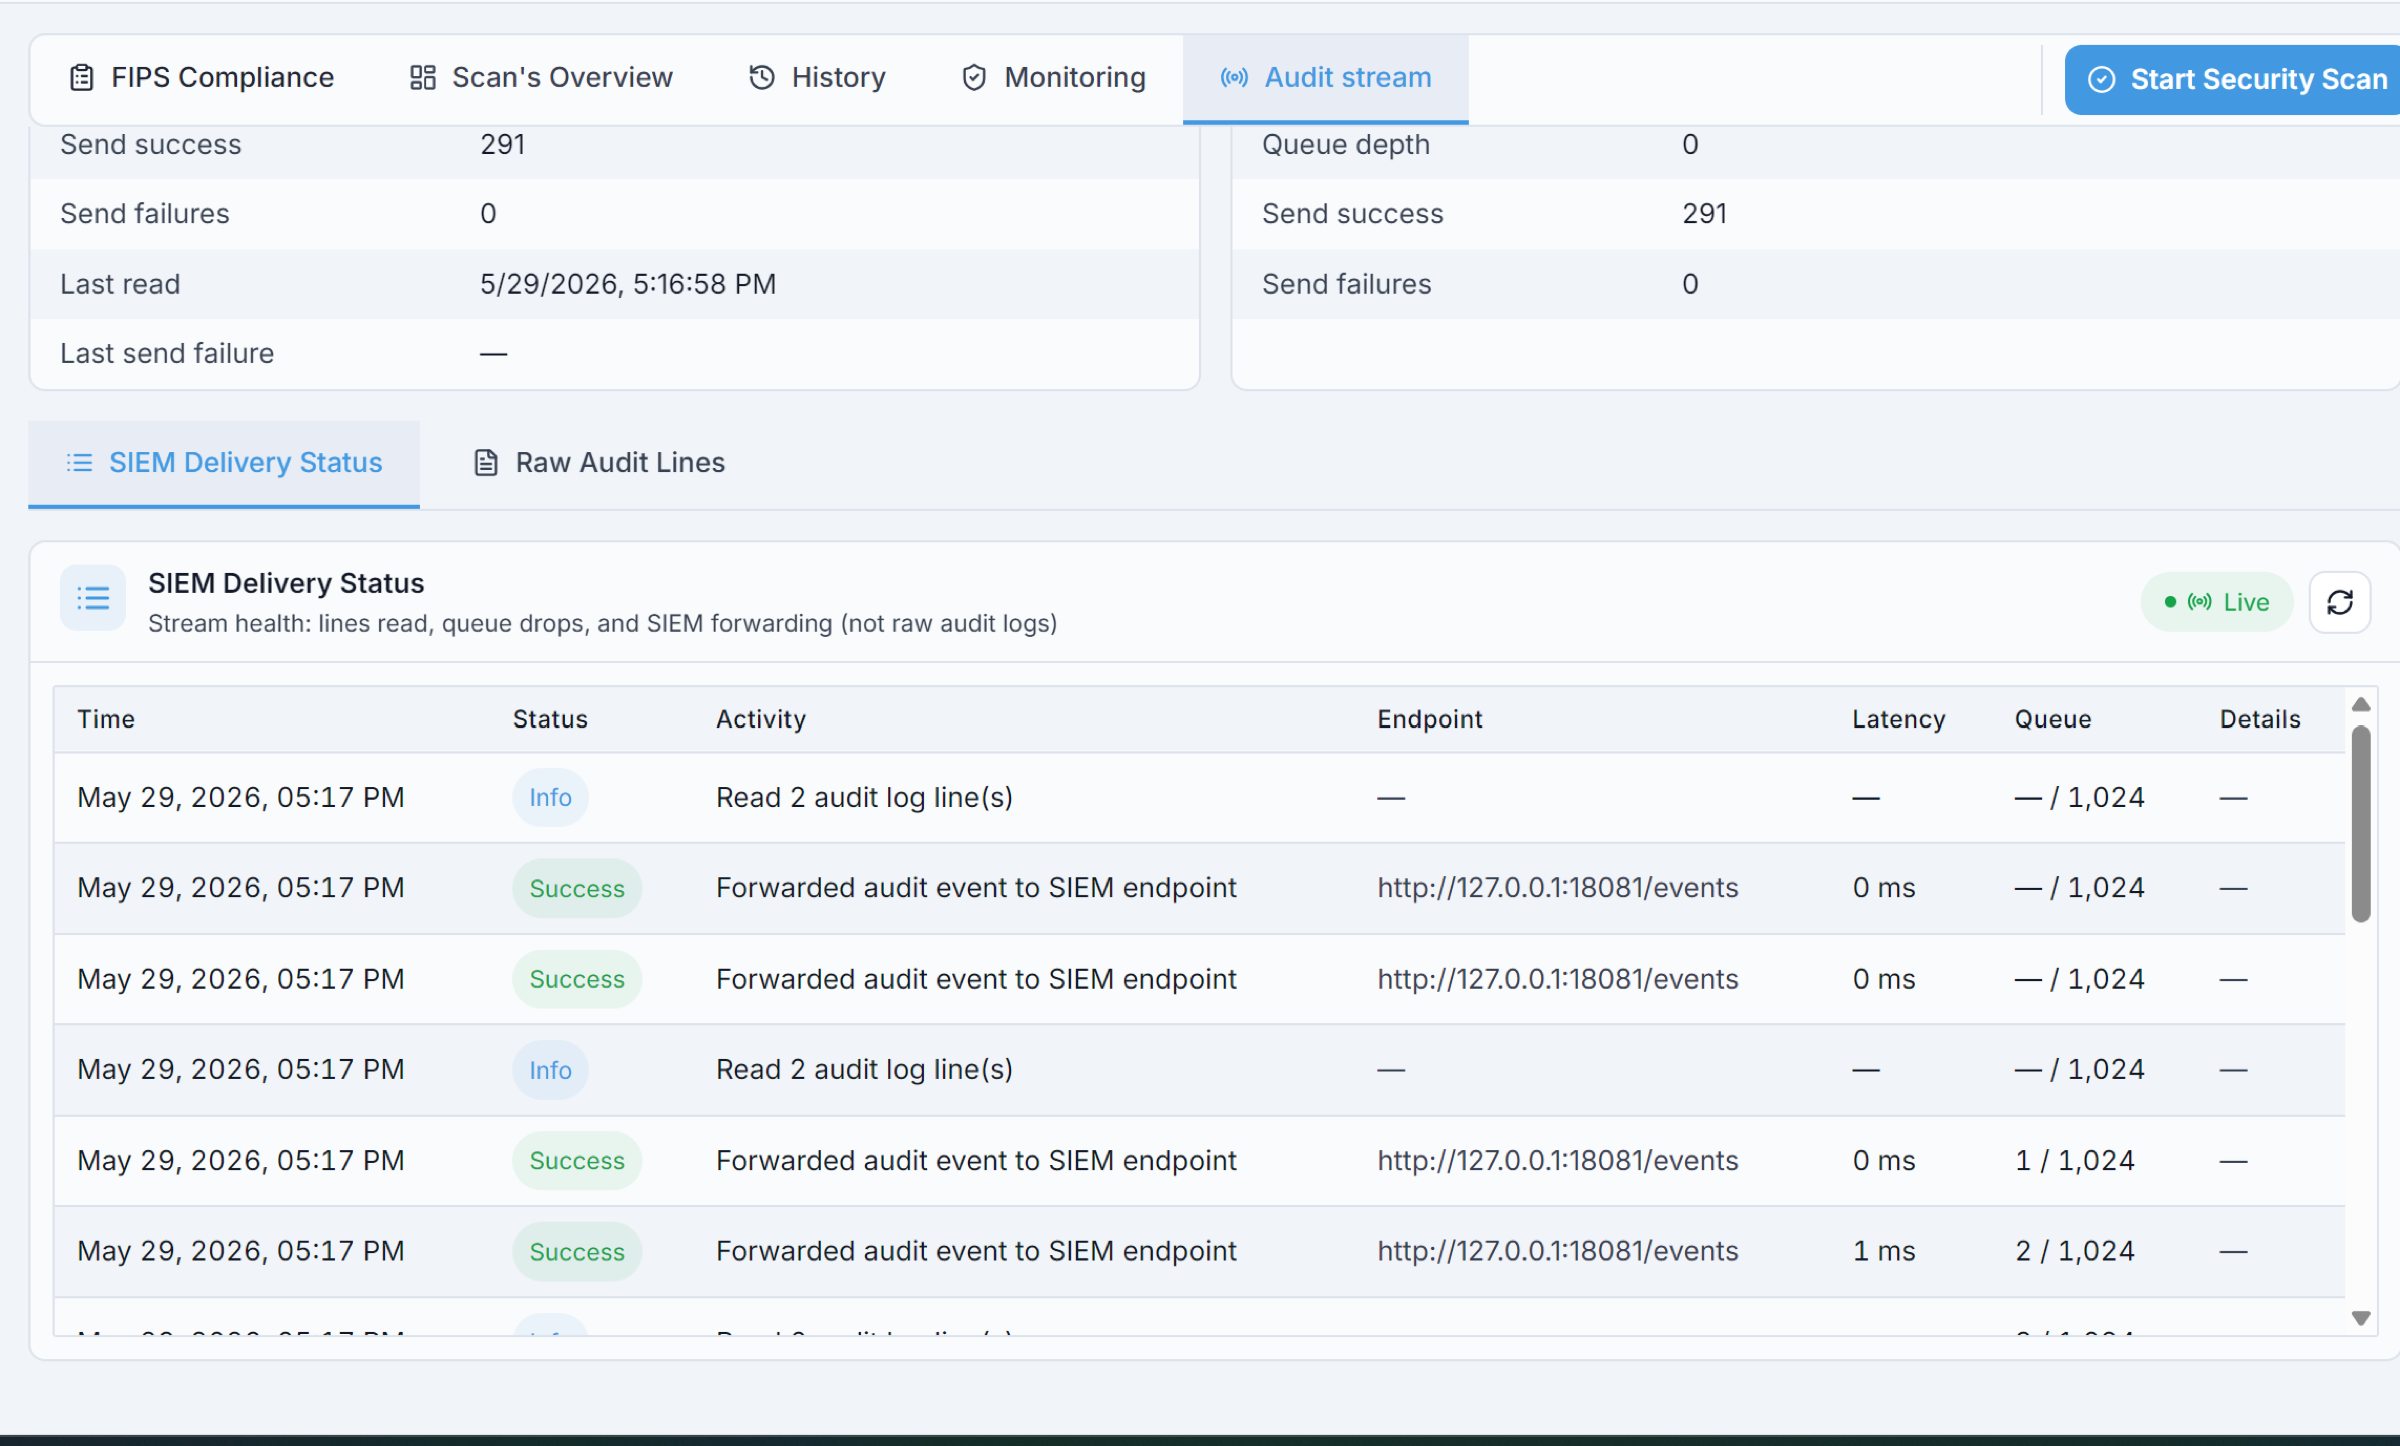
SIEM delivery status (stream health, not raw logs).
The SIEM Delivery Status sub-tab lists recent activity — reads, sends, failures, and
queue events. Columns: Time, Status (informational / successful / warning /
failed), Activity (what the worker did, such as reading lines or forwarding to SIEM),
Endpoint, Latency, Queue, and Details (extra context, including failure
details when present).
Raw Audit Lines
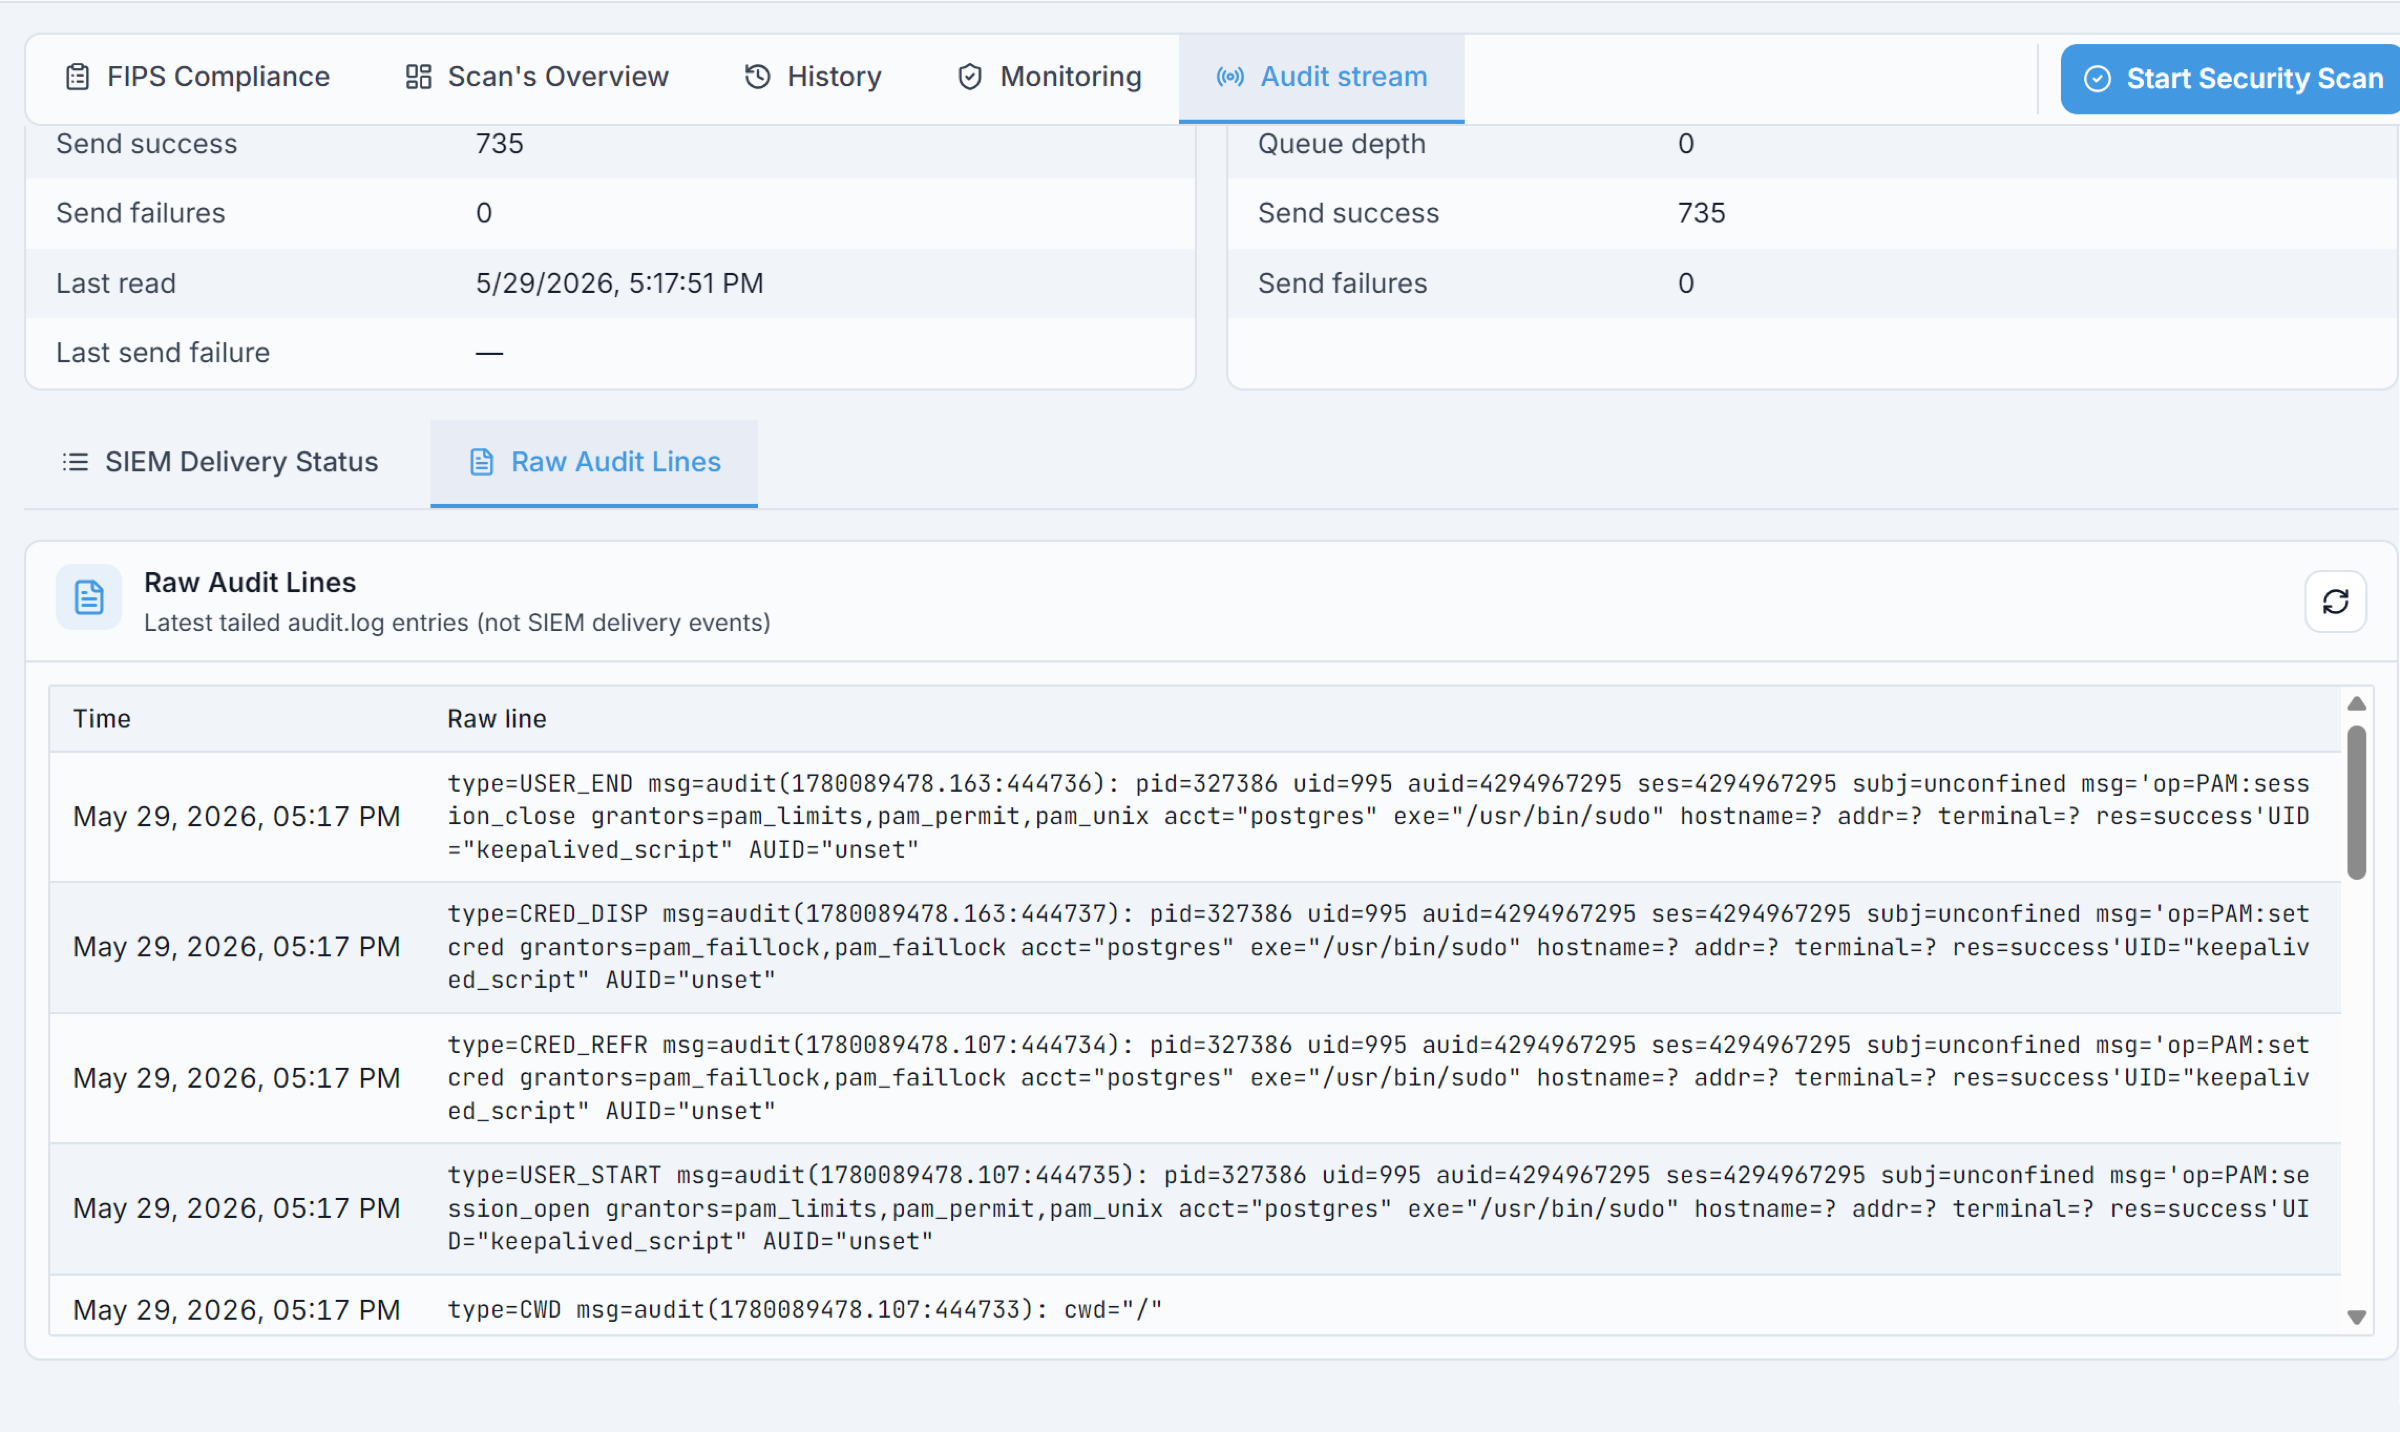
Latest tailed audit.log entries.
The Raw Audit Lines sub-tab shows the latest audit.log entries read from the node
(not SIEM delivery events). Columns: Time and Raw line — the exact audit record,
for example type=USER_END, type=CRED_DISP, or type=USER_START.
Expected Outcome:
Forwarding is enabled, the status shows
Healthy/Stream active, andSIEM Delivery StatusshowsSuccessrows.
If this fails:
Confirm the
SIEM EndpointURL is valid and reachable from the node; clickSave changesandRefresh.Check
Stream Status/HTTP Metricsfor non-zeroLines droppedorSend failures.Confirm there is recent activity in
audit.logand the stream is running.
18. Troubleshooting
Use the per-section If this fails notes first. For cross-cutting issues, start here:
Symptom |
First actions |
|---|---|
A tab is empty / no data |
No scan has run yet — run a scan (see |
Scan does not start or fails |
Confirm your role has scan permission and the node is online in the left panel; |
Node not listed / not managed |
Confirm the node is onboarded and discovered, |
Score or findings not updating |
|
Reports will not download |
Confirm the scan is |
Audit stream not forwarding |
Confirm |
Unexpected ports or rootkit warnings |
Review in |
Escalate when a controlled retry does not resolve the issue. Include the node name, scan ID,
timestamp, severity summary, and impact scope, and contact support@karios.com for Karios
platform escalation.
→ Next: K-Trace