Hosts
Path: Left sidebar > Infrastructure > Hosts
Host Inventory Overview
The Hosts page lists every node that participates in the Ceph cluster, along with its hardware profile and the daemons it runs.
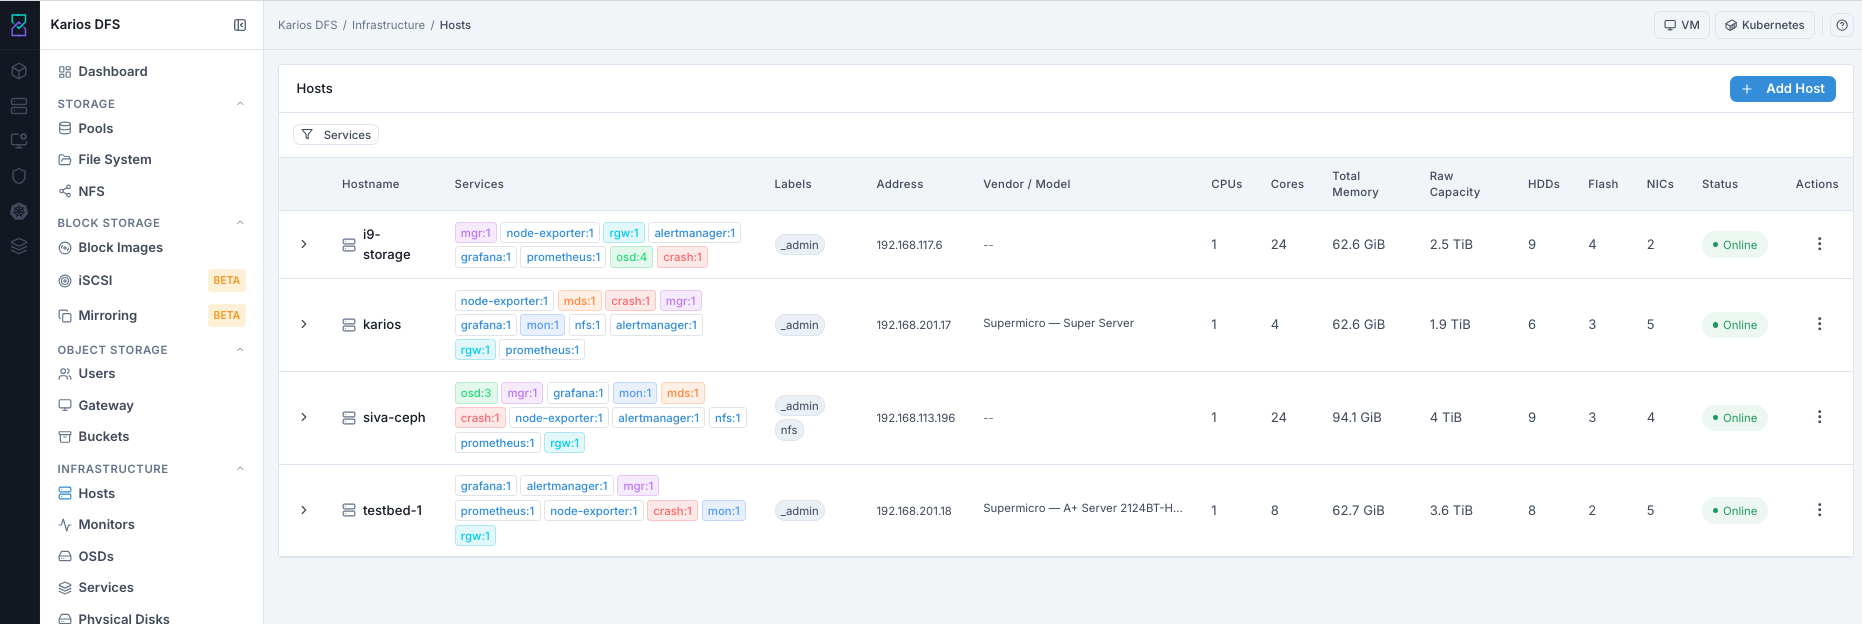
What This Screenshot Shows: Hosts Dashboard (UI Reference; Values Depend On Your Environment).
Hosts List - Column Reference
Column |
What It Shows |
|---|---|
Hostname |
The name of the node as registered in the cluster (FQDN or short name) |
Services |
List of daemon types running on this host (for example |
Labels |
Ceph placement labels assigned to this host, used by the orchestrator to decide which services to place here |
Address |
Primary network IP address of this host |
Vendor / Model |
Hardware vendor and server model from BMC or DMI data. |
CPUs |
Number of physical CPU sockets |
Cores |
Total physical CPU cores |
Total Memory |
Total installed RAM |
Raw Capacity |
Sum of disk capacity on this host |
HDDs |
Number of spinning hard drives |
Flash |
Number of SSDs and NVMe drives |
NICs |
Number of network interface cards |
Status |
Host reachability and maintenance state. |
Actions |
Edit labels, enter maintenance, remove host |
Tip
Services badges show daemon type and count per host. Example: osd:4 means
4 OSD daemons are running on that host.
Tip
Service badge colors help quick scanning. Example mappings include: OSD (orange), RGW (blue), MDS (teal), MGR (green), and crash (pink).
Tip
Labels tell the Ceph orchestrator which hosts are eligible for each service type. A host without the correct label will not receive that service.
What You See
Tab |
Description |
|---|---|
Daemons |
Lists all Ceph daemons running on the host with type, ID, version, and current status. |
Devices |
Shows all block devices visible to Ceph on this host, including device path, type, available status, and OSD ID if in use. |
Device Health (SMART) |
SMART telemetry for every disk on the host. Use wear level and reallocated sectors to detect early disk failure risk. |
Performance |
Per-host CPU, memory, and network utilization metrics from Prometheus |
How To Filter Hosts By Service
The Services filter at the top-left of the Hosts list lets you show only hosts running a selected daemon type.
Purpose:
To quickly identify which hosts run a specific service.
To verify service placement after a deployment change.
When to Use:
Before changing labels or maintenance state.
During service troubleshooting and placement checks.
Steps:
Open
Infrastructure > Hosts.Click the
Servicesfilter (funnel icon).Select one or more service type checkboxes (for example
mon,mgr,osd,mds).Review the filtered host list.
Clear all checkboxes to return to full list.
Expected Outcome:
You isolate host rows to only the service types you need to inspect.
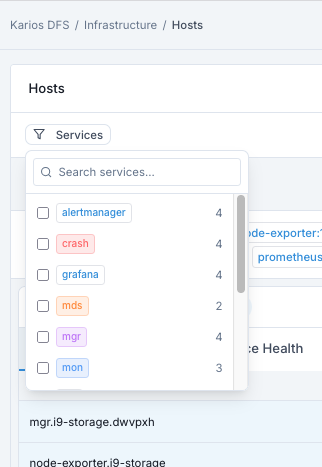
What This Screenshot Shows: Hosts Service Filter (UI Reference; Values Depend On Your Environment).
How To Add A Host
Path: Infrastructure > Hosts > + Add Host
Prerequisite:
Before adding a host, your administrator must configure the new host with the cephadm SSH key. The cluster uses SSH to manage hosts.
Purpose:
To register a new physical node so it can run Ceph daemons.
To expand cluster capacity and future placement options.
When to Use:
During cluster expansion.
Before deploying services on a newly provisioned host.
Steps:
Open
Infrastructure > Hosts.Click
+ Add Host.Enter
Hostname.Enter
Address.Add
Labelsif required.Leave
Maintenance Modeunchecked for normal registration.Click
Add Host.
Expected Outcome:
Host appears in list within seconds.
Orchestrator connects via SSH and discovers hardware profile.
CPU, memory, capacity, and device counts populate.
Host becomes eligible for service deployment based on labels.
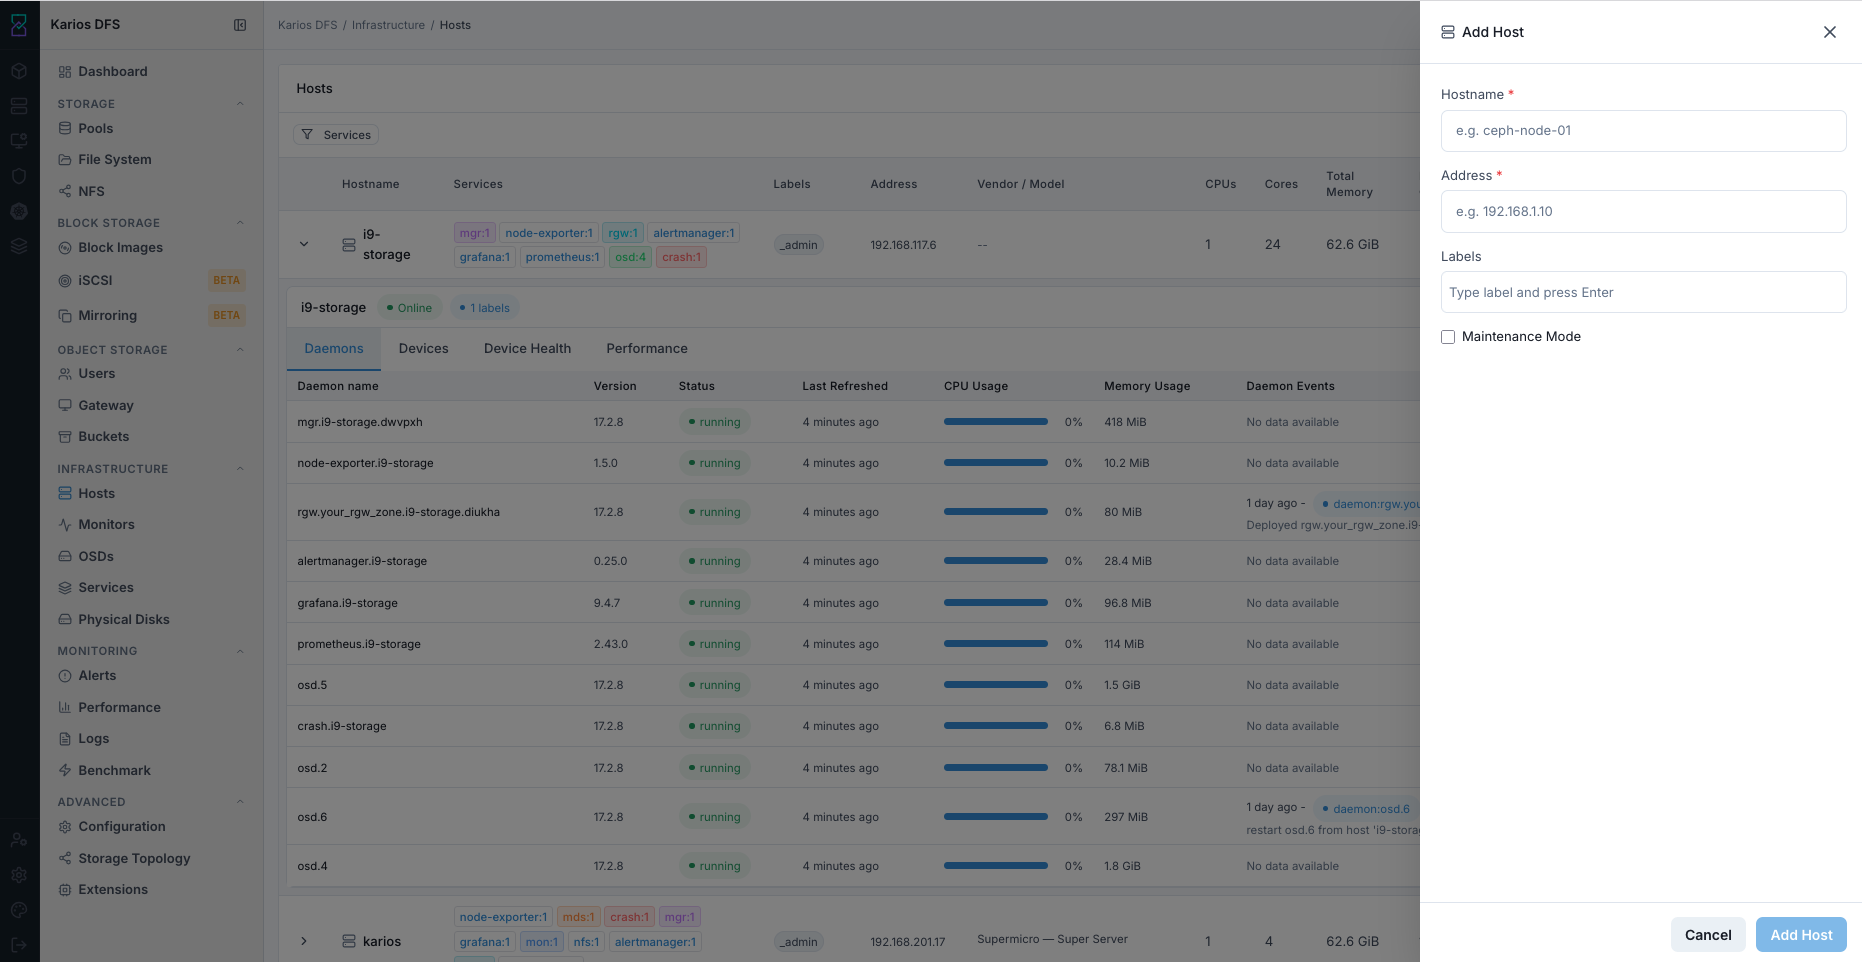
What This Screenshot Shows: Add Host Panel (UI Reference; Values Depend On Your Environment).
Field |
Value / Options |
Description |
|---|---|---|
Hostname * |
Text input |
Required. Must match the node hostname. |
Address * |
Text input |
Required. IP address used by the cluster. |
Labels |
Text tags |
Optional. Controls service placement eligibility. |
Maintenance Mode |
Checkbox |
Optional. Puts host in maintenance mode immediately. |
Common Labels Reference:
Label |
Purpose |
|---|---|
osd |
Host is eligible for OSD placement |
mon |
Host is eligible for Monitor placement |
mgr |
Host is eligible for Manager placement |
rgw |
Host is eligible for Gateway placement |
mds |
Host is eligible for MDS placement |
_no_schedule |
Prevents placement of new daemons on this host |
_admin |
Host receives admin keyring |
Host Row Actions - ... Menu
Click the row Actions menu on the right of a host row.
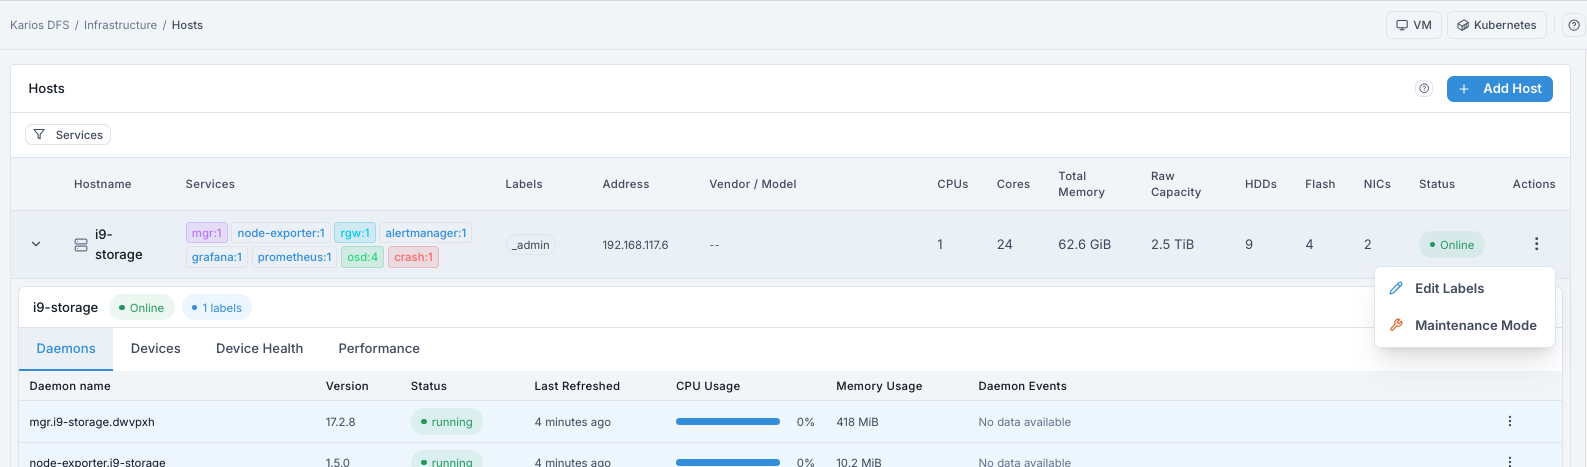
What This Screenshot Shows: Host Row Actions Menu (UI Reference; Values Depend On Your Environment).
Edit Labels
Purpose:
Opens label editor for this host.
Steps:
Click
...on host row.Click
Edit Labels.Add/remove labels.
Click
Save.
Expected Outcome:
Orchestrator immediately uses updated labels for placement decisions.
Adding a label can make the host eligible for new service deployment.
Removing a label can trigger daemon migration off this host.
Warning
Removing critical labels from essential hosts can destabilize placement. Review impact before removing labels.
Maintenance Mode
Purpose:
Places host into maintenance mode for planned hardware work.
Steps:
Click
...on host row.Click
Maintenance Mode.Confirm dialog.
What Happens During Maintenance:
OSDs on this host are marked out and data rebalances.
Non-essential daemons are stopped.
Host state reflects maintenance mode.
Expected Outcome:
Host is safe for planned physical work after rebalancing completes.
Important
Do not power off the host until rebalancing is complete and the Dashboard
returns to active+clean PG state.
Warning
Do not put multiple hosts into maintenance mode simultaneously unless replication safety on remaining hosts is verified.
Remove Host
Purpose:
Deregisters a host from the cluster after daemons are stopped.
Steps:
Verify all non-essential daemons are stopped on the host.
Verify all OSDs on that host are removed or
down+out.Click
...on host row.Click
Remove Host.Confirm removal dialog.
Expected Outcome:
Host is removed from Ceph host inventory and no longer receives deployments.
Warning
Remove Host requires all OSDs on that host to be removed or down+out.
Do not remove hosts still serving active data placement.
Host Detail Tabs
Click chevron > to expand a host row.
Daemons Tab
Lists all Ceph daemons currently running on this host.
Column |
What It Shows |
|---|---|
Daemon name |
Full daemon identifier |
Version |
Ceph version running for that daemon instance |
Status |
|
Last Refreshed |
Time since last status update |
CPU Usage |
Current CPU usage percent |
Memory Usage |
Current daemon memory usage |
Daemon Events |
Recent deployment/restart/error events. |
Steps:
Open
Daemonstab.Verify all daemons show
running.Inspect recent daemon events for non-running instances.
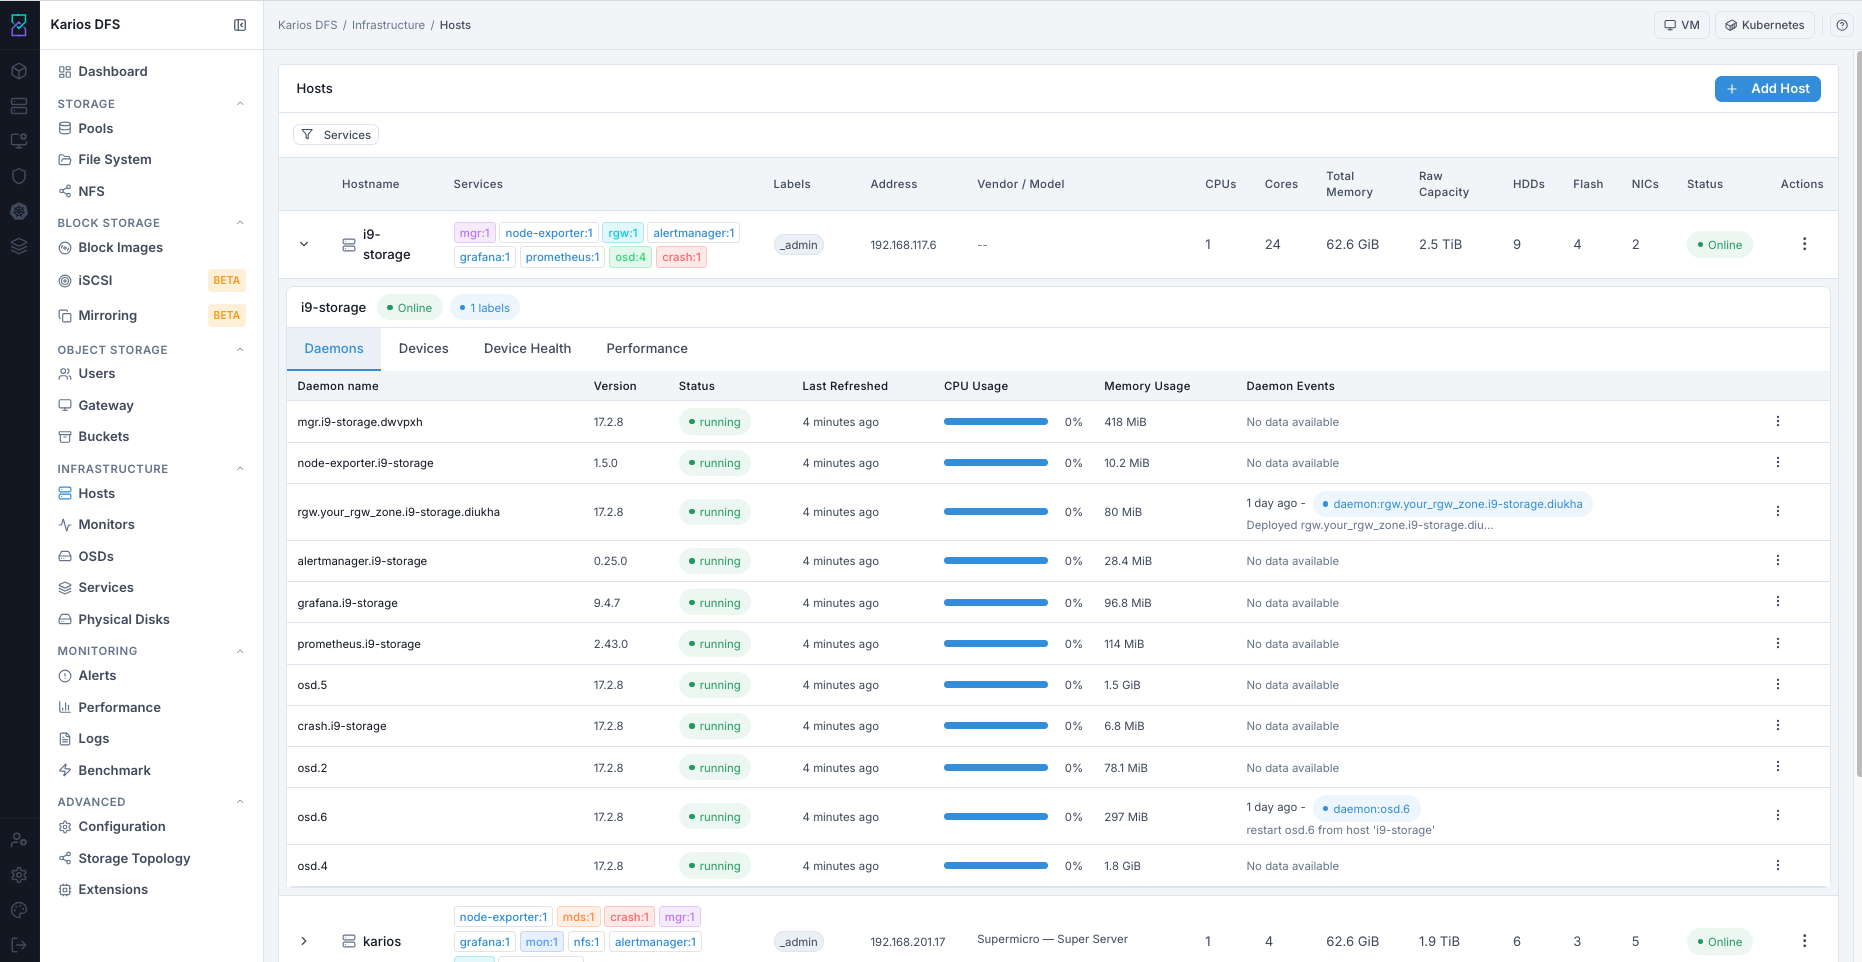
What This Screenshot Shows: Host Expanded Row - Daemons Tab (UI Reference; Values Depend On Your Environment).
Devices Tab
Shows all block devices visible on this host.
Column |
What It Shows |
|---|---|
Device path |
Kernel path such as |
Type |
Device media type |
Available |
|
Vendor / Model |
Drive vendor and model identifiers |
Size |
Raw disk capacity |
OSDs |
OSD ID if device is already in use |
Steps:
Open
Devicestab.Confirm media type detection is correct.
Check
Availablefor OSD-ready disks.
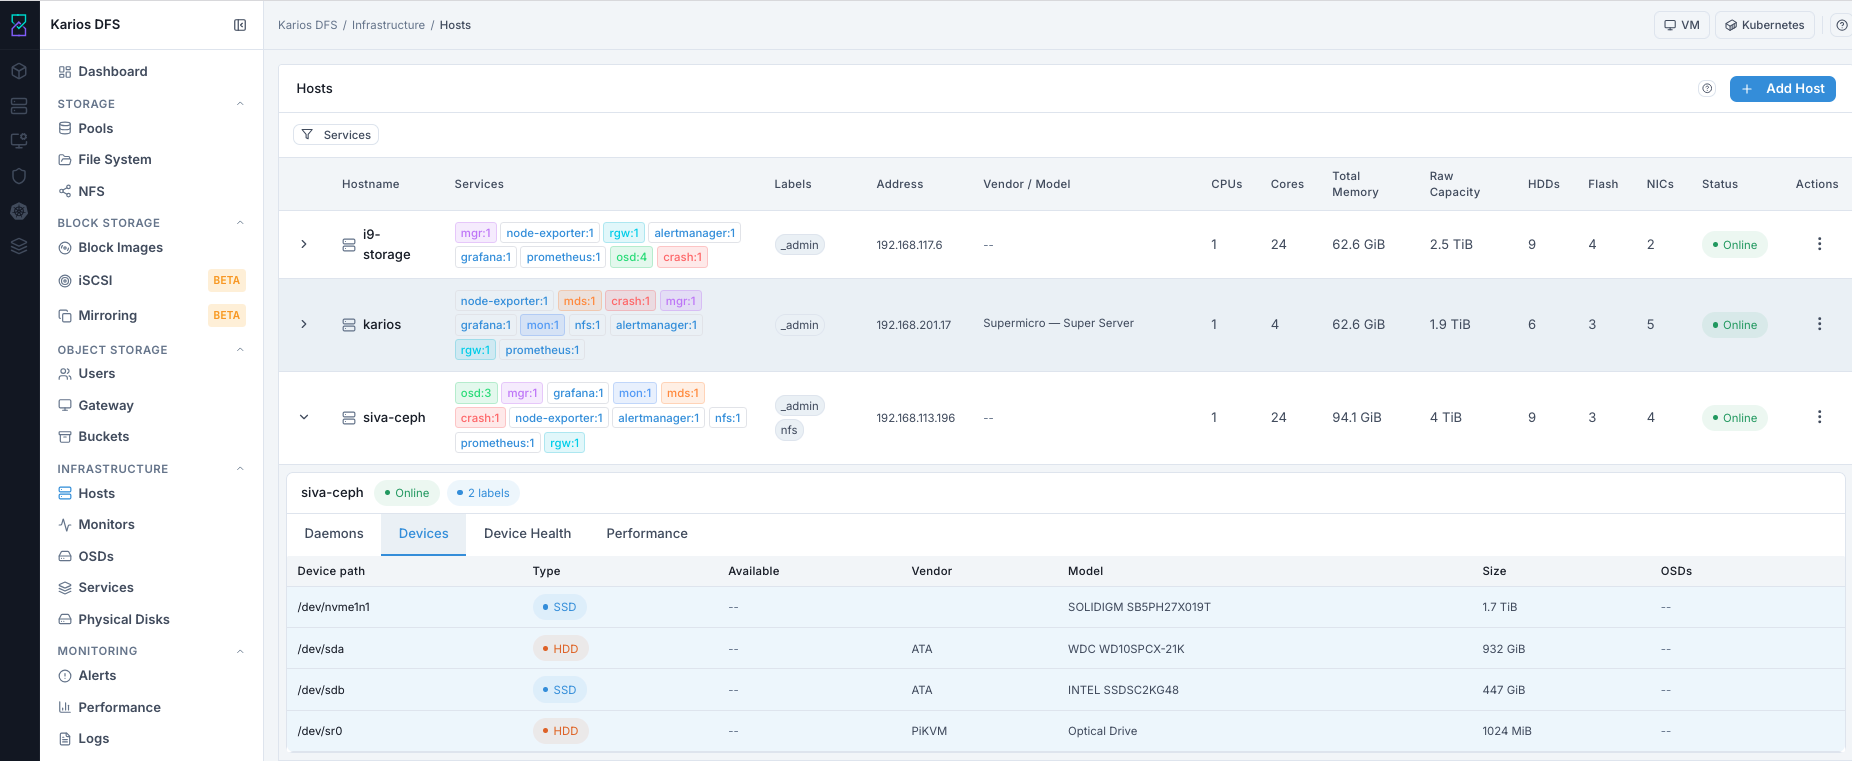
What This Screenshot Shows: Host Expanded Row - Devices Tab (UI Reference; Values Depend On Your Environment).
Device Health Tab
Shows SMART telemetry data for each disk on this host.
Steps:
Open
Device Healthtab.Select disk tab at top.
Check SMART overall-health result.
Review temperature and power-on hours.
Open
Device Informationfor full SMART summary fields.Open
SMARTfor raw SMART attribute data when deeper diagnostics are needed.
Key Values To Monitor:
Value |
What To Check |
|---|---|
SMART overall-health |
Must show |
Health |
|
Temp |
Temperature within drive operating range |
Power-on hrs |
Use with wear indicators for lifecycle planning |
Wear Level |
Check SSD/NVMe wear trend. Rapidly degrading wear indicates disk aging risk. |
Reallocated Sectors |
Any growth trend can indicate media degradation and early failure risk. |
Warning
Disks reporting SMART failure should be replaced before full failure.
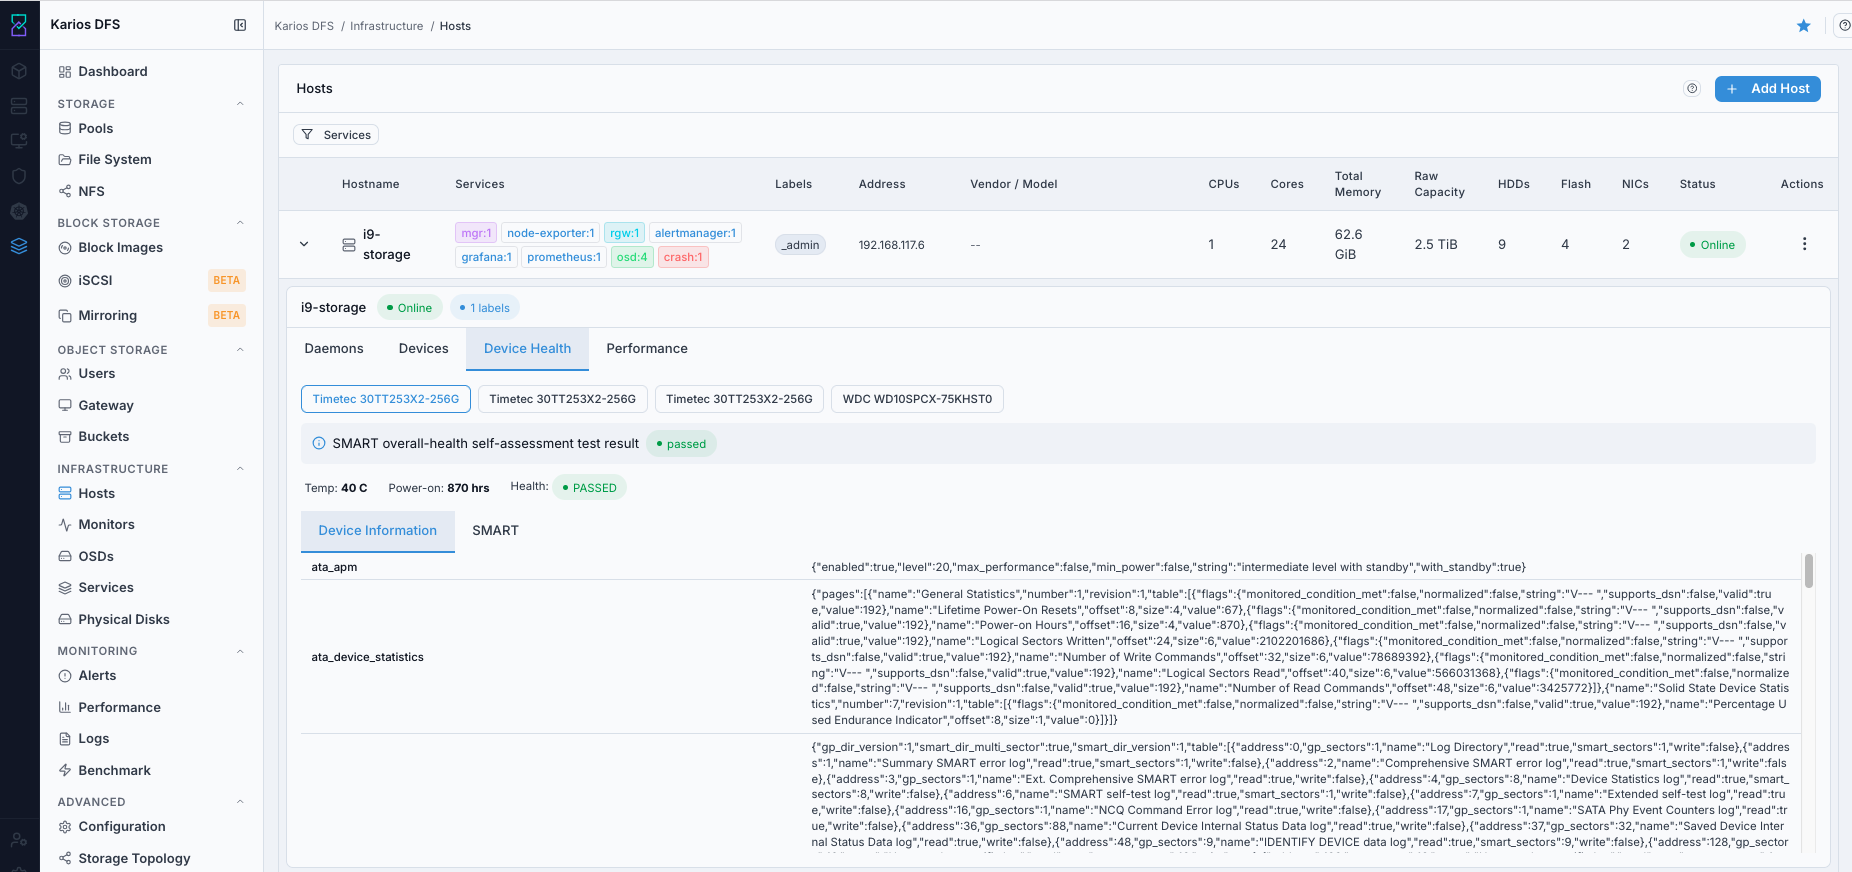
What This Screenshot Shows: Host Expanded Row - Device Health Tab (UI Reference; Values Depend On Your Environment).
Performance Tab
Shows per-host CPU, memory, and network utilization metrics sourced from
Prometheus node_exporter. In this UI, those metrics are displayed as
utilization panels/cards for quick host-level validation.
Card |
What It Shows |
|---|---|
CPU |
Processor model and socket/core count |
Memory |
Total installed RAM |
Services |
Total number of daemon services on this host |
Address |
Host IP address |
Storage |
Disk count and capacity breakdown |
NICs |
Number of network interfaces |
Ceph Version |
Ceph version reported for this host ( |
Source |
Registration source (for example orchestrator-managed host) |
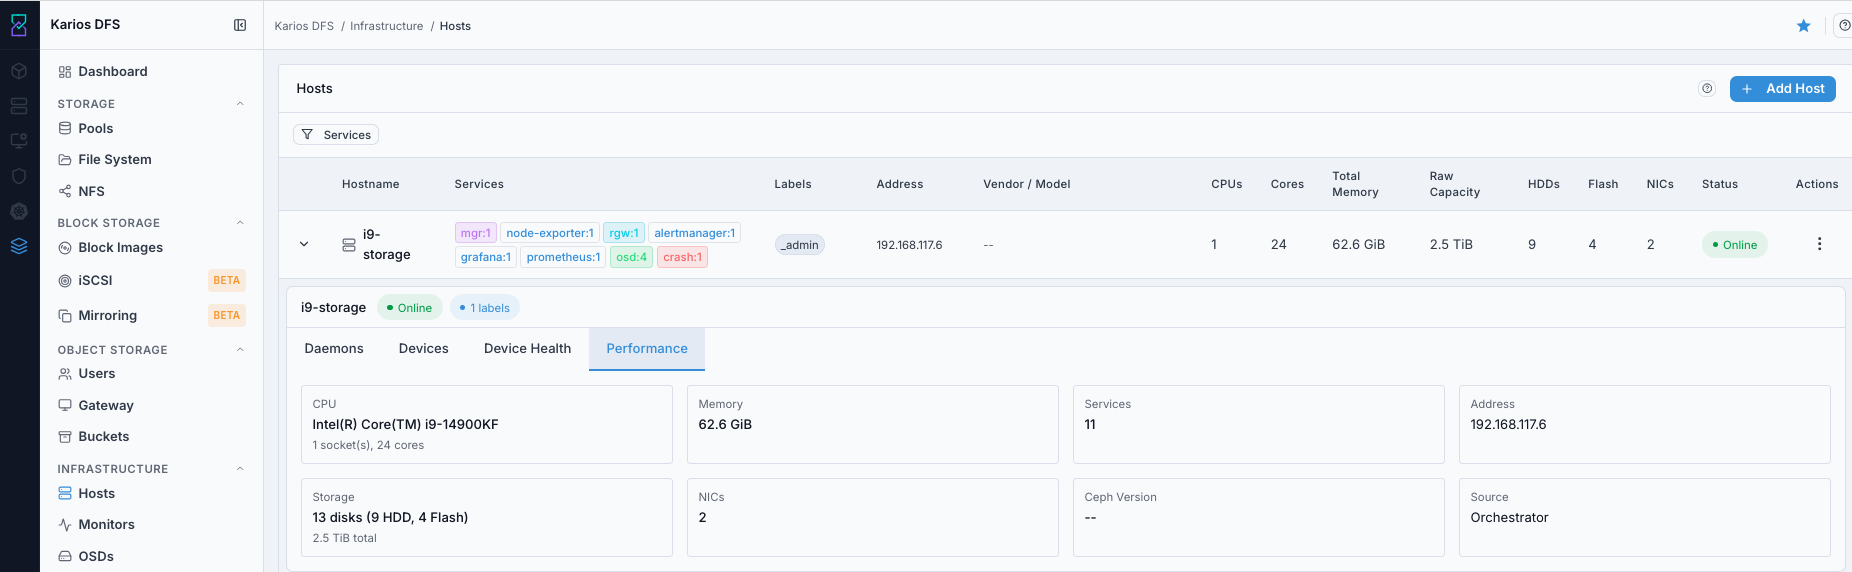
What This Screenshot Shows: Host Expanded Row - Performance Tab (UI Reference; Values Depend On Your Environment).
Troubleshooting - Hosts
Problem You See |
Most Likely Cause |
What To Do |
|---|---|---|
Host Status shows Offline |
Host unreachable |
Verify host power/network and check daemon health |
Host added but hardware fields show dashes |
Discovery still in progress |
Wait a few minutes and refresh |
Add Host fails |
cephadm SSH key not configured |
Configure cephadm SSH key on target host first |
Services filter shows fewer hosts than expected |
Some hosts do not run selected service |
Clear/change filter to verify all hosts |
Maintenance mode takes long time |
Large rebalance in progress |
Wait until PGs return to |
Remove Host fails |
One or more OSDs are still active on the host (not removed or not |
Move host to maintenance, verify OSDs are removed or |
Note
If any issue persists, raise a support ticket via Monitoring > Alerts or
Karios Support.