Full K-Trace Workflow
Use this guide to work K-Trace end to end: review the security operations center (SOC) dashboard, investigate detections, open and drive incident cases through their lifecycle, follow each case’s event trace and enrichment, manage threat intelligence, and keep an eye on sensor health. New users should start with The K-Trace Workflow for the end-to-end path, then use the numbered sections as a per-screen reference; experienced analysts can jump straight to the screen they need.
Every K-Trace page carries the same top banner while the deployment runs under an evaluation license, and access to each screen depends on your assigned SIEM (security information and event management) permissions.
Opening K-Trace
In the Karios web UI, select K-Trace in the left navigation rail, the vertical icon
sidebar that also lists Control Center, Hosts, K-Shield, and the other Karios modules.
The K-Trace side menu then opens with its own sections: Dashboard, Detections,
Cases, Sensor health, Threat intel, Analyzer jobs, Trace inspector,
and Dead-letter queue.
Throughout this guide, a step written as K-Trace -> Dashboard means: select
K-Trace in the navigation rail, then choose Dashboard from its side menu.
Note
On a new or evaluation deployment, most panels are empty until your sensors generate activity. Empty states (for example, No linked OCSF events or No enrichment results yet) are normal, not a malfunction.
The K-Trace Workflow
A typical investigation in K-Trace follows the path below. Work the steps in order, and use the per-screen reference sections that follow for the full detail of each one.
Start on the dashboard. Check the posture line, the open case load, and what is awaiting triage. See 1. Review the SOC Dashboard.
Find what to work. Work the highest-priority case from the queue (4. Review the Case Queue); cases are opened automatically from case-worthy detections, so the queue is your primary path. To investigate the underlying sensor events or open a case manually, use the detections explorer (3. Investigate a Detection).
Get the case. Most cases already exist: case-worthy detections open an incident case automatically, so you usually just pick one up from the queue. Create a case from a detection, or raise one manually, only when needed. See 5. Open a SOC Case.
Investigate the case. Read the Overview, follow the OCSF Trace (the normalized event timeline) to see what happened, and review Enrichment and Evidence for context. If enrichment is slow or missing, use the Trace inspector to see how the case was processed. Record what you find in Comments.
Drive the lifecycle. Move the case forward through the lifecycle stages (New, Triage, In progress, Containment, Eradication, Recovery) with the transition control, and watch the SLA so you respond in time. The terminal
ClosedandFalse positiveoutcomes are covered in step 6. See 6. Work a Case: Overview and Transitions.Resolve and close. Close a fully resolved incident, or mark a non-incident as
False positive. See 6. Work a Case: Overview and Transitions.Keep operations healthy (ongoing). Confirm Sensor health; search, import, and review threat intelligence (14. Review the Threat-Intel History); run an enrichment job for ad-hoc lookups of a single observable; and clear the Dead-letter queue.
The numbered sections below describe each screen in detail.
1. Review the SOC Dashboard
When to Use:
Use the dashboard as your starting point each shift to see what needs attention.
Purpose:
Get a single-screen read on open case load, severity mix, case stages, sensor health, and the most recent detections.
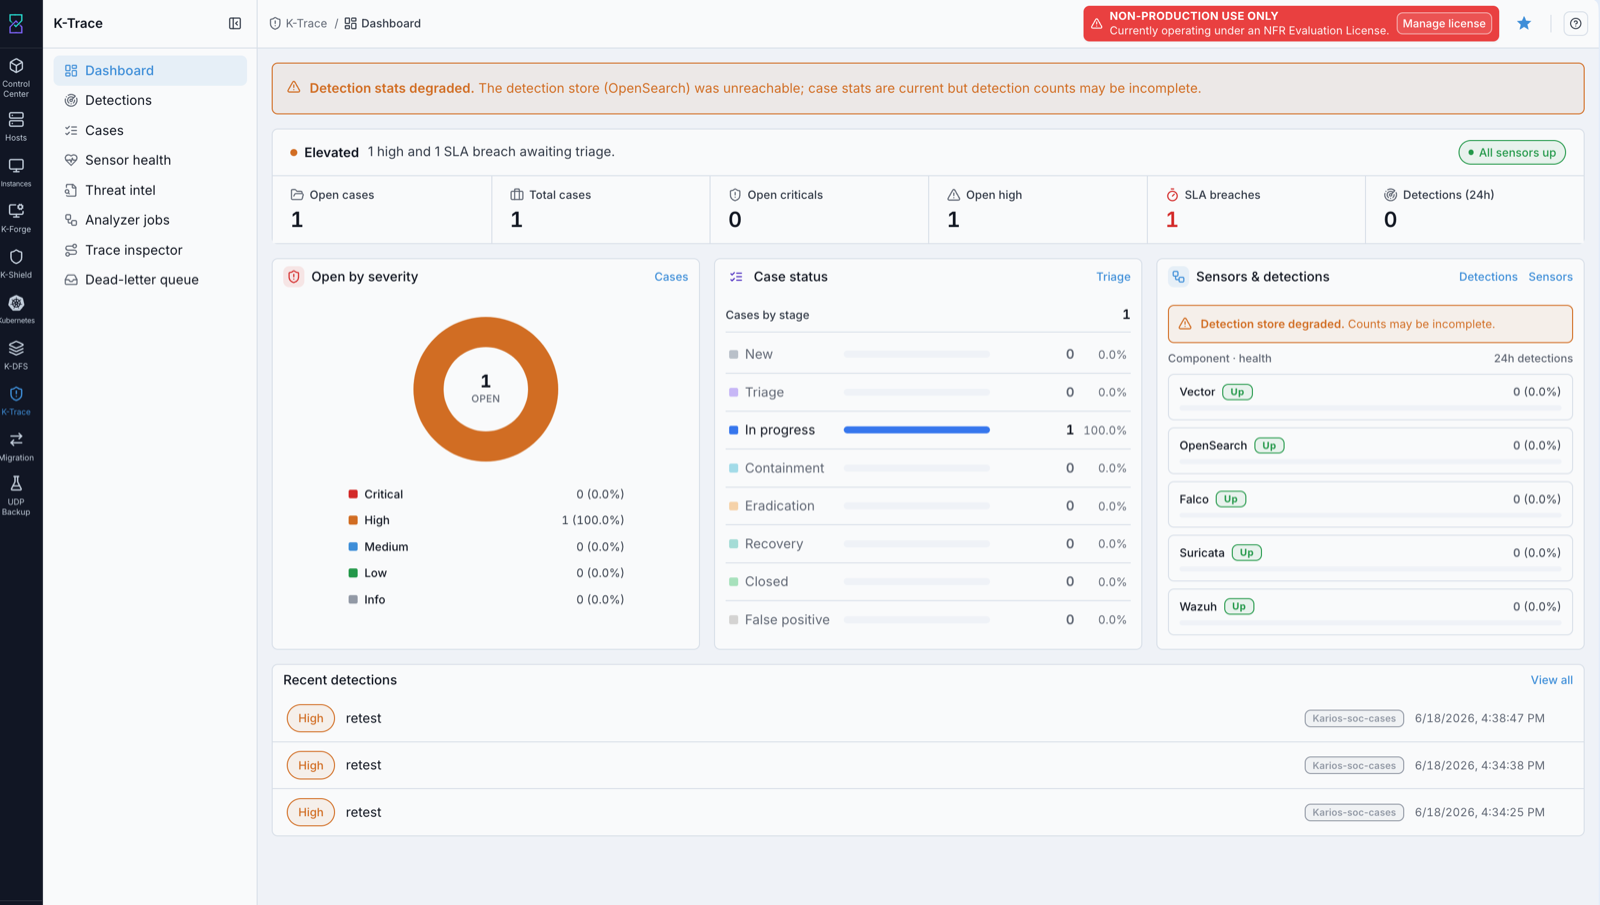
The K-Trace dashboard summarizes case load, severity, stage, sensor health, and recent detections.
Steps:
Open
K-Trace -> Dashboard.Read the posture status line near the top (for example,
Elevated), which summarizes what is awaiting triage.Read the summary cards across the top:
Open cases,Total cases,Open criticals,Open high,SLA breaches, andDetections (24h).Use the sensor-status shortcut at the top right (for example,
All sensors up) to open Sensor health.Review the
Open by severityring (Critical, High, Medium, Low, Info) to see where risk is concentrated.Review
Case statusto see how cases are distributed across the lifecycle stages (New, Triage, In progress, Containment, Eradication, Recovery, Closed, False positive).Check
Sensors & detectionsfor component health and the 24-hour detection counts.Scan
Recent detectionsand useView allto jump to the detections explorer.Use a panel’s header link to jump to its full screen (for example,
Caseson theOpen by severitypanel, orDetections/SensorsonSensors & detections).
Expected Outcome:
You can tell at a glance how many cases are open, how severe they are, and how many are breaching SLA.
You know whether the sensor pipeline is healthy.
Note
A Detection stats degraded banner can appear when the detection store is briefly unreachable. It affects only the detection counts; case data is stored separately, so case stats stay accurate. The banner clears on its own, so it is not a sign that the system is broken.
If this fails:
If you see a
Detection stats degradedbanner, the detection store was unreachable, so case stats are current but detection counts may be incomplete. Refresh shortly.If the page does not load, reload it, then confirm your access with your administrator.
2. Use the Dashboard Help
When to Use:
Use this when you want a quick explanation of any dashboard panel without leaving the page.
Purpose:
Open the in-page help to understand what each dashboard section means.
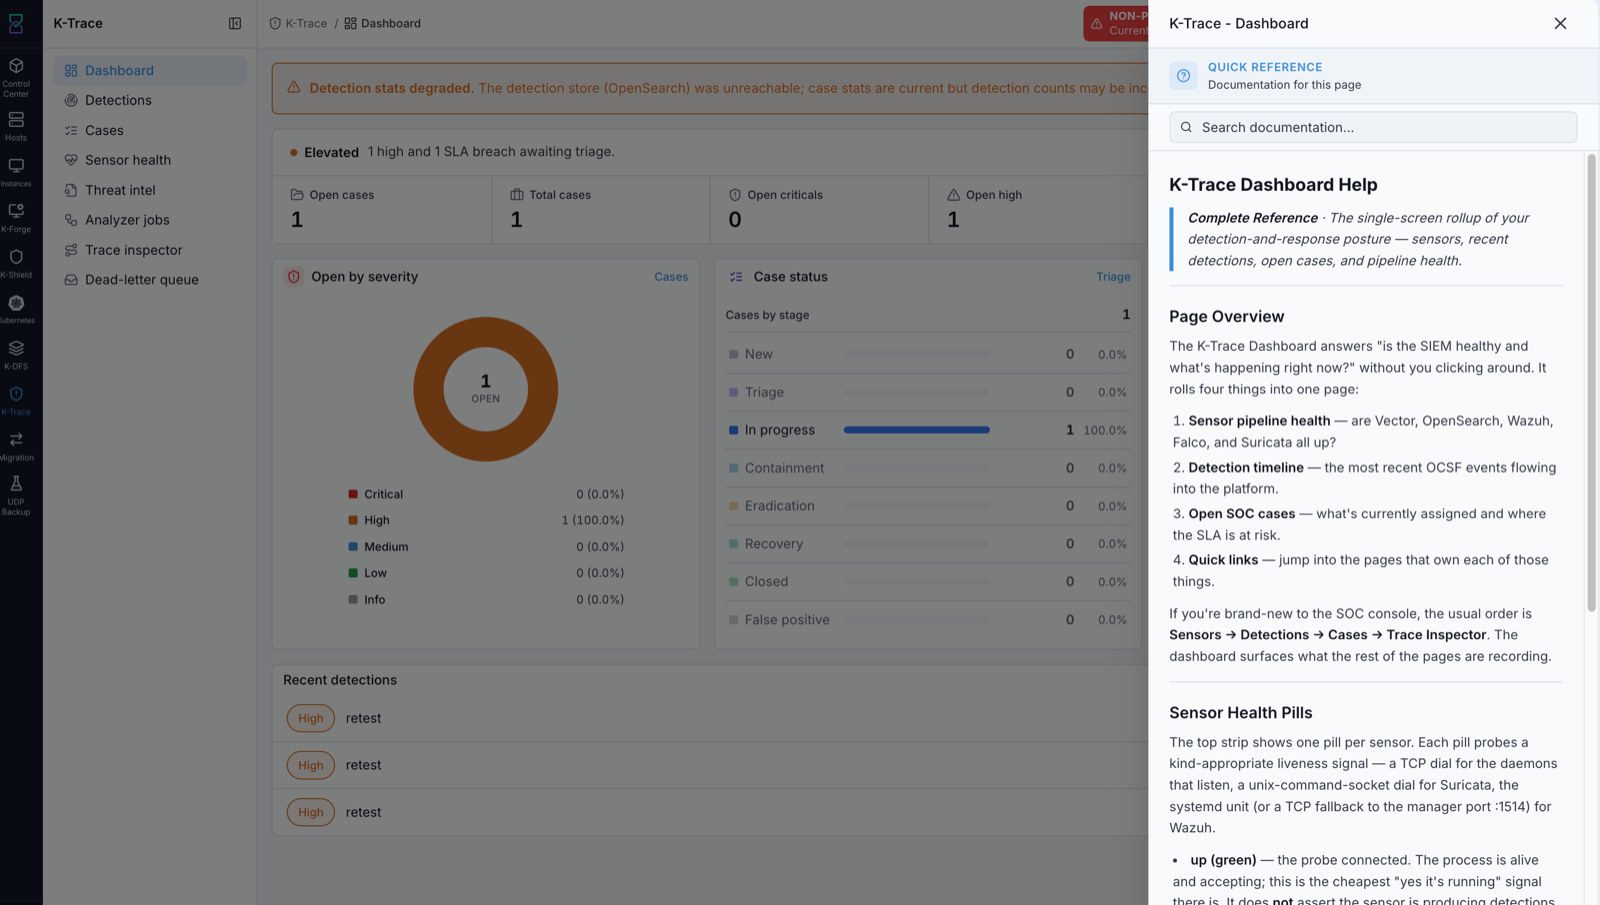
The Dashboard Help panel explains each panel and links to the full reference.
Steps:
On the dashboard, open the help (the
?control at the top right).Read the
Page Overviewto see what each panel answers (sensor pipeline health, recent detections, open SOC stats, and quick links).Use the
Search documentationbox to find a topic.
Expected Outcome:
You understand what each dashboard panel shows and where its links lead.
If this fails:
Close and reopen the help panel.
If the help does not open, reload the page.
3. Investigate a Detection
When to Use:
Use this to search and filter the raw detections coming from your sensors.
Purpose:
Find the detections that matter and review their details before deciding whether to open a case.
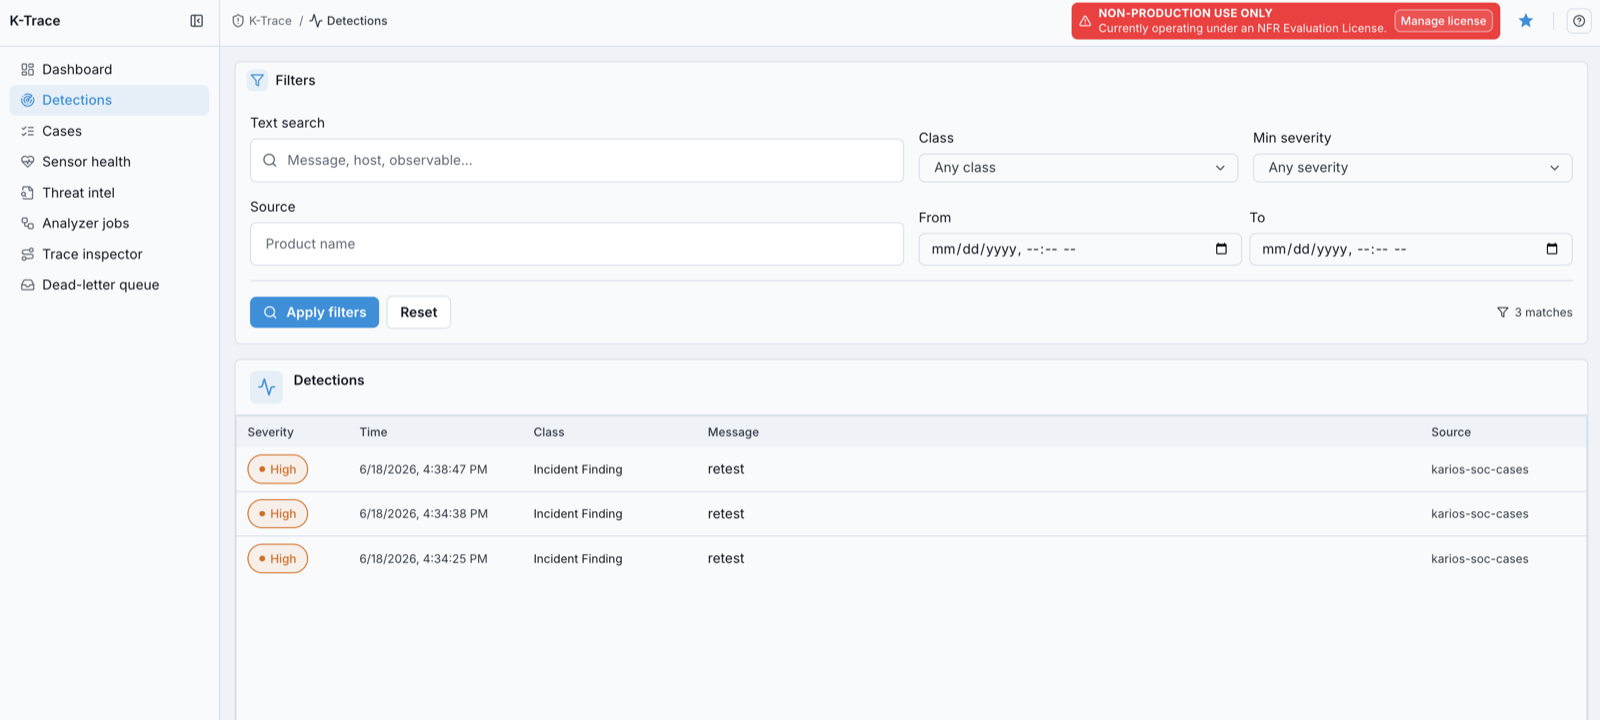
The detections explorer filters events by text, class, severity, source, and time.
Steps:
Open
K-Trace -> Detections.Use
Filtersto narrow the list:Text search(message, host, or observable; an observable is an artifact such as an IP address, domain, file hash, or URL),Class,Min severity,Source(the producing product, shown asProduct name; the value may be a Karios producer name, for examplekarios-soc-cases), and aFrom/Totime range.Classis the OCSF event class; the available classes come from your sensors (for example,Incident Finding).Click
Apply filters. The match count updates; useResetto clear.Review the results table columns:
Severity,Time,Class,Message, andSource.Click a detection to open its full details, including its observables.
From the detection’s detail view, create a case if it warrants one; the new case is prefilled from the detection and linked to its OCSF Trace.
Expected Outcome:
You can locate specific detections, read their severity, class, and source, and open the full event detail.
Note
Case-worthy detections automatically open an incident case, which you then work from the Cases queue. You can also create a case from a detection here (the new case is prefilled and the detection is linked to its OCSF Trace), or raise a standalone case manually (see 5. Open a SOC Case).
If this fails:
Widen the time range or clear filters with
Resetif no rows appear.If detections never appear, confirm sensor health (see 12. Check Sensor Health).
4. Review the Case Queue
When to Use:
Use this to see all incident cases and pick the next one to work.
Purpose:
Review open and recent cases with their severity, status, SLA, and owner.
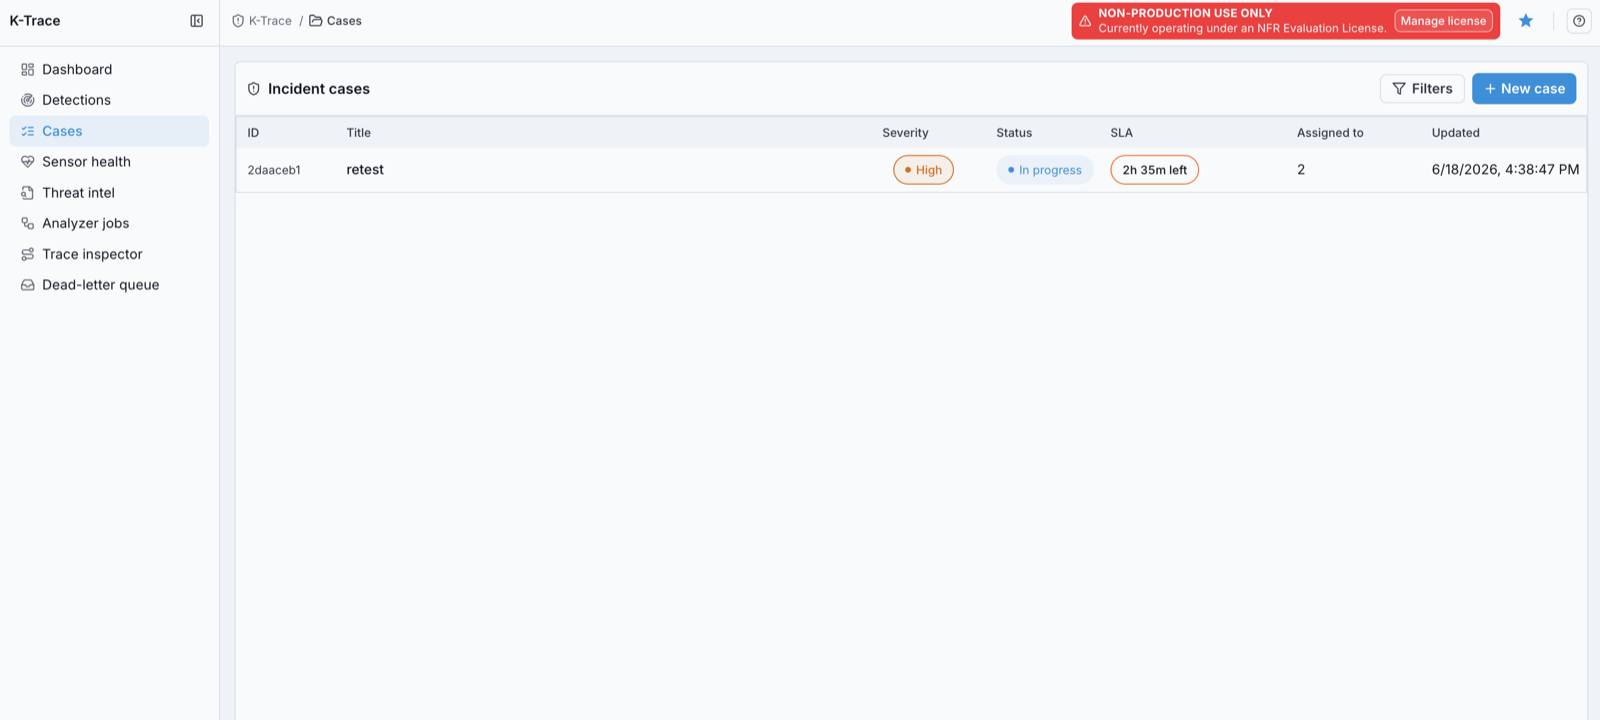
The incident cases queue lists each case with its severity, status, SLA, and assignee.
Steps:
Open
K-Trace -> Cases. Cases are also called SOC cases in some dialogs (for example,Open SOC case).Review the table columns:
ID,Title,Severity,Status,SLA,Assigned to, andUpdated.Assigned toshows a platform user identifier (resolve it in User Management).Use
Filtersto narrow by status, severity, and other attributes.Click a row to open the case detail.
Expected Outcome:
You can see every case at a glance and which ones are closest to breaching SLA.
If this fails:
Clear filters if the list looks empty.
If you cannot see cases, confirm you have the case-view permission.
5. Open a SOC Case
When to Use:
Use this to raise a case manually (for example, from your own investigation rather than an automatic detection).
Purpose:
Create a new incident case with a title and severity.
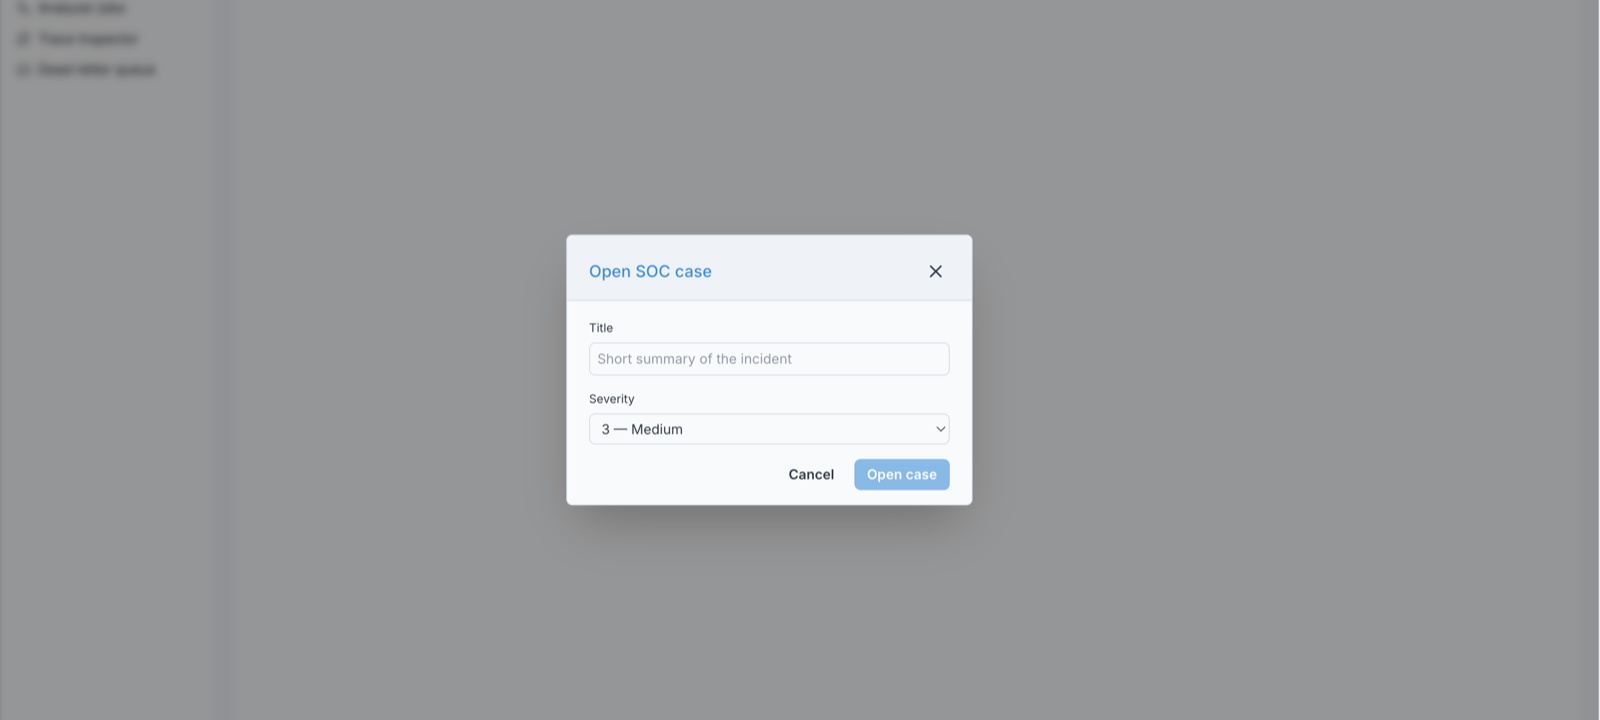
The Open SOC case dialog creates a case with a title and severity.
Steps:
On the
Casespage, click+ New case.In the
Open SOC casedialog, enter aTitle(a short summary of the incident).Choose a
Severity. The dialog lists each severity by its level number (for example, level 3 is Medium) and defaults to Medium.Click
Open case.
Expected Outcome:
The new case appears in the queue and opens for triage.
The create dialog has no assignee field, so ownership follows your team’s process.
If this fails:
Make sure the title is filled in before submitting.
If creation is blocked, confirm you have the case-create permission.
6. Work a Case: Overview and Transitions
When to Use:
Use this to read a case’s details and move it through the incident lifecycle.
Purpose:
Review case metadata and apply a state transition with a justification.
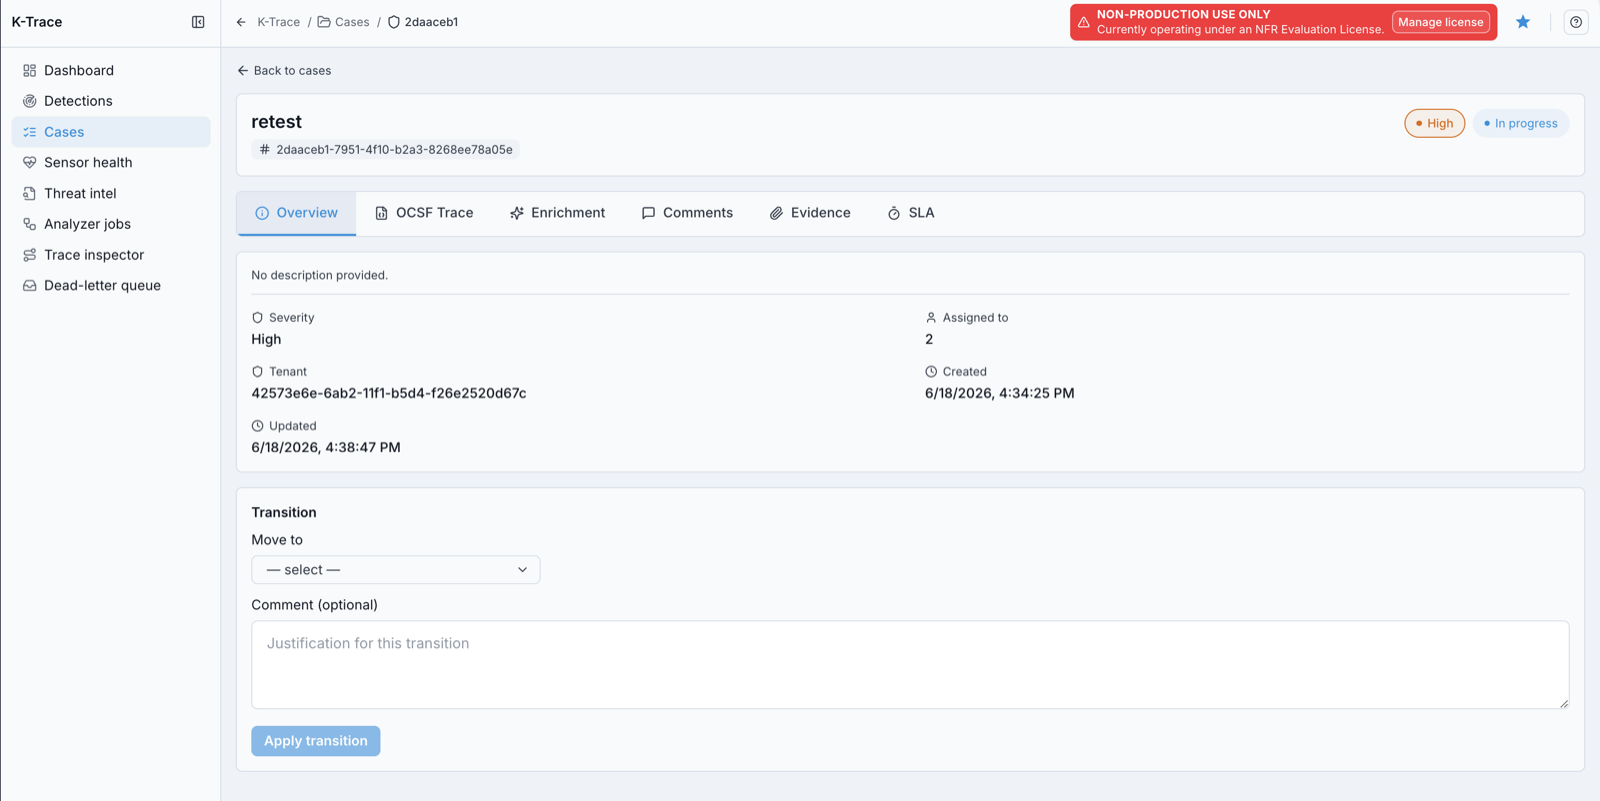
The case Overview tab shows the case metadata and the transition control.
Steps:
Open a case by clicking its row in the queue (see 4. Review the Case Queue). The header shows the title, case ID, severity, and current status, with tabs for
Overview,OCSF Trace,Enrichment,Comments,Evidence, andSLA.On
Overview, review the case fields: description,Severity,Assigned to,Tenant,Created, andUpdated. TheAssigned tofield shows the case’s current owner (shown by user identifier); assignment follows your team’s process.In the
Transitionpanel, choose the next stage inMove to(New, Triage, In progress, Containment, Eradication, Recovery, Closed, or False positive).Add a
Comment (optional)to justify the transition (recommended).Click
Apply transition. This control stays disabled until a stage is chosen inMove to.
Note
The Assigned to value is a platform user identifier; resolve it to a person in User Management. K-Trace has no self-assign control, so case ownership is managed by your team’s process.
A typical progression is New -> Triage -> In progress -> Containment -> Eradication ->
Recovery -> Closed, with False positive and Closed as terminal outcomes. These
stages follow the standard incident-response lifecycle (NIST SP 800-61). Treat this as
guidance, not an enforced rule.
The case lifecycle stages are:
New: created, not yet being worked.Triage: confirm the case is real and set its priority.In progress: active investigation is underway.Containment: limit the incident’s spread or impact.Eradication: remove the root cause from affected systems.Recovery: restore affected systems to normal operation.Closed: resolved and complete.False positive: not a real incident.
Use False positive to close a case that was not a real incident; use Closed for a genuine incident you have fully resolved.
Closed and False positive cases remain available from the Cases queue using the Status filter.
Expected Outcome:
The case status updates and the change is recorded with your justification.
If this fails:
Pick a valid next stage if
Apply transitionis disabled.If the transition is rejected, confirm you have the triage or close permission for that move.
7. Review the OCSF Trace
When to Use:
Use this to see the security events linked to a case, in order.
Purpose:
Review the case’s linked OCSF detections as a timeline of what happened.
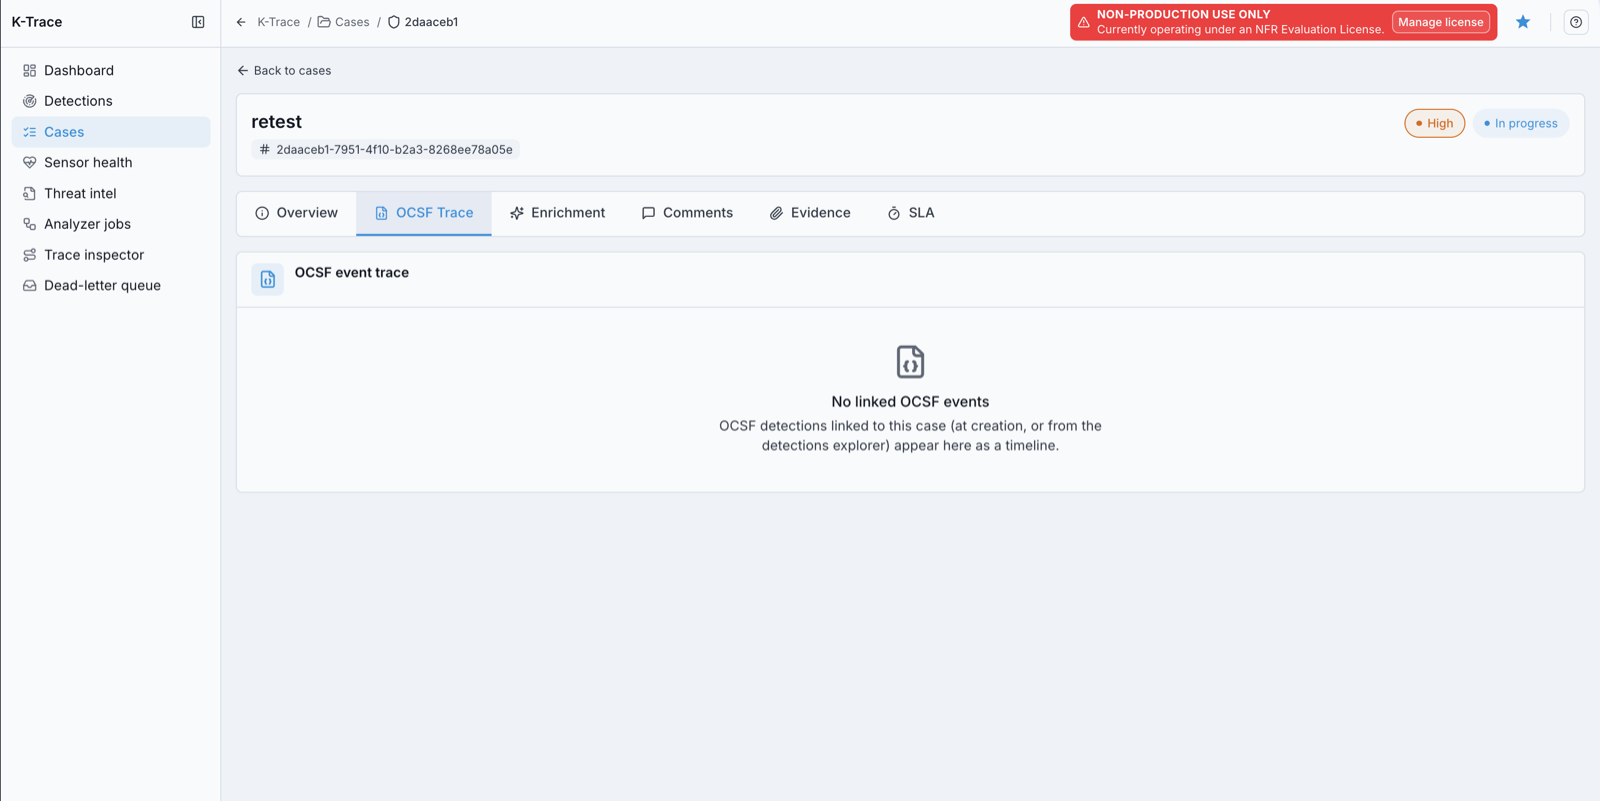
The OCSF Trace tab shows the case’s linked OCSF detections as a timeline.
Note
OCSF (Open Cybersecurity Schema Framework) is the common event format that detections are normalized into.
Steps:
Open the case and select the
OCSF Tracetab.Review the linked OCSF detections in time order to reconstruct the sequence.
Detections are linked to a case at case creation, or from the detections explorer; they then appear here in time order.
Expected Outcome:
You can follow the case’s linked OCSF detections as a timeline.
If this fails:
If you see
No linked OCSF events, no detections are linked to this case yet. Detections linked at case creation, or from the detections explorer, appear here.
8. Review Case Enrichment
When to Use:
Use this to see the context K-Trace gathered for the case’s observables.
Purpose:
Review enrichment results, which the tab labels geoip, whois, ti-match, and vt.
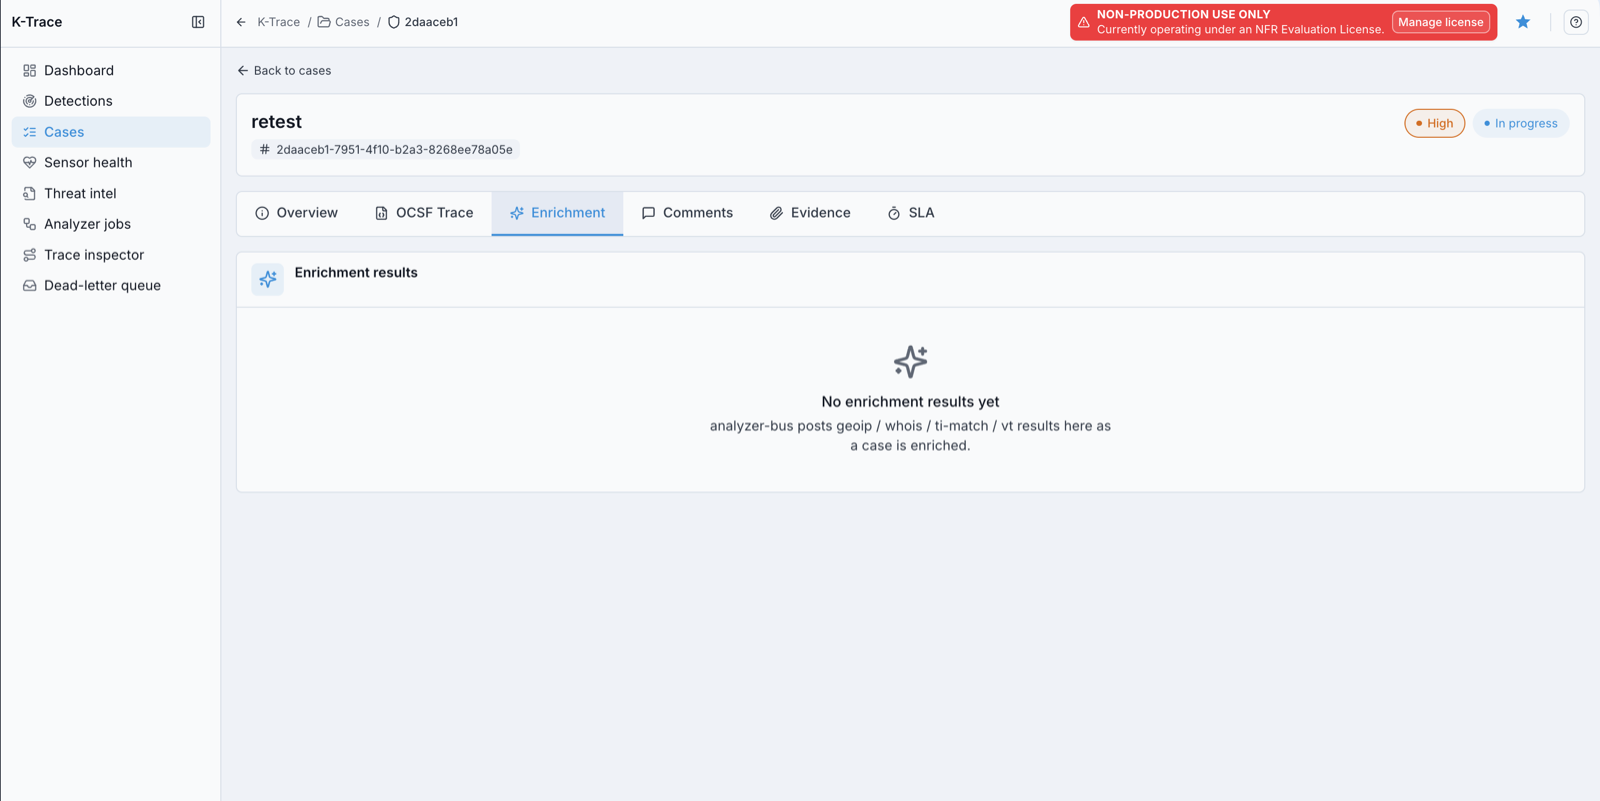
The Enrichment tab shows results for the case’s observables as the case is enriched.
Steps:
Open the case and select the
Enrichmenttab.Review the results for each observable. The tab labels them
geoip(geolocation),whois,ti-match(threat-intel match), andvt(VirusTotal reputation lookup).
The enrichers shown here (geoip, whois, ti-match, vt) are the same analyzers shown on 15. Run an Enrichment Job, where they are labeled threat-intel-match and vt-public.
Expected Outcome:
You can see external context for the case’s observables without leaving the case.
If this fails:
If you see
No enrichment results yet, enrichment is still running. Enrichment runs automatically as the case is processed, so check back shortly. (To look up an individual observable on demand, use 15. Run an Enrichment Job; that screen does not re-trigger this case’s enrichment.)If enrichment is slow or stuck, use the Trace inspector to see where the case’s processing stalled.
9. Collaborate Using Comments
When to Use:
Use this to record analyst notes and coordinate with your team on a case.
Purpose:
Read and add comments on a case.
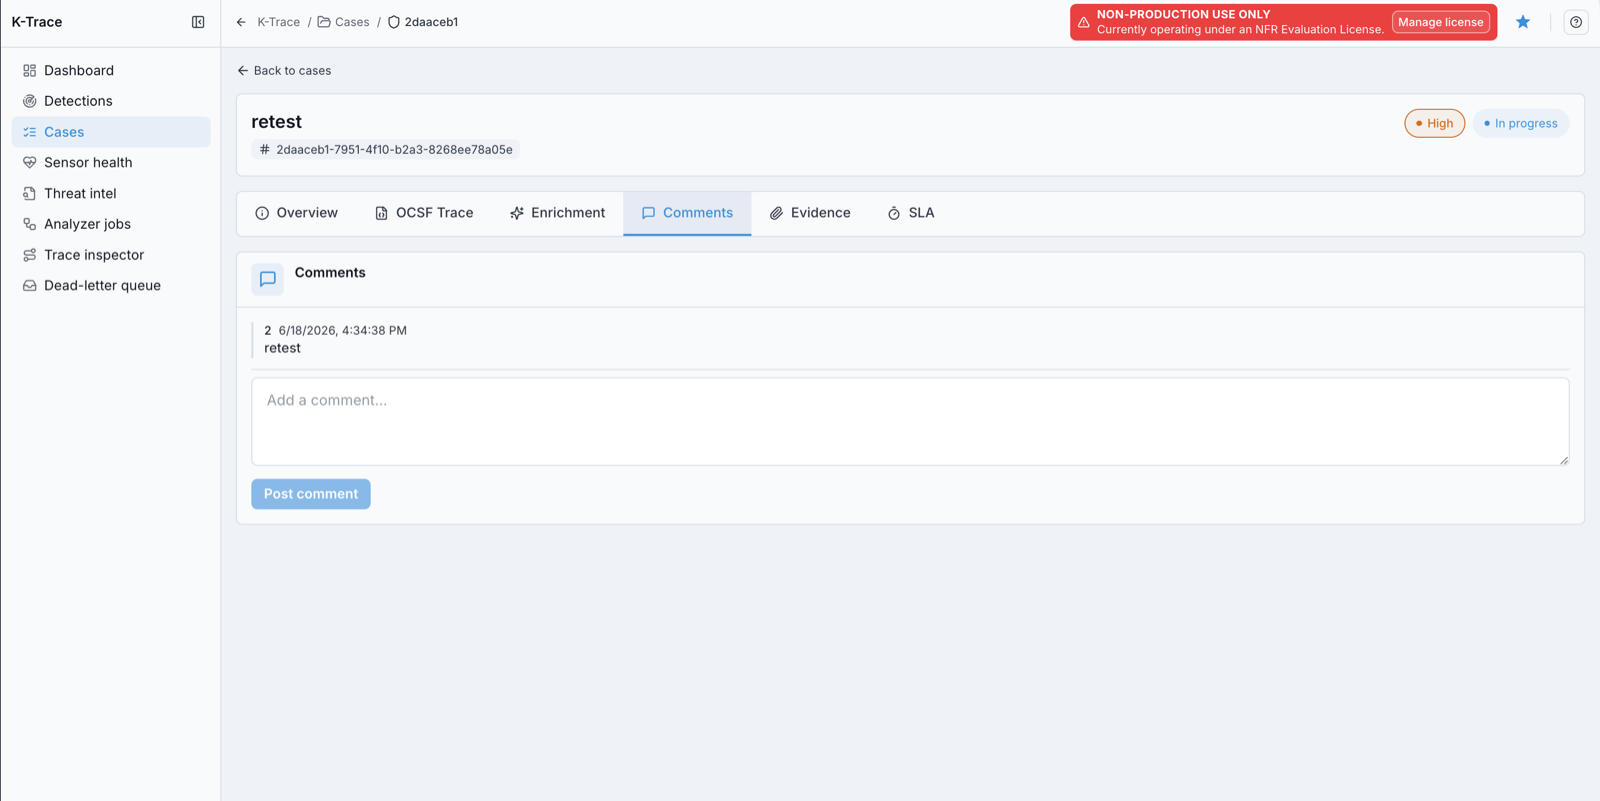
The Comments tab is the case’s analyst notes thread.
Steps:
Open the case and select the
Commentstab.Read existing comments (each shows the author (shown by user identifier) and timestamp).
Type your note in
Add a commentand clickPost comment.
Expected Outcome:
Your note is added to the thread and visible to the rest of the team.
If this fails:
If
Post commentis disabled, make sure the comment is not empty.
10. Review Case Evidence
When to Use:
Use this to see the artifacts attached to a case.
Purpose:
Review evidence artifacts linked to the case.
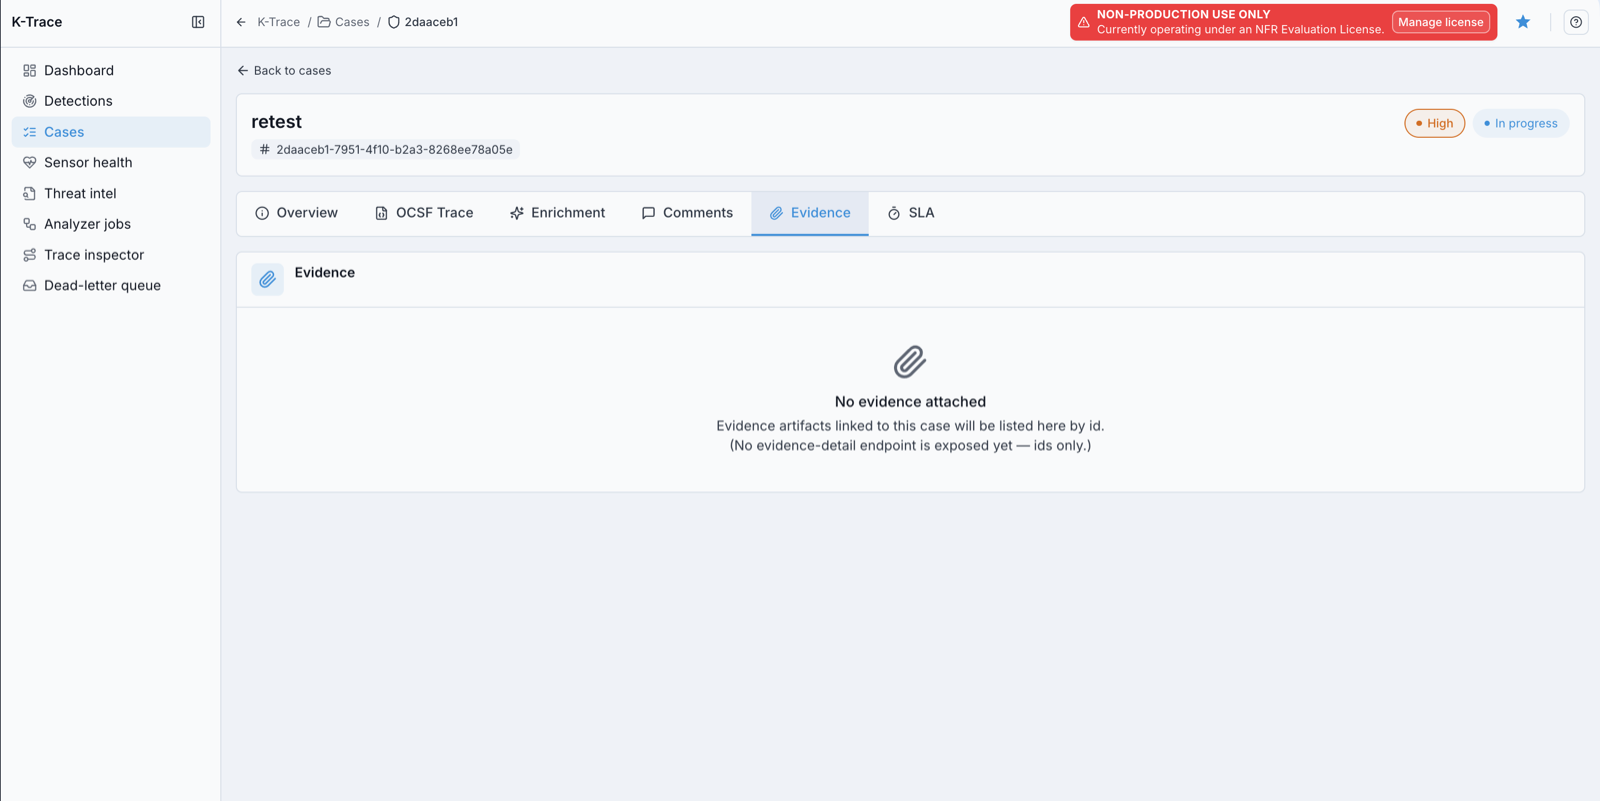
The Evidence tab lists artifacts linked to the case by identifier.
Steps:
Open the case and select the
Evidencetab.Review the evidence artifacts linked to the case, listed by identifier.
Evidence is listed by identifier only; there is no per-artifact detail view yet.
Expected Outcome:
You can see which evidence artifacts are associated with the case.
If this fails:
If you see
No evidence attached, nothing has been linked to the case yet.
11. Track the Case SLA
When to Use:
Use this to see how long you have to respond before a case breaches its target.
Purpose:
Review the response-time target, the remaining time, and the deadline for the case.
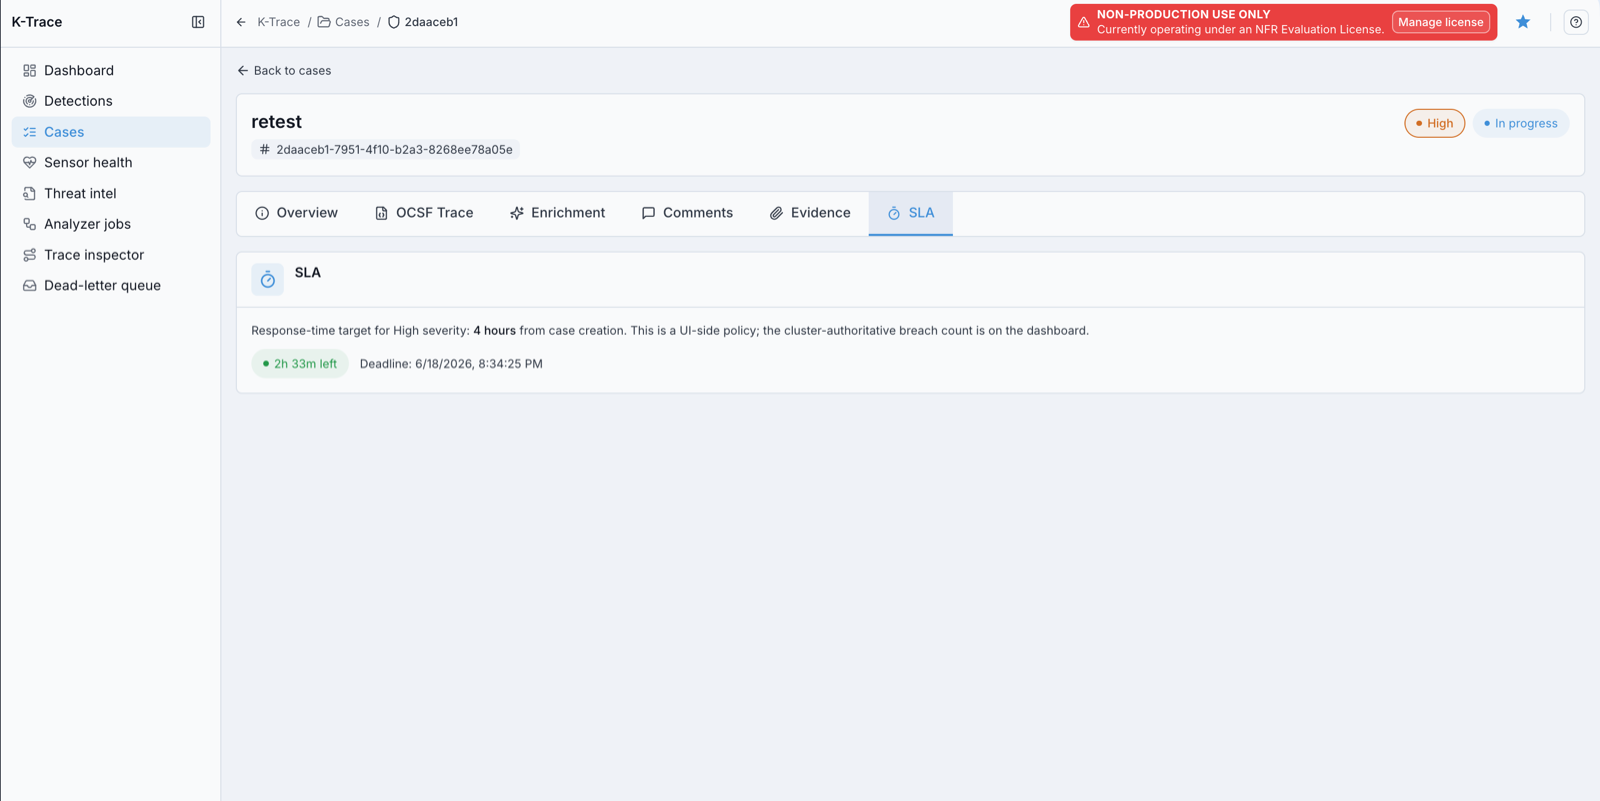
The SLA tab shows the response-time target, remaining time, and deadline.
Steps:
Open the case and select the
SLAtab.Read the response-time target for the case’s severity (for example,
4 hoursfrom creation for High).Check the remaining time (for example,
2h 33m left) and theDeadline.
Response-time targets by severity are Critical 1 hour, High 4 hours, Medium
24 hours, Low 72 hours, and Info 7 days.
Expected Outcome:
You know how much time remains before the case breaches its response-time target.
Note
The countdown on this tab is a convenience view. The authoritative SLA breach count for the deployment is shown on the dashboard.
If this fails:
If the timer looks wrong, reload the case.
Cross-check the dashboard
SLA breachescard for the authoritative count.
12. Check Sensor Health
When to Use:
Use this to confirm the security pipeline is collecting data before you trust the dashboards.
Purpose:
Review the health of each pipeline component.
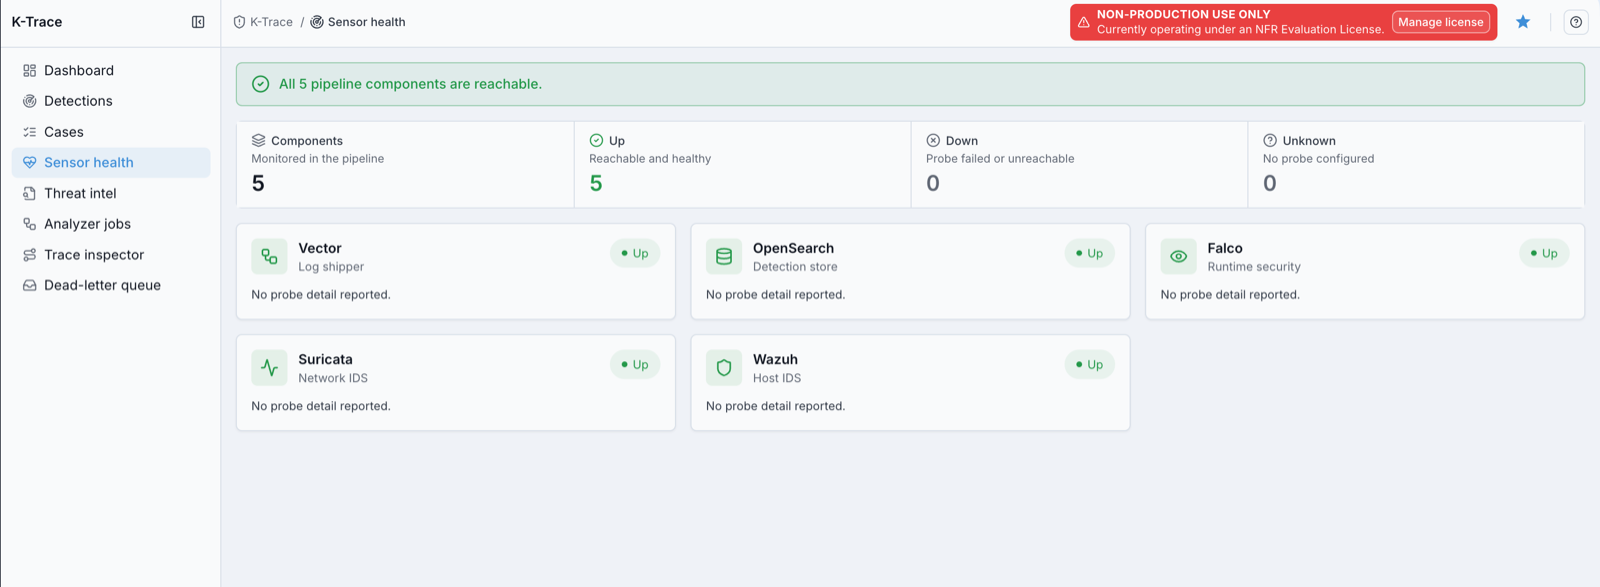
The Sensor health screen shows each pipeline component and its status.
Steps:
Open
K-Trace -> Sensor health.Read the summary banner and the counts:
Components,Up,Down, andUnknown.Review each component card and its status: the log shipper (
Vector), detection store (OpenSearch), runtime security (Falco), network IDS (Suricata), and host IDS (Wazuh). IDS stands for intrusion detection system.
Expected Outcome:
You can confirm every component is
Up, or identify which one isDownorUnknown.
If this fails:
A
Downcomponent means data from that source may be missing; escalate to your administrator.Unknownmeans no health probe is configured for that component.
13. Search and Import Threat Intelligence
When to Use:
Use this to look up indicators of compromise or to load your own threat-intel data.
Purpose:
Search the indicator store and bulk-import indicators.
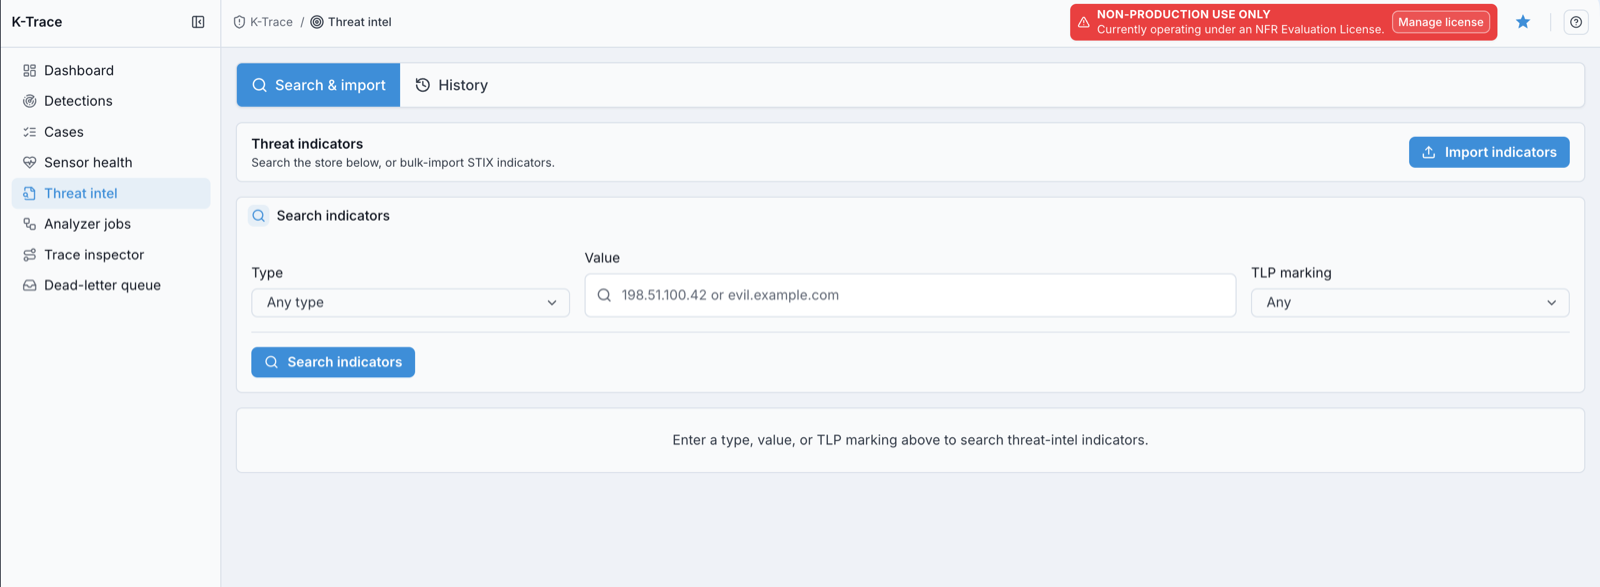
The Threat intel Search & import tab searches the indicator store and imports indicators.
Steps:
Open
K-Trace -> Threat inteland selectSearch & import.Under
Search indicators, set theType, enter aValue(for example, an IP address or domain), and choose aTLP marking(Traffic Light Protocol, the sharing-sensitivity label, such as RED, AMBER, GREEN, or WHITE).Click
Search indicatorsto query the store.To load your own data, click
Import indicatorsand provide your indicators in STIX (Structured Threat Information Expression) format in the dialog that opens.
Expected Outcome:
You can find whether an indicator is known and add new indicators to the store.
Imported indicators become searchable in this tab and appear in
Historyat their TLP level.
If this fails:
Broaden the search (for example, set
TypeandTLP markingtoAny).Results are limited to your TLP clearance; confirm your clearance with your administrator if you expect more.
14. Review the Threat-Intel History
When to Use:
Use this to see the most recent indicators available to you.
Purpose:
Review the recent indicator feed at or below your clearance.
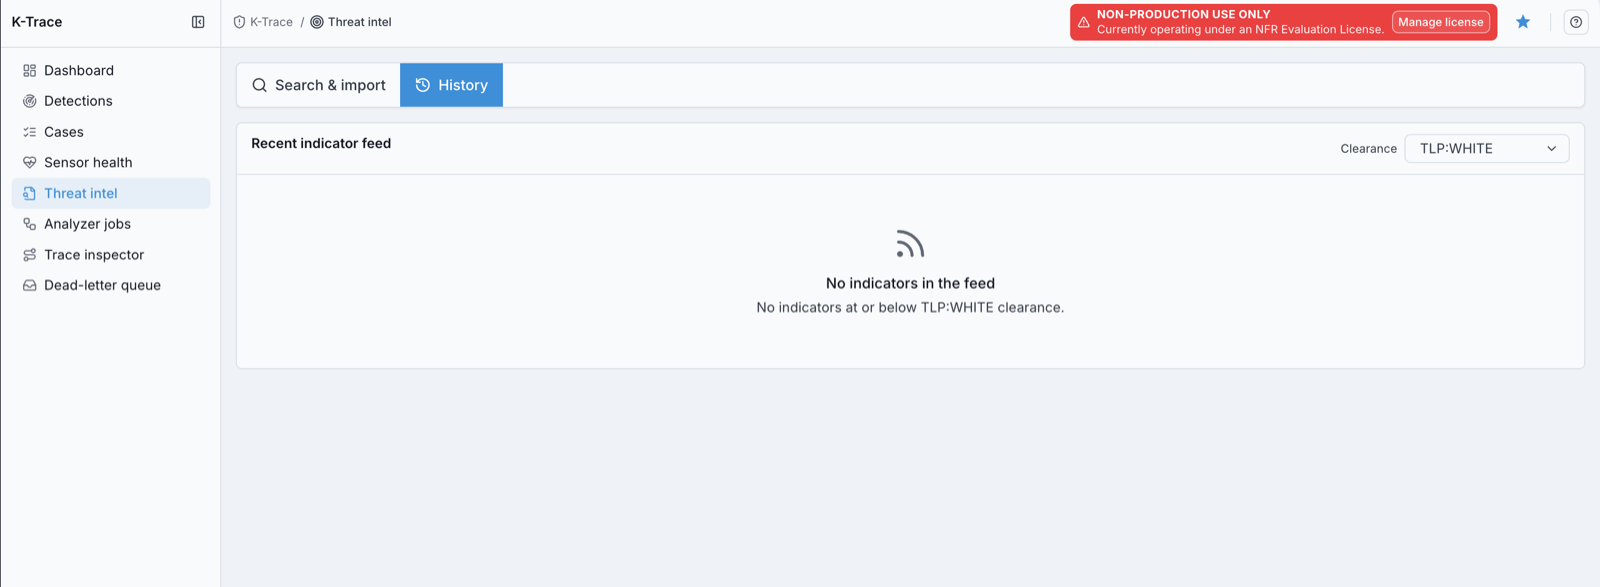
The Threat intel History tab shows the recent indicator feed for your clearance.
Steps:
Open
K-Trace -> Threat inteland selectHistory.Set the
Clearance(TLP level, defaultTLP:WHITE) to control which indicators are shown.Review the recent indicator feed.
Note
The TLP marking in section 13 and the Clearance here both refer to TLP. The highest TLP level you can see is set by your role; confirm your clearance with your administrator.
Expected Outcome:
You can see recent indicators available at your clearance level.
If this fails:
If you see
No indicators in the feed, none are available at the selected clearance. Raise the clearance if your role allows it.
15. Run an Enrichment Job
When to Use:
Use this to enrich a single observable on demand and review past enrichment jobs.
Purpose:
Submit an observable for enrichment and review the resulting jobs.
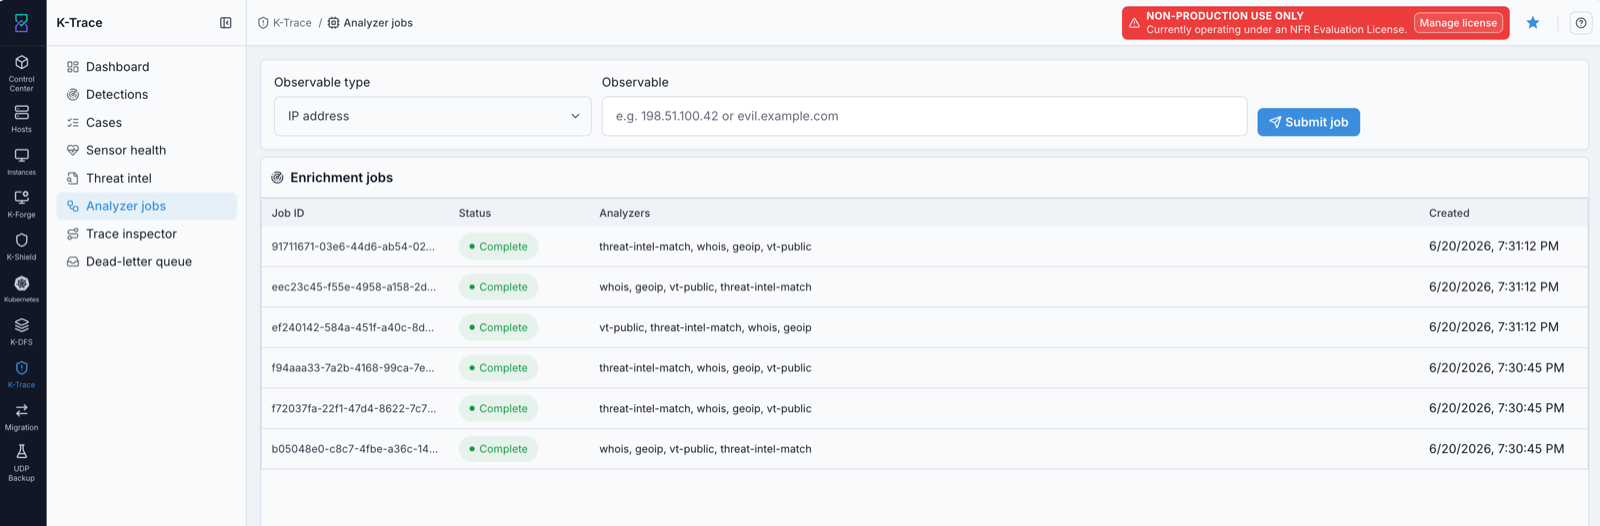
The Analyzer jobs screen submits enrichment for an observable and lists past jobs.
Steps:
Open
K-Trace -> Analyzer jobs.Choose an
Observable type(for example,IP address) and enter theObservablevalue.Click
Submit job.Review the
Enrichment jobstable:Job ID,Status,Analyzersrun (threat-intel-match,whois,geoip(geolocation), andvt-public(VirusTotal public reputation lookup)), andCreated.
Expected Outcome:
The job runs and its status and analyzers appear in the table. The table shows that each job ran and which analyzers were used; it does not display the individual lookup results.
If this fails:
Check the observable value matches the selected type.
If a job stays incomplete, retry it after confirming sensor and service health.
16. Inspect the Processing Trace
When to Use:
Use this to diagnose how a case was ingested, opened, and enriched, for example when enrichment is slow or missing.
Purpose:
Review the processing trace for a case: which internal steps handled it and how long each took.
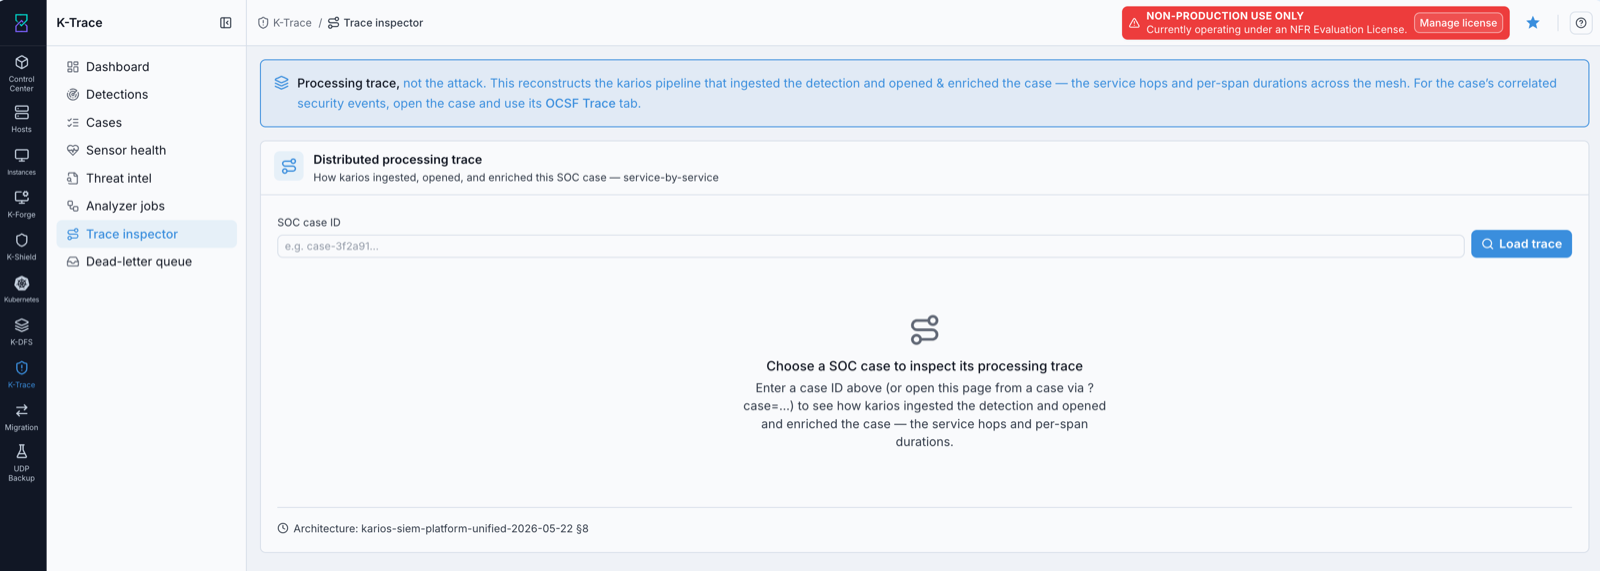
The Trace inspector shows how K-Trace ingested, opened, and enriched a case, step by step.
Steps:
Open
K-Trace -> Trace inspector. The panel is titledDistributed processing trace.Enter or paste the
SOC case ID(the case ID is visible in the case header).Click
Load traceto see the processing steps and their durations.
You can also open the Trace inspector directly from a case, which loads that case’s trace automatically, in addition to entering or pasting a case ID here.
Expected Outcome:
You can see how the case moved through K-Trace’s processing and where any delay occurred.
Note
The Trace inspector shows the processing trace (how K-Trace handled the case), which is different from the case’s OCSF Trace (the security events themselves). For the security events, use the case’s OCSF Trace tab.
If this fails:
Confirm the case ID is correct.
If no trace loads, the case may not have processing data yet.
17. Review the Dead-Letter Queue
When to Use:
Use this to find events that failed processing and need attention.
Purpose:
Review events that were parked after failing to process, for triage and reprocessing.
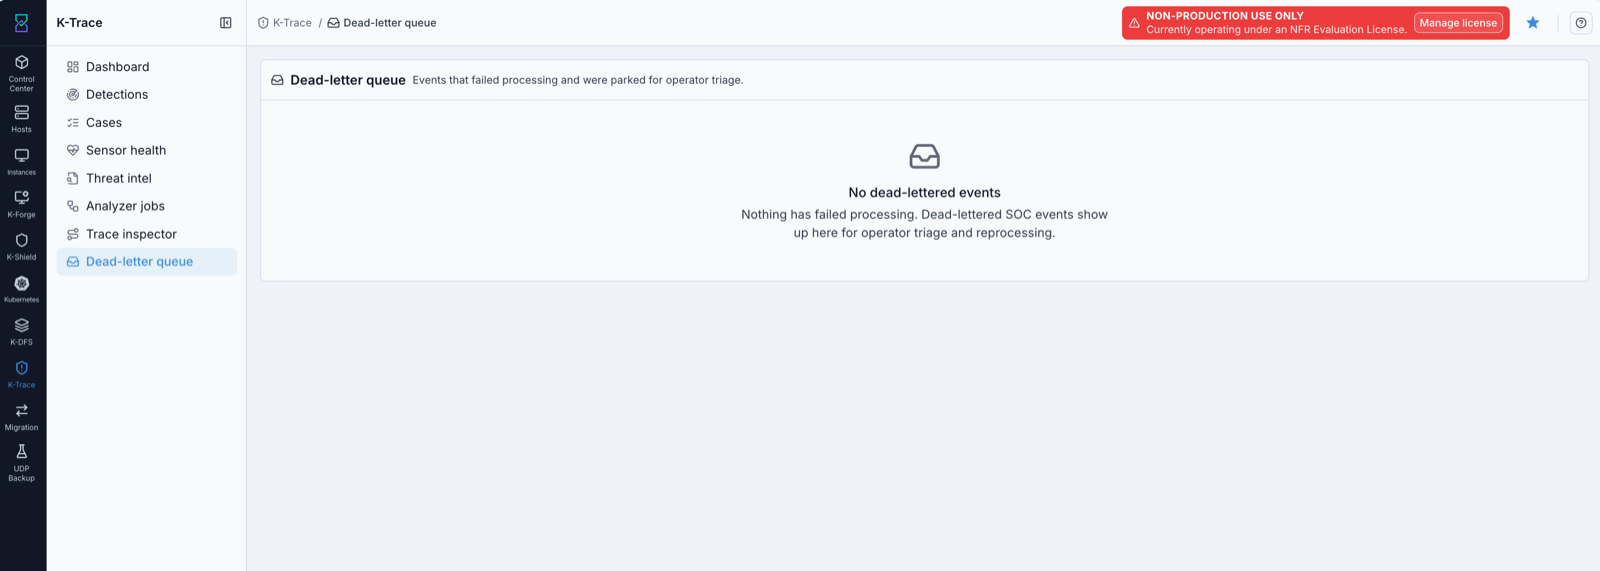
The Dead-letter queue holds events that failed processing, for operator triage and reprocessing.
Steps:
Open
K-Trace -> Dead-letter queue.Review any parked events that failed processing.
Triage and reprocess them as needed.
Expected Outcome:
You can see whether any events failed processing and act on them.
If this fails:
No dead-lettered eventsmeans nothing has failed processing, which is the healthy state.
18. Troubleshooting
Use the per-section If this fails notes first. The table below covers common
cross-cutting issues.
Symptom |
First actions |
|---|---|
A panel or tab is empty |
No data yet for that view. Generate or wait for activity, refresh the page, and confirm sensor health. |
|
The detection store was unreachable, so case stats are current but detection counts may be incomplete. Refresh shortly. |
A tab or action is missing |
Access is role-gated. Confirm your SIEM permissions with your administrator. |
A case will not change status |
Pick a valid next stage, and confirm you have the triage or close permission for that transition. |
Enrichment results never appear |
Enrichment runs automatically as the case is processed; check back shortly. |
A component shows |
Data from that source may be missing. Escalate to your administrator. |
→ Next: Kubernetes