Network Topology
Use Network Topology for real-time visibility into physical and virtual network health across compute nodes.
This page combines host-level and fabric-level networking views in one place:
Dashboard summary cards for overall health and capacity indicators
Nodestab for per-node quick statusAlertstab for active network issuesNode detail tabs for
Bridges,Interfaces,VXLANs,Bonds,VLAN Interfaces, andRoutes
Term Definitions:
MTU: Maximum Transmission Unit, the largest packet size sent without fragmentation.Carrier: whether a network link is physically/operationally up.RX/TX: received/transmitted traffic counters.CRC: Cyclic Redundancy Check error indicator for link/data corruption.
Step: Open Network Topology
When to Use: Use this for initial network-fabric triage and node-level drilldown.
Purpose: Open Network Topology and establish a baseline before reviewing nodes or alerts.
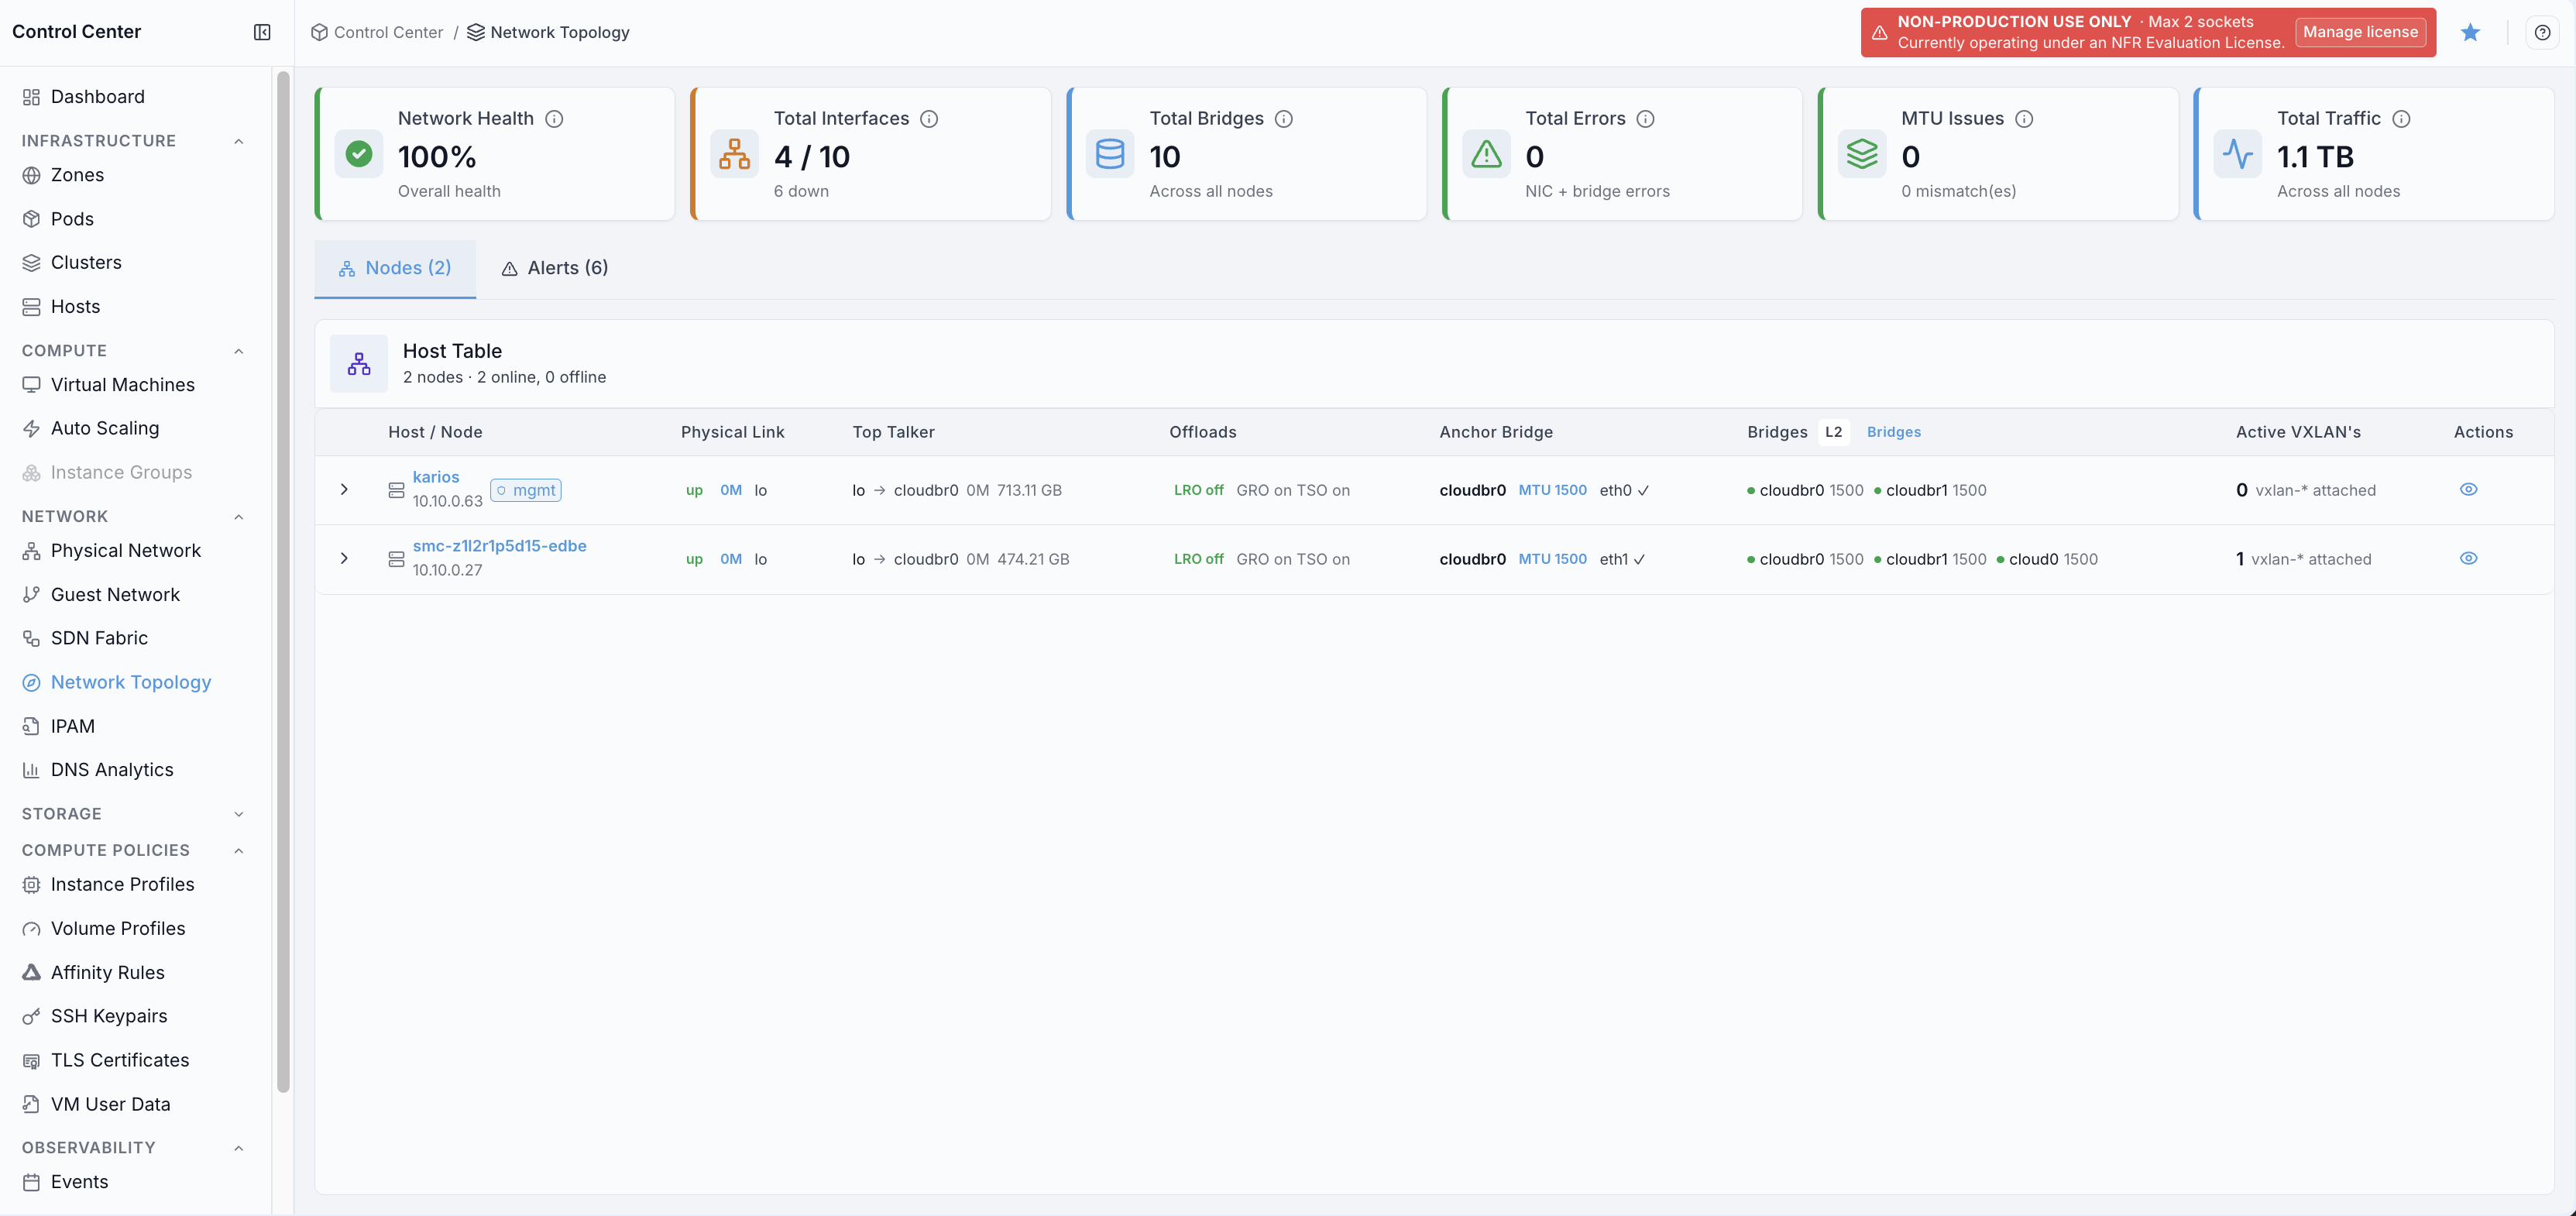
Dashboard shows:
Summary cards for network health, total interfaces, total bridges, total errors, MTU issues, and total traffic.
NodesandAlertstabs for host-level and issue-level troubleshooting entry points. Both tab labels carry a live count, for exampleNodes (6)/Alerts (2).Nodesis the default first view and shows the Host Table immediately on page load.Node rows show physical link state, top talker, offloads, anchor bridge, bridge inventory, active VXLAN count, and an action to open details.
What you can do from this screen:
Start triage from high-level health indicators.
Switch to
Alertsfor active issues.Open node details for bridges, interfaces, and VXLAN analysis.
Steps:
Open
Control Center -> Network -> Network Topology.Confirm
Nodesis selected (default first view).Review dashboard summary cards.
Review the node list shown in the first view.
Use
NodesandAlertstabs for triage.Click a node to open detail tabs.
Expected Outcome:
You get the Nodes-first dashboard view with summary cards and node list visible.
You get direct entry points for alert review and node-level troubleshooting.
If this fails:
Reload
Network Topologyand clear any active node search/filter before retrying.Confirm your account can access
Network Topology.Confirm networking telemetry is available for your environment.
Step: Open Network Topology Help Panel
When to Use: Use this after opening the Network Topology dashboard when you need definitions for cards, tabs, and alerts.
Purpose: Open page help as a separate step from dashboard review.
Steps:
Open
Control Center -> Network -> Network Topology.Click the top-right help icon.
Review the help panel guidance.
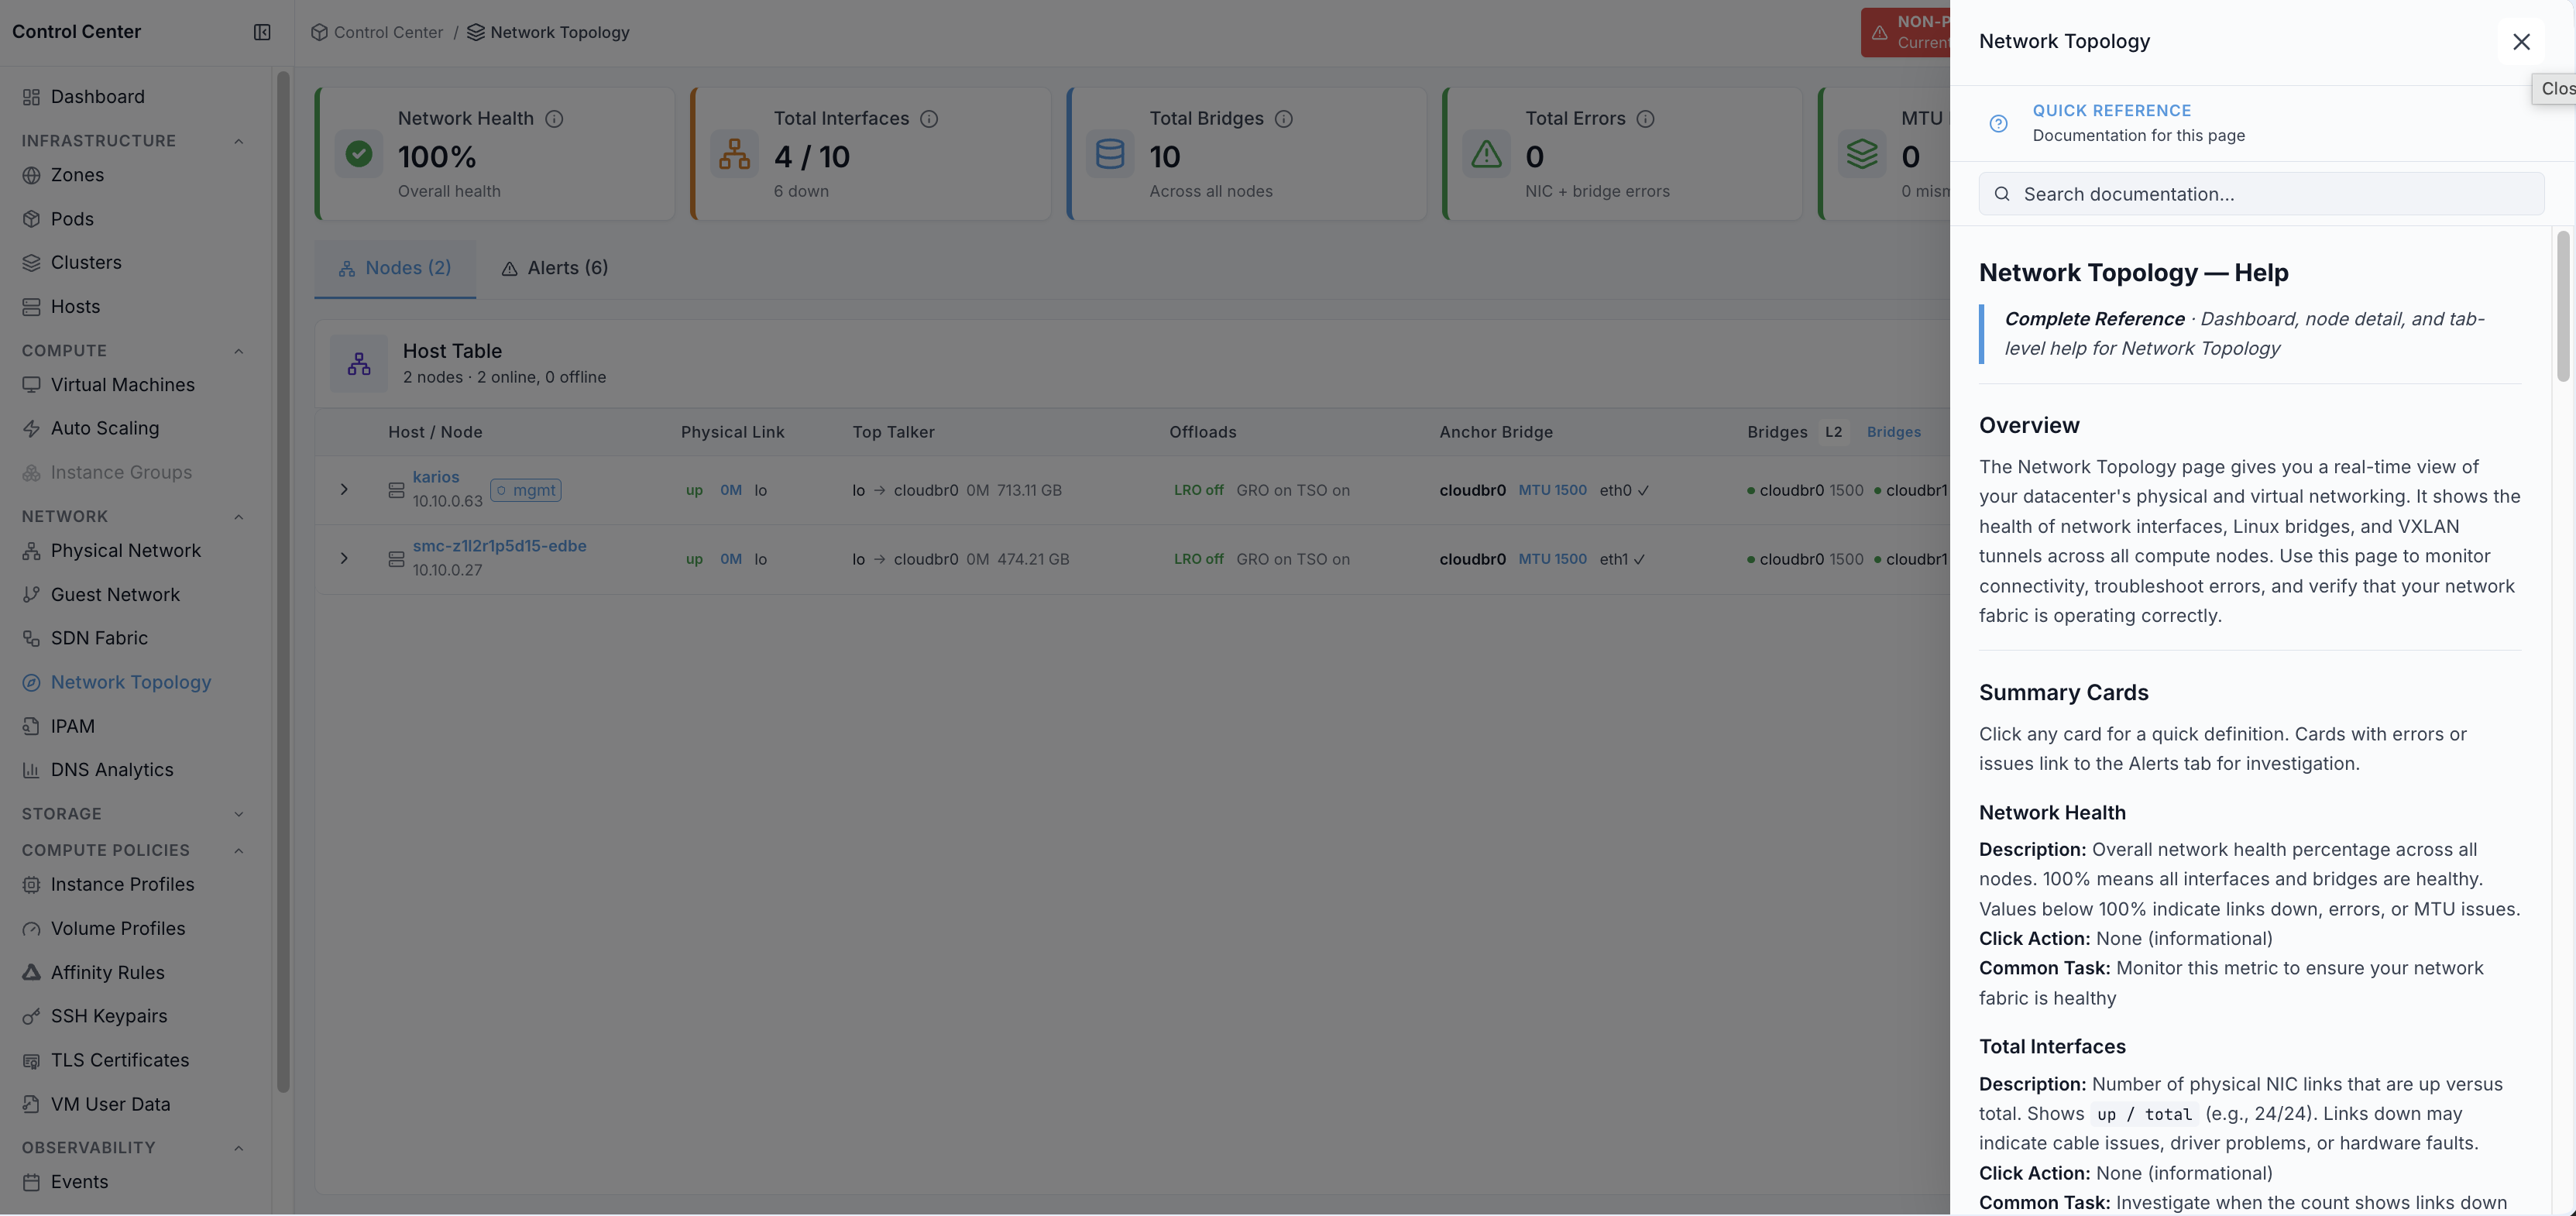
Expected Outcome:
Network Topology help opens in the right-side panel.
You can review the complete reference for dashboard cards, node details, and tab-level troubleshooting.
You can continue dashboard triage with clear context.
If this fails:
Refresh the page and click the help icon again.
Confirm your account can access in-product help content.
Retry after reopening
Network Topology.
Summary Cards
Card |
Description |
Click Action |
Common Task |
|---|---|---|---|
Network Health |
Overall health percentage across nodes and network objects. |
Informational |
Monitor overall networking baseline. |
Total Interfaces |
Count of links up versus total interfaces. |
Informational |
Investigate when links are down. |
Total Bridges |
Total Linux bridge count across nodes. |
Informational |
Validate bridge topology scale. |
Total Errors |
Cumulative NIC/bridge error count. |
Open |
Drill into active error conditions. |
MTU Issues |
Nodes with MTU mismatch/drift conditions. |
Informational |
Use |
Total Traffic |
Aggregate traffic volume across nodes. |
Informational |
Capacity and traffic trend review. |
Warning
MTU mismatches between bridges and interfaces can cause packet drops and unstable connectivity.
Step: Review Nodes View (Default)
When to Use: Use this to identify which host requires detailed bridge/interface/VXLAN investigation.
Purpose: Review node status and open a specific node for deeper network analysis.
Steps:
Open
Control Center -> Network -> Network Topology.Stay on the default
Nodesview.Review the host list.
Review physical link, top talker, offload, bridge, and VXLAN summary fields.
Use the row action to open node details.
Expected Outcome:
You can identify which node requires deeper bridge/interface/VXLAN inspection.
Nodes table:
Column |
Description |
|---|---|
Host / Node |
Host IP or FQDN. Click to open node detail page. |
Physical Link |
Primary physical link state and interface name. |
Top Talker |
Highest-traffic interface or bridge on that node. |
Offloads |
LRO/GRO/TSO status summary. |
Anchor Bridge |
Primary bridge and MTU shown for the node. |
Bridges |
L2 bridge membership and MTU status. |
Active VXLANs |
Number of attached VXLAN interfaces. |
Actions |
Open node details. |
If this fails:
1. Refresh Nodes and clear any active filter.
2. Confirm node inventory is available in your environment.
3. Reopen Network Topology and retry node selection.
Step: Review Alerts Tab
When to Use: Use this when troubleshooting active network faults by severity and category.
Purpose: Review current network alerts and pivot to affected nodes for root-cause analysis.
Steps:
In Network Topology, click
Alerts.Filter by node when focusing investigation.
Open the affected node from the alert row.
Verify issue context in node detail tabs.
Expected Outcome:
You can isolate active network faults by severity/category and pivot directly to the affected node.
If this fails:
Reopen the
Alertstab and confirm alert stream data is loading.Confirm alert stream and node inventory are available.
Reopen
Network Topologyand retryAlertstab.
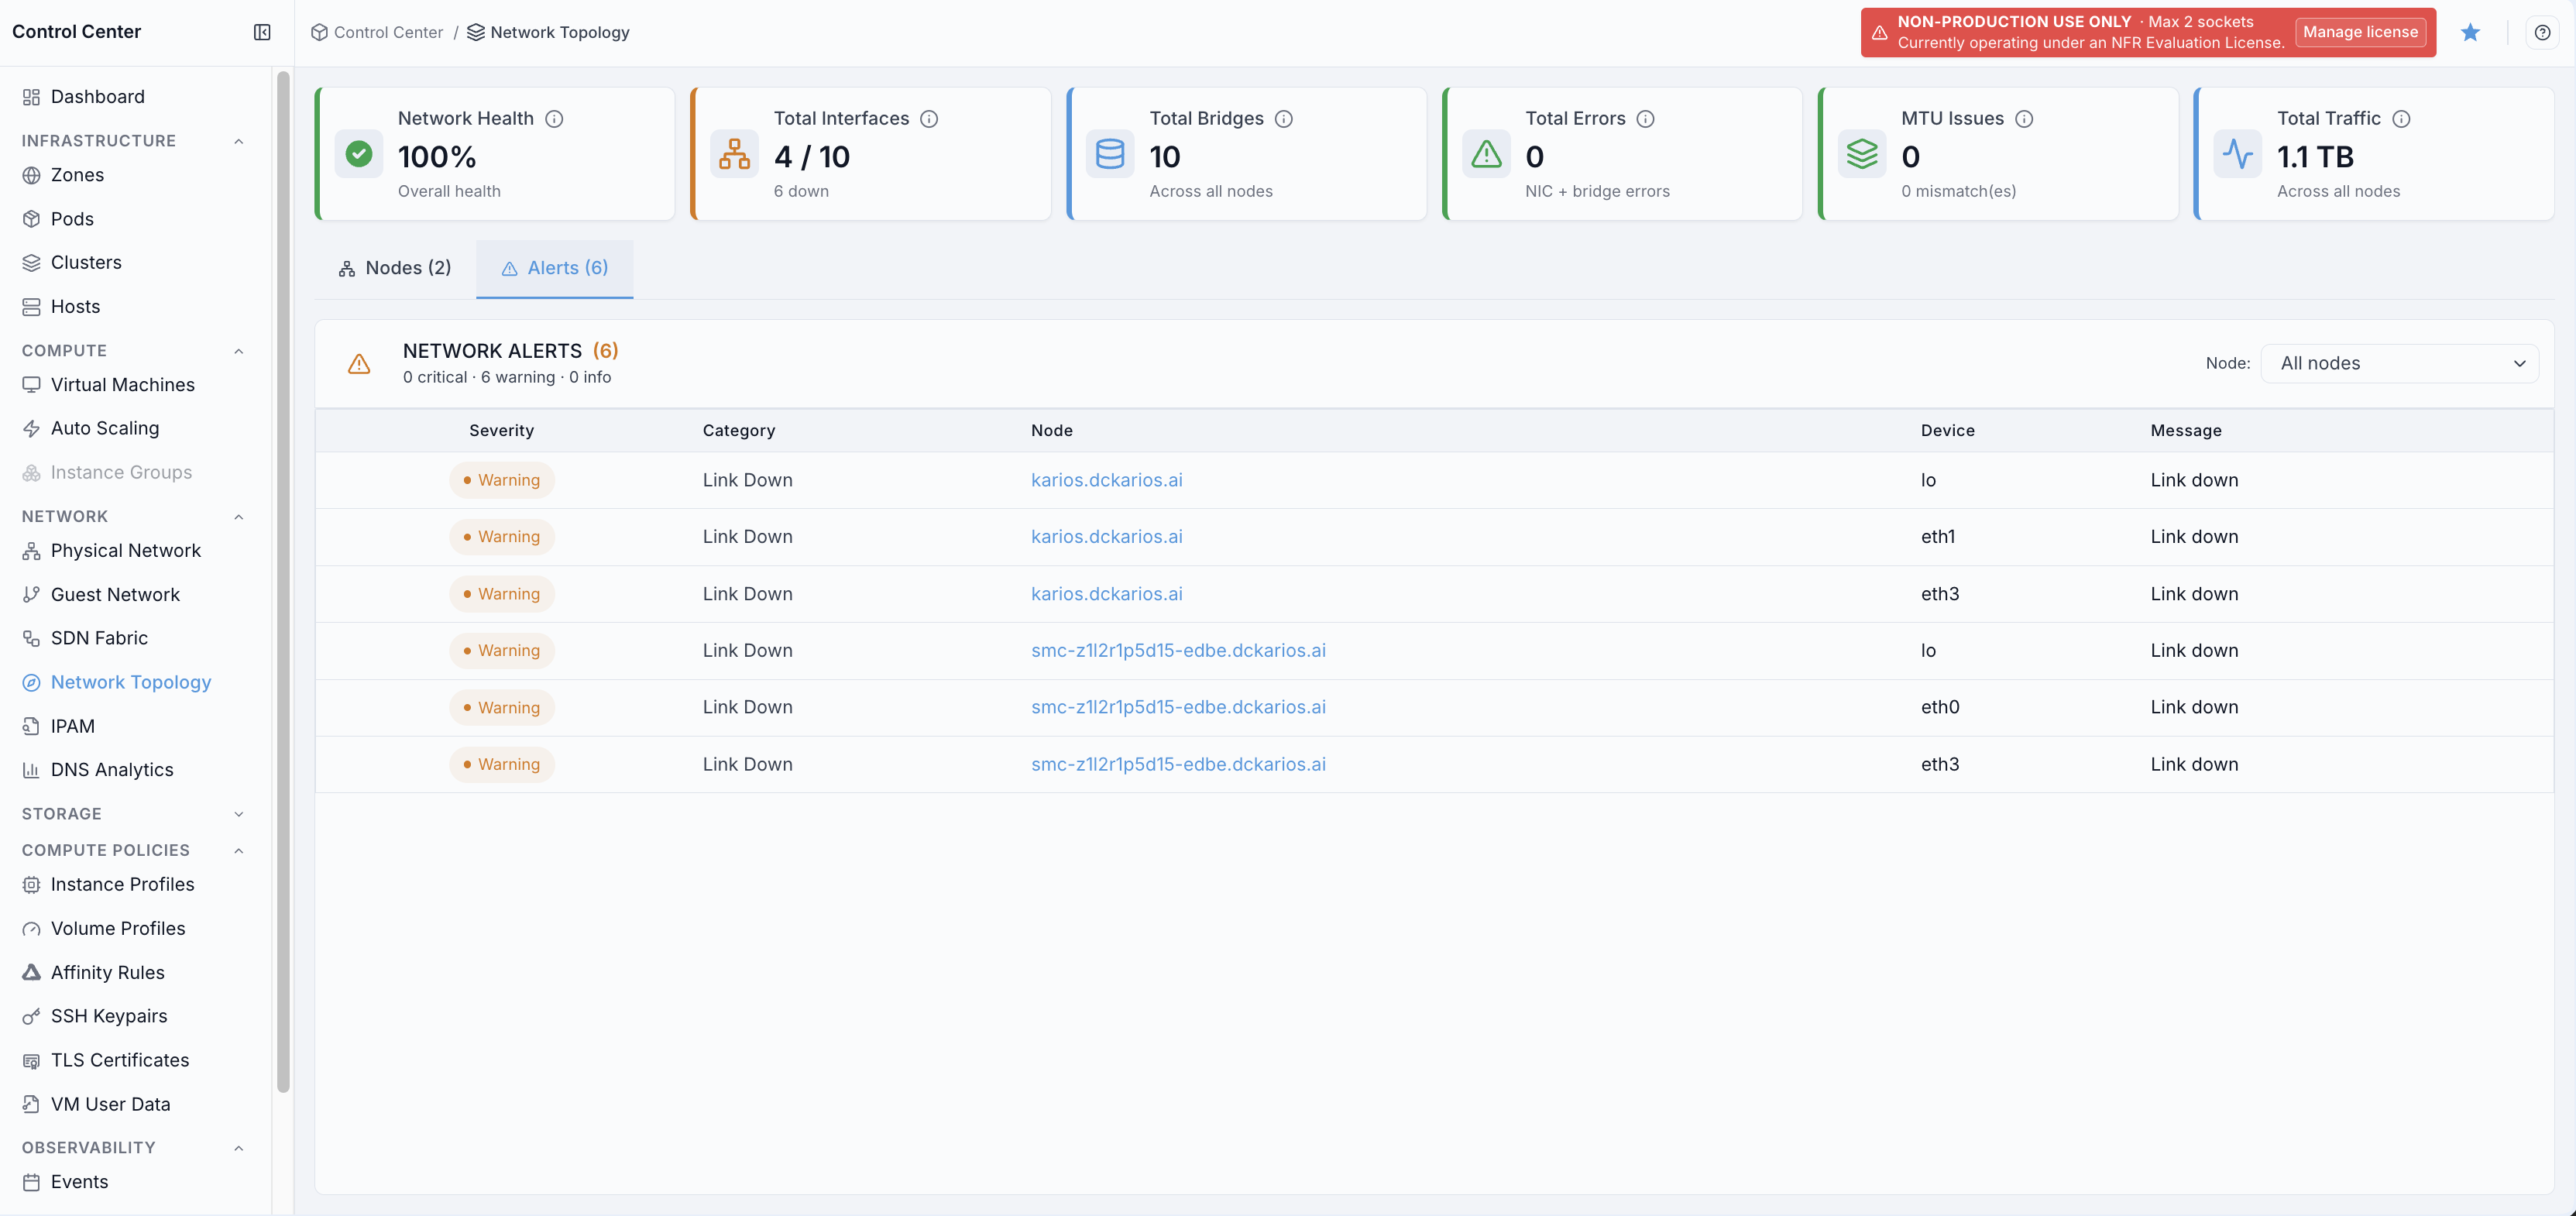
Network Alerts table:
Severity |
Category |
Node |
Device |
Message |
|---|---|---|---|---|
Critical/Warning/Info |
Link Down, Errors, MTU, MTU Drift, node_offline, ntp, vxlan_fabric |
Host where alert occurred |
Interface/bridge name |
Human-readable issue description |
Alert categories:
Link Down: interface operational/admin downErrors: elevated RX/TX/CRC errorsMTU: MTU mismatch between connected components on one nodeMTU Drift: cluster-wide - the same bridge name carries different MTUs on different nodes (for exampleCluster MTU drift: MTU 1500 on node-a, MTU 9000 on node-b)node_offline: the node is unreachable, so no per-device data was collected (Node unreachable)ntp: the node’s clock is not synchronised, or its offset has drifted past the warning thresholdvxlan_fabric: cluster-wide - only some online KVM nodes have active VXLAN tunnels; cross-check on SDN Fabric
Note
The last three categories are shown as raw identifiers (node_offline, ntp,
vxlan_fabric) rather than friendly names. node_offline rows have no
Device; vxlan_fabric is cluster-wide, so it has neither Node nor
Device.
Node Detail Page
Click any node from Nodes or Alerts to open node details.
The node detail view includes six operational tabs:
BridgesInterfacesVXLANsBondsVLAN InterfacesRoutes
Bridges Tab
When to Use:
Use this when network issues point to bridge state, bridge membership, carrier loss, or bridge-level errors.
Purpose:
Validate Linux bridge health and identify which bridge/member is causing impact.
Steps:
Open
Control Center -> Network -> Network Topology.In
Nodes, click the target node to open node details.Open the
Bridgestab.Review cards and bridge rows for state, MTU, members, carrier, and error indicators.
Expected Outcome:
You can confirm whether bridge-layer connectivity is healthy.
You can identify the affected bridge/member for follow-up action.
If this fails:
Refresh node details and reopen
Bridges.Confirm the node is online in
Nodes.Retry from the related
Alertsrow for the same node.
Use this tab to inspect Linux bridge state, membership, and error counters.
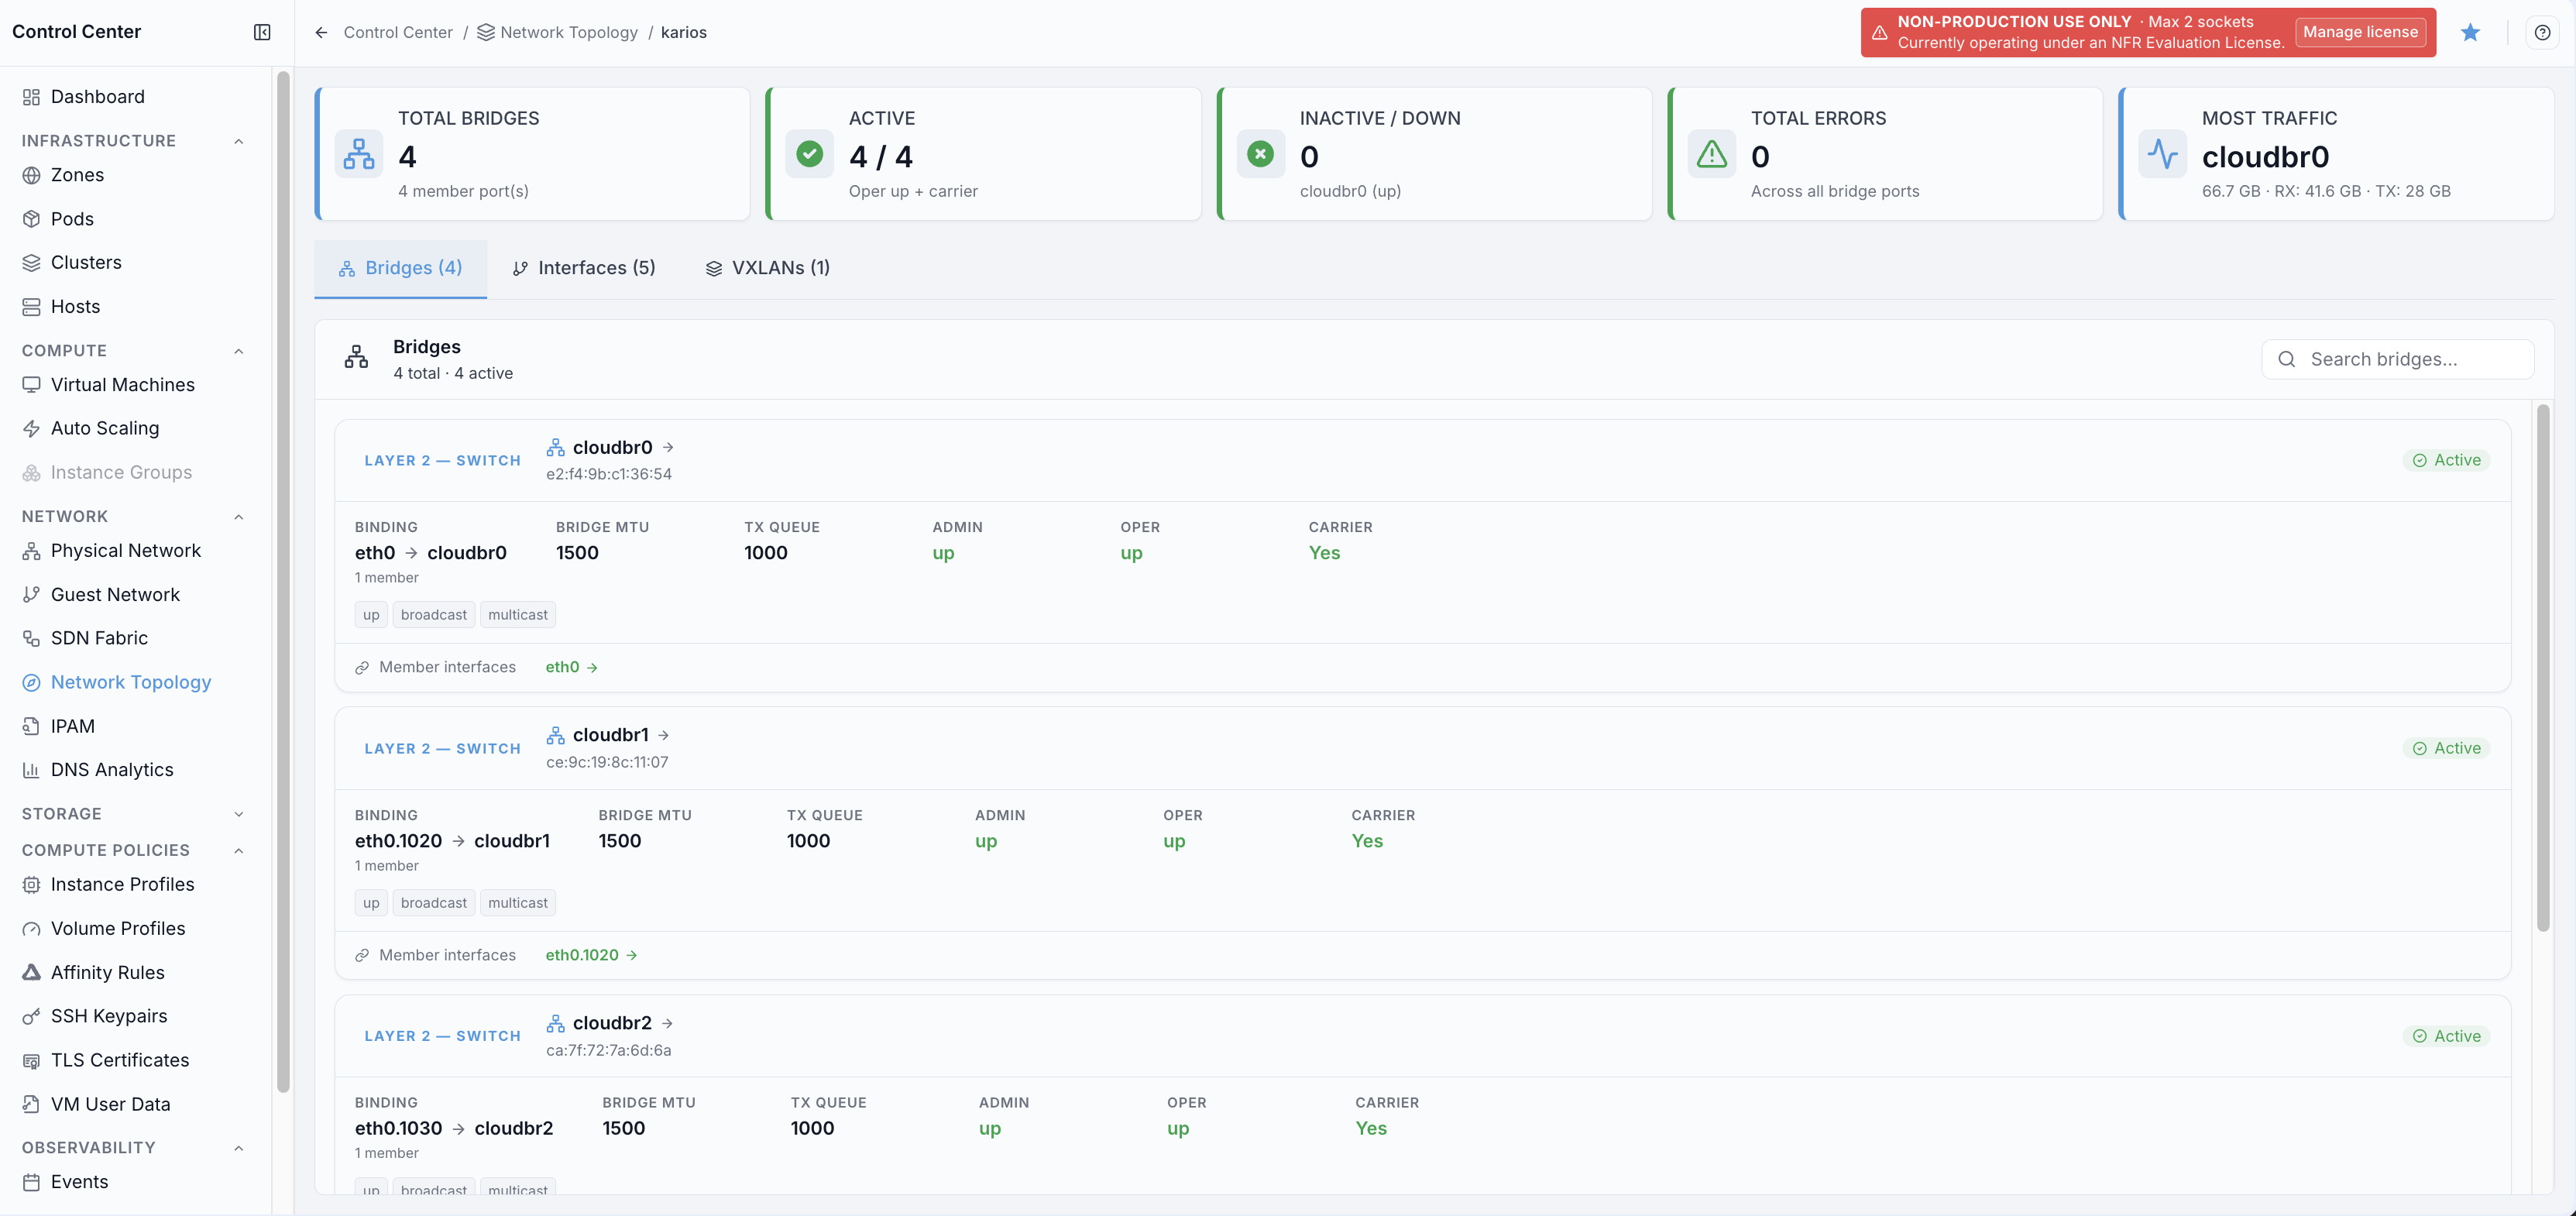
Bridge details page:
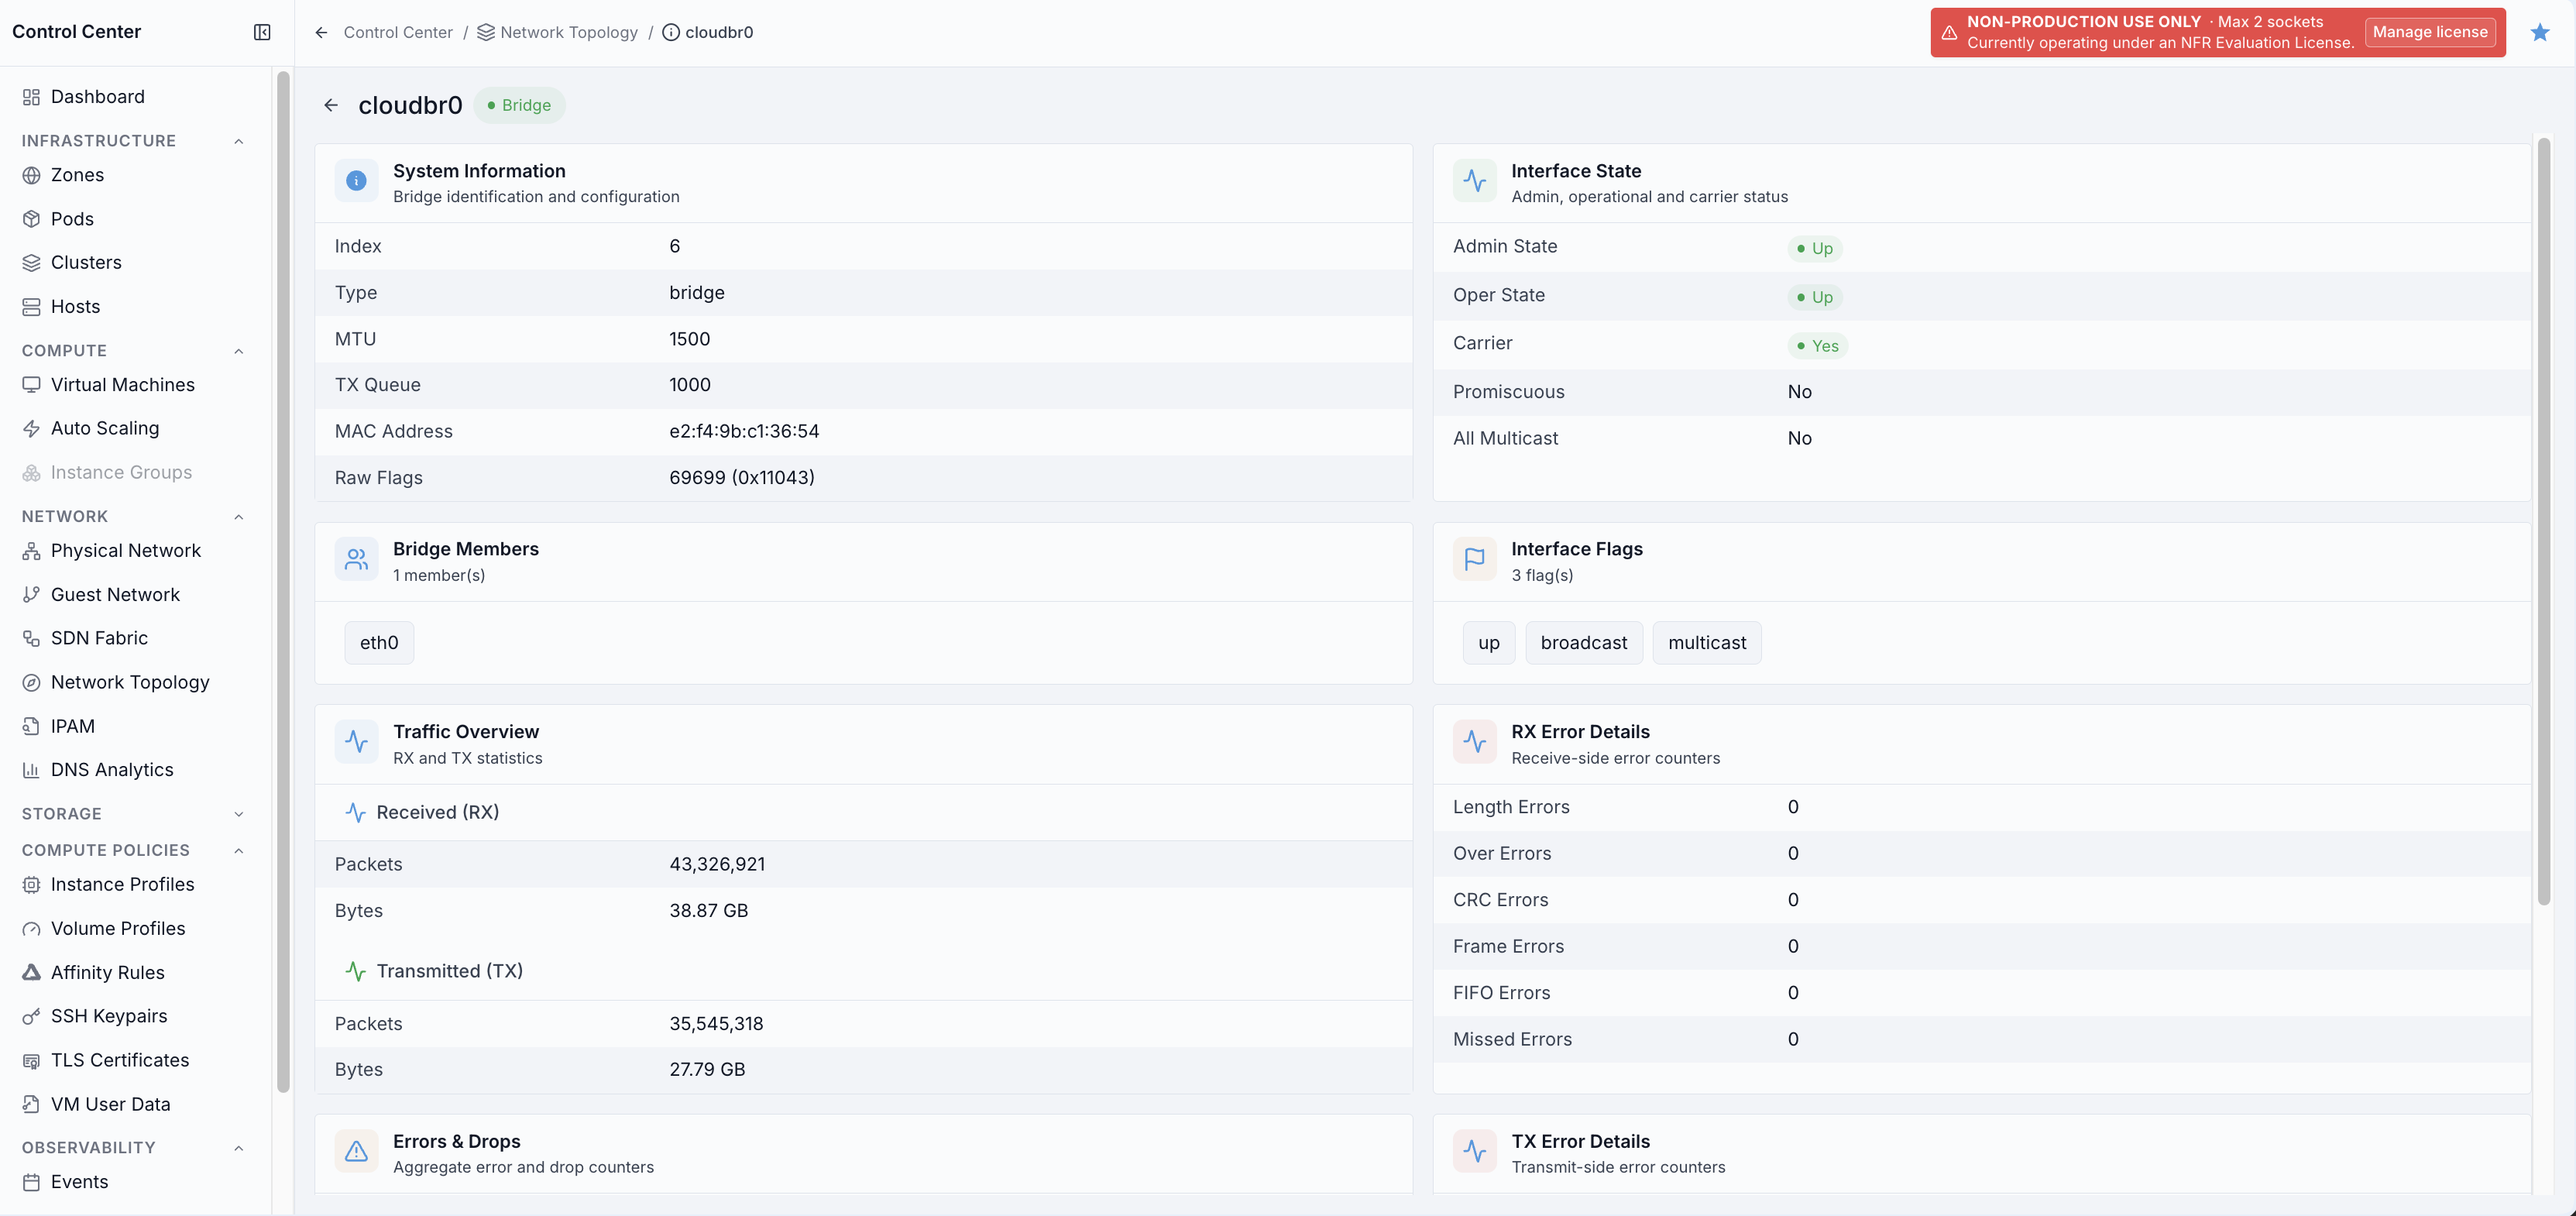
Bridge stats cards include:
Total bridges
Active
Inactive/Down
Total errors
Most traffic
Bridge row details include:
Name (for example
cloudbr0)Layer type and MAC address
Binding/member interface
Bridge MTU and TX queue
Admin, operational, and carrier state
Flags and member interfaces
Traffic, error, and drop counters
Expandable
QoS detailsand aQOS PROFILEfield (for exampleAqm/fq_codel)Member interfaceschips - click one to jump straight to that interface
Managing Bridges
+ Create Bridgeopens a form to add a new Linux bridge on the node.Platform-managed bridges (badge
Platform Managed) cannot be edited or deleted from here - they are owned by traffic-type/fabric configuration.A bridge you created yourself exposes edit and delete actions on its row.
Interfaces Tab
When to Use:
Use this when you need NIC-level or virtual-interface-level status and packet counters.
Purpose:
Verify interface state, drops, and errors to isolate link or port-level faults.
Steps:
Open
Control Center -> Network -> Network Topology.In
Nodes, click the target node to open node details.Open the
Interfacestab.Review links-up, error, and drop counters and check affected interface rows.
Expected Outcome:
You can identify which interface is down, noisy, or dropping traffic.
You can separate interface faults from bridge or overlay faults.
If this fails:
Refresh node details and reopen
Interfaces.Confirm interface telemetry is available for the node.
Cross-check with
Alertsfor the same node/device.
Use this tab to inspect physical and virtual interface health and counters.
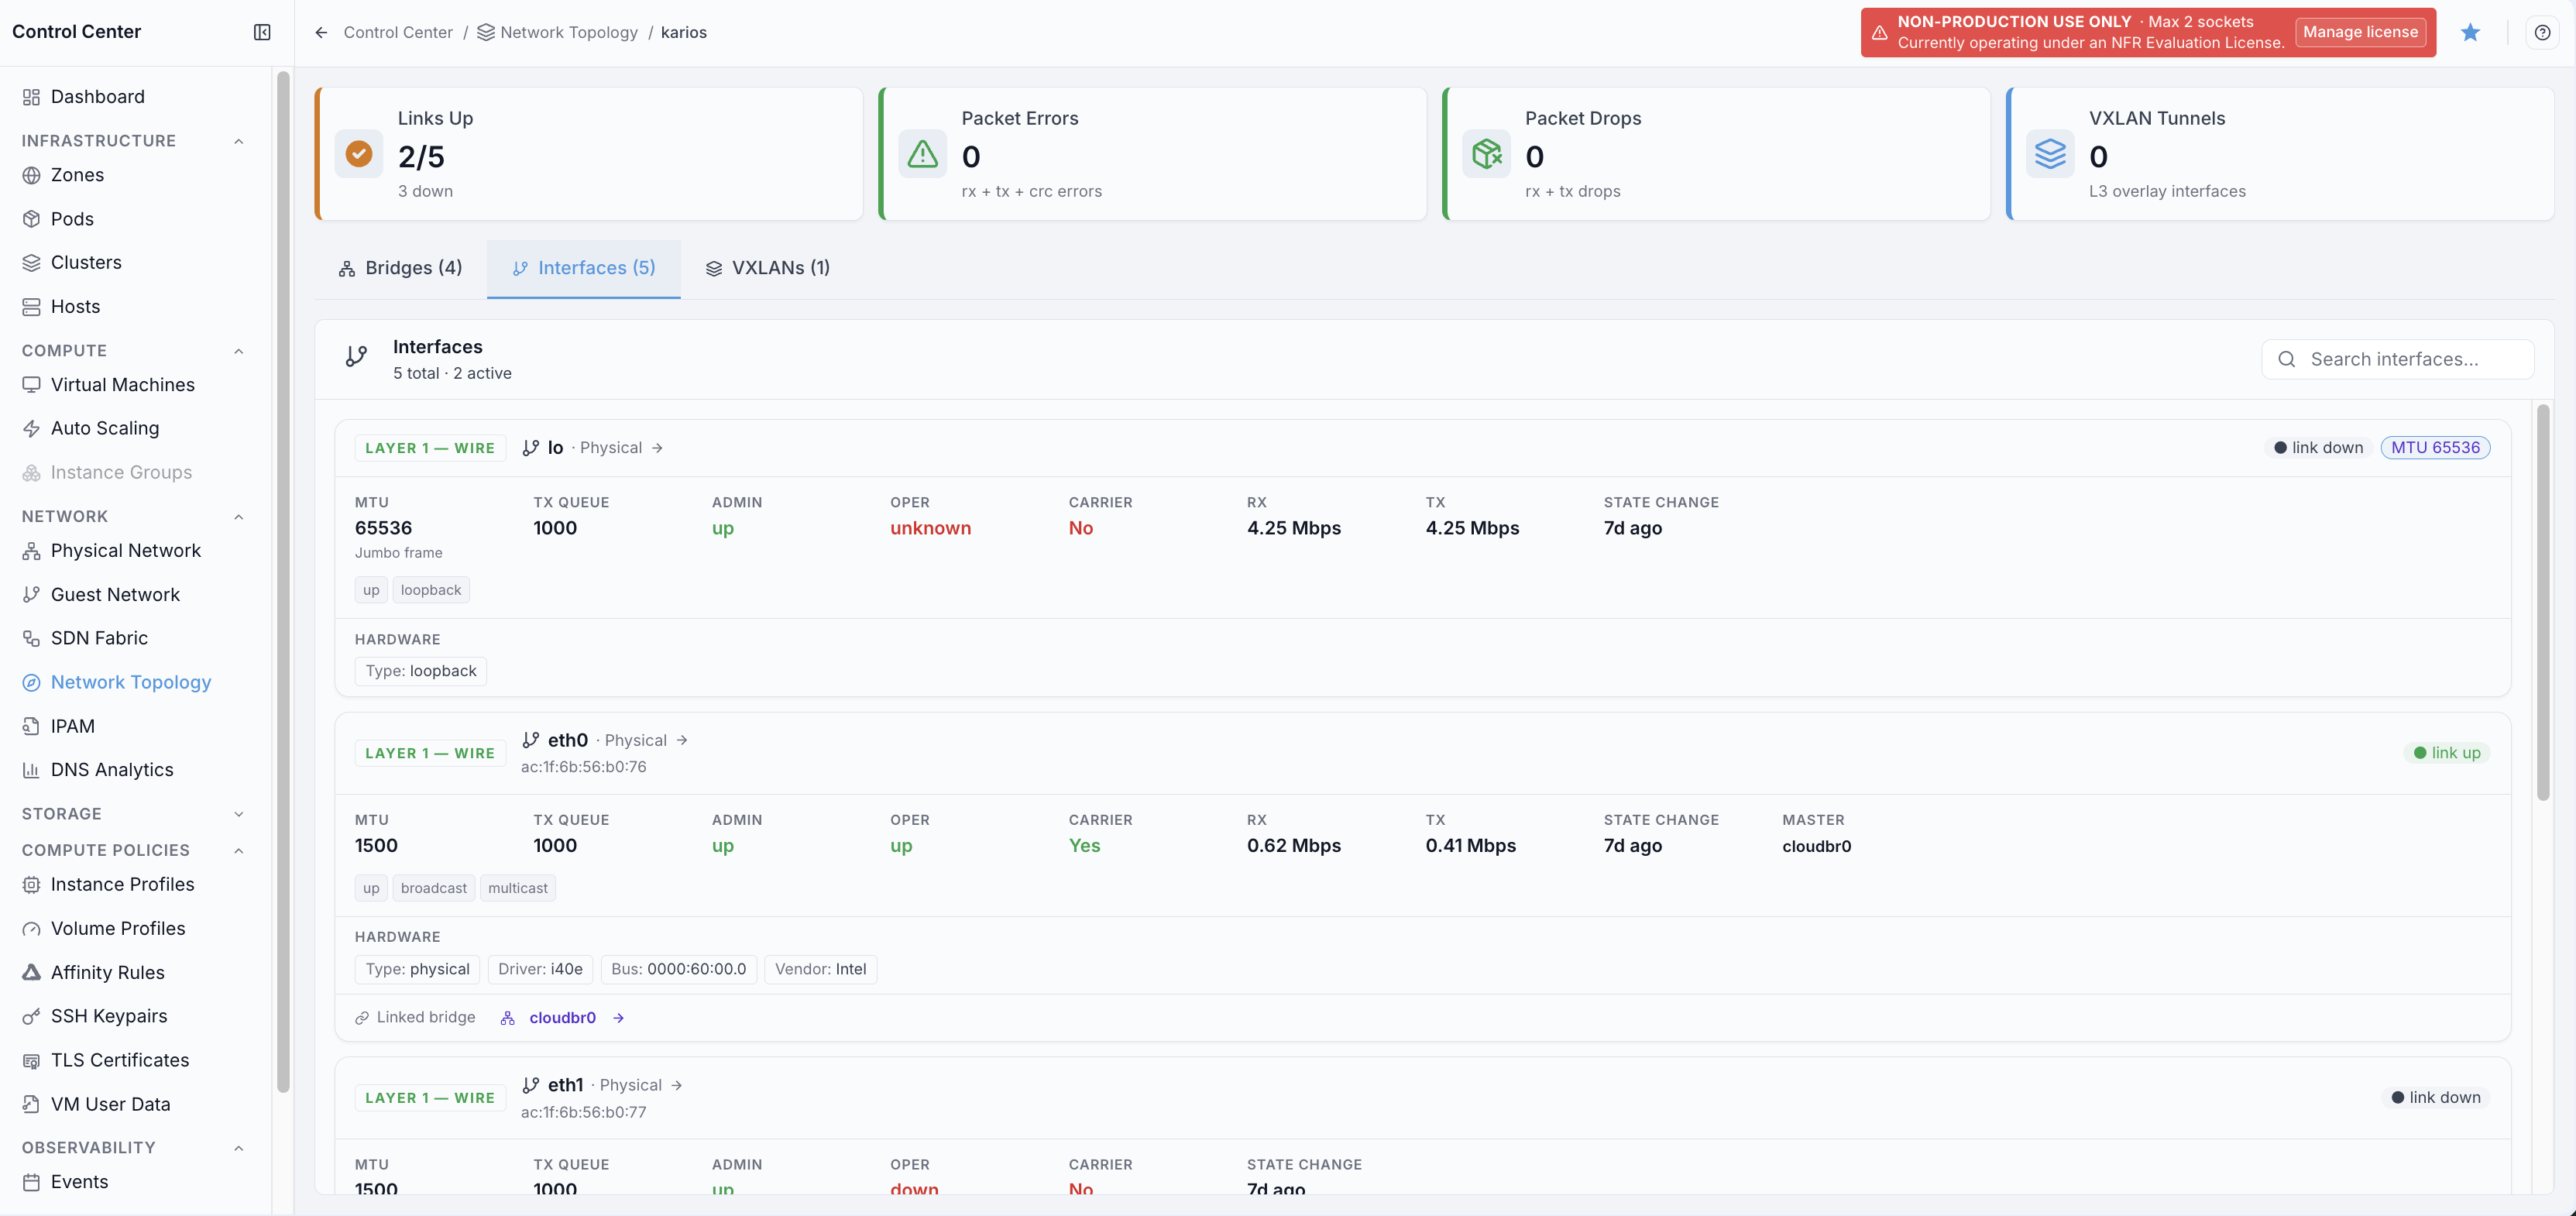
Interface stats cards include:
Links up
Packet errors
Packet drops
VXLAN tunnels
Interface table fields include:
Interface
Layer and type
Master
MTU
TX queue
Admin, operational, and carrier state
RX/TX traffic
State change age
Hardware details (driver, bus, vendor) and linked bridge
Expandable
QoS detailsand aQOS PROFILEfield (for exampleAqm)
Managing Interfaces
+ Create Interfaceadds a new interface on the node.Platform-managed interfaces carry a locked
Platform Managedbadge. They cannot be deleted, and the admin up/down toggle andMTUare locked in the edit panel - changing either can isolate the node or break the fabric path MTU. They are not fully read-only: offloads,RX ring/TX ringbuffers, andTX queue lengthstay editable. On the platform-owned public-egress interface, QoS is editable as well.A non-platform-managed interface (for example a manually added dummy/test interface) shows edit (pencil) and delete (trash) actions on its row.
Some interfaces are fully read-only and offer no actions: system virtual devices (loopback and virtualization plumbing) and interfaces of unattributed origin. They carry a
Read-onlybadge, and the platform refuses mutations on them server-side.
VXLANs Tab
When to Use:
Use this when overlays are suspected (cross-host VM connectivity, VNI spread, tunnel state).
Purpose:
Validate VXLAN tunnel health and VNI participation on the selected node.
Steps:
Open
Control Center -> Network -> Network Topology.In
Nodes, click the target node to open node details.Open the
VXLANstab.Review tunnel state, VNI values, local/remote endpoint fields, and error/drop counters.
Expected Outcome:
You can confirm whether VXLAN tunnels are up and VNIs are present as expected.
You can identify overlay mismatches for targeted SDN follow-up.
If this fails:
Refresh node details and reopen
VXLANs.Verify the node has active VXLAN interfaces in this environment.
Cross-check with
SDN FabricEVPN/VNI views.
Use this tab to inspect overlay tunnels and VNI participation state.
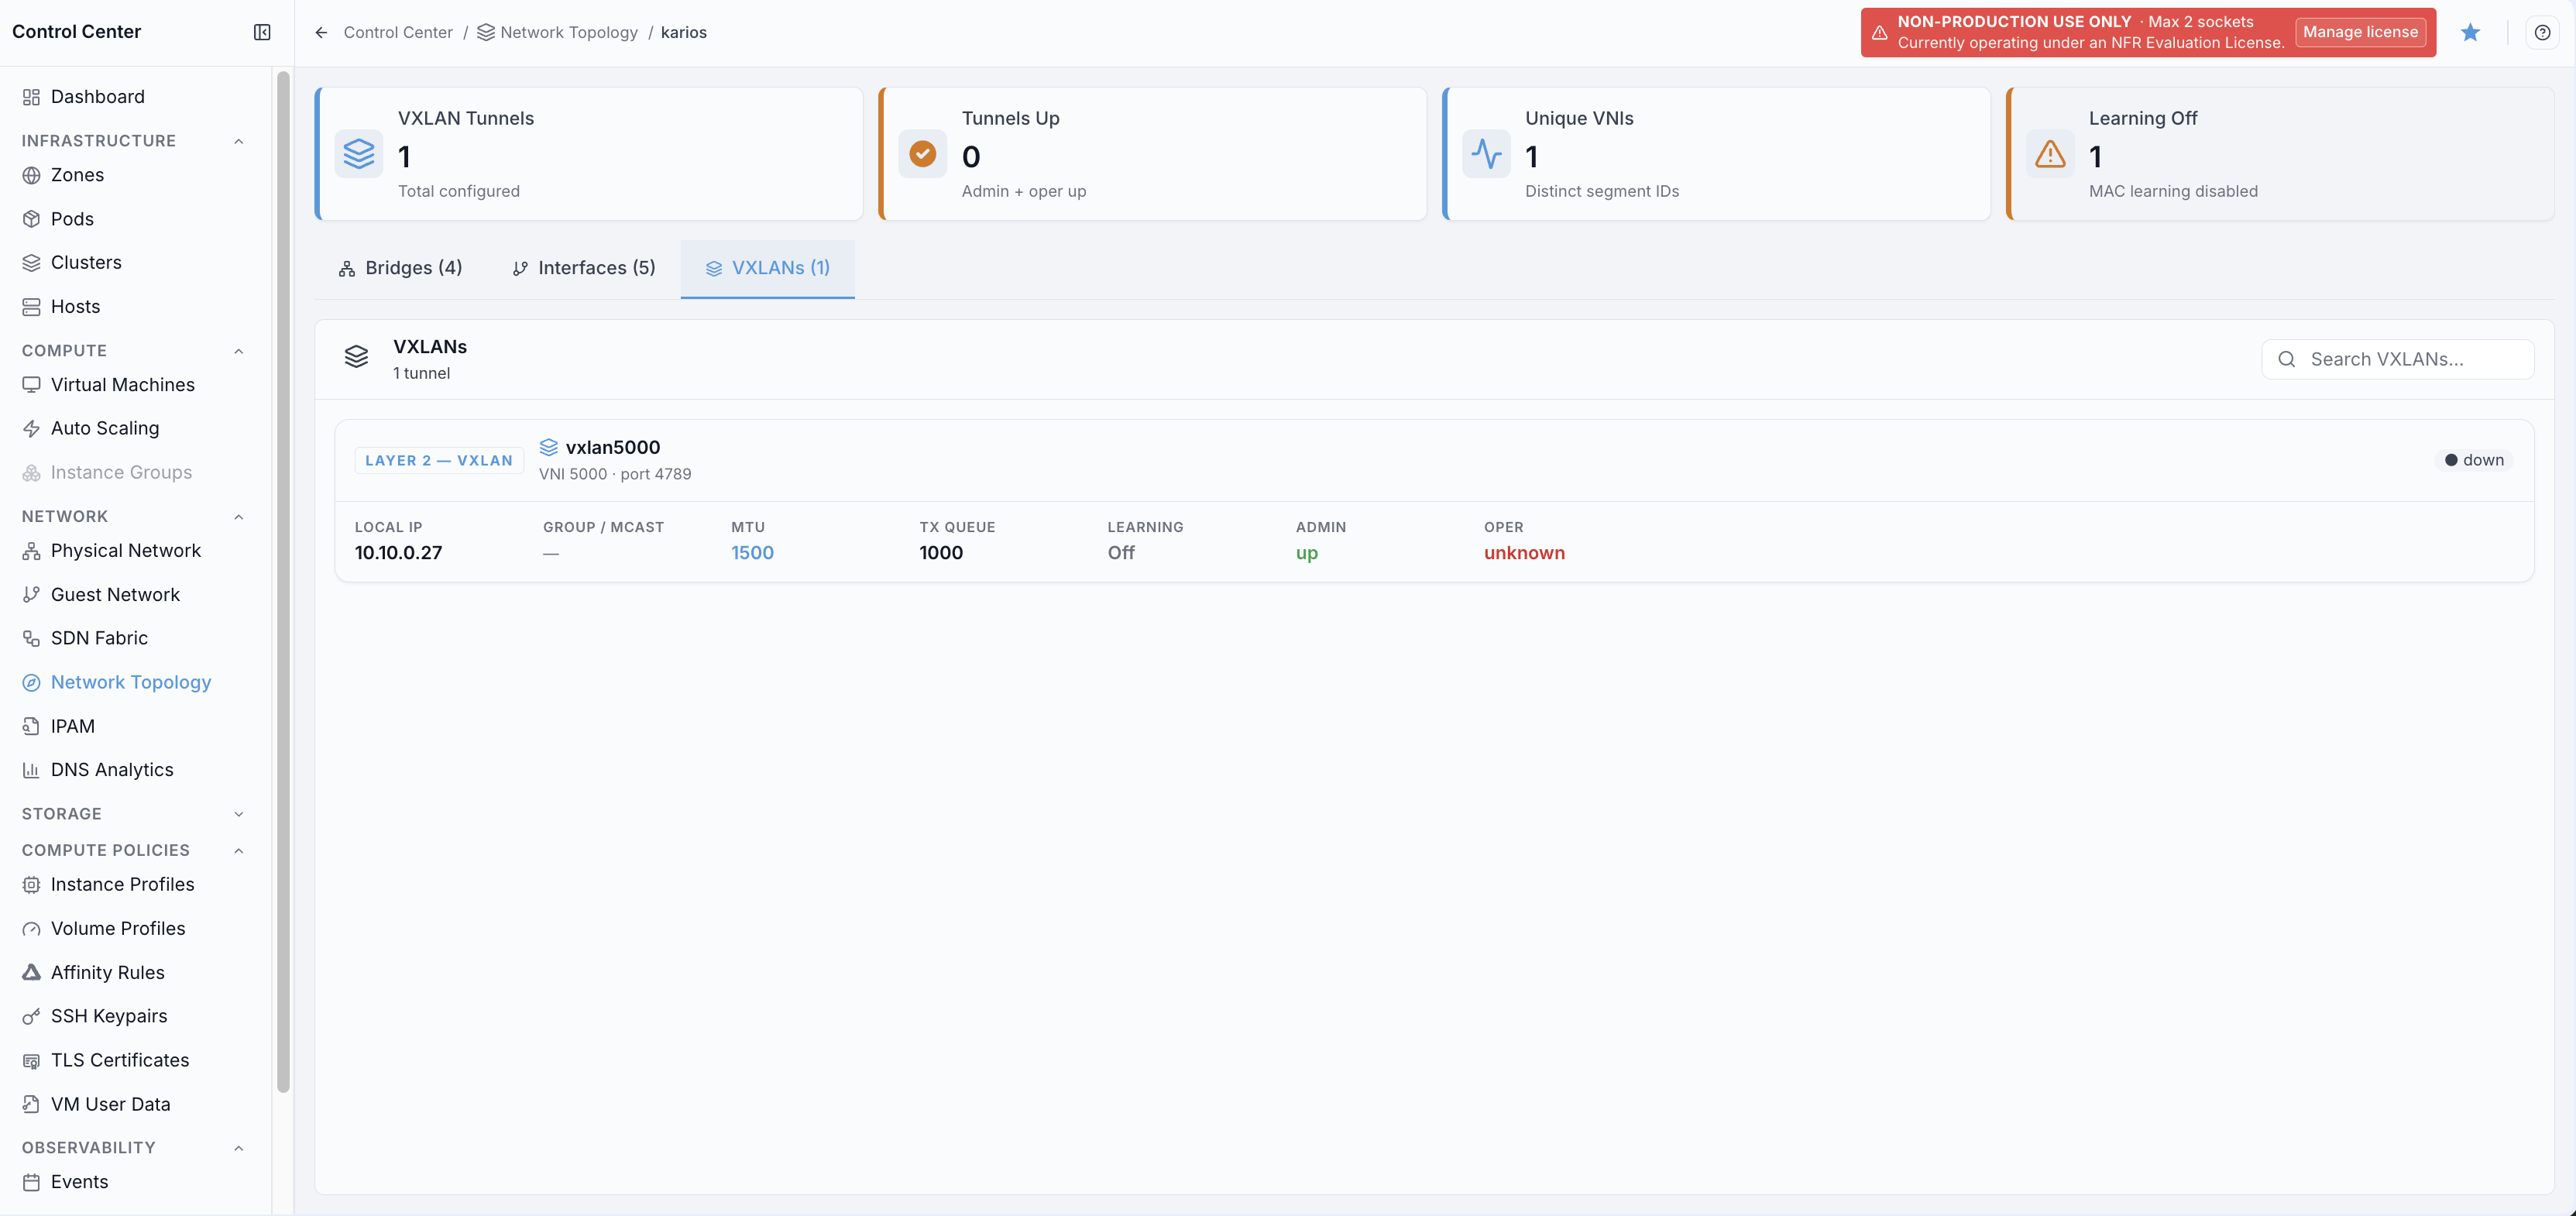
VXLAN stats cards include:
VXLAN tunnels
Tunnels up
Unique VNIs
Learning off
VXLAN card fields include:
Name
VNI
Local IP
Group/multicast value
MTU and TX queue
Learning state
Admin and operational state
Platform Managedbadge - present when the fabric (not you) created the tunnel
Bonds Tab
Lists any bonded (LACP/active-backup) interfaces on the node. Empty on a node with no
bonds configured. Bond rows follow the same state/MTU/carrier fields as Interfaces.
VLAN Interfaces Tab
When to Use:
Use this to inspect or create 802.1Q VLAN sub-interfaces on a node’s physical NICs.
Steps:
Open
Control Center -> Network -> Network Topology.In
Nodes, click the target node to open node details.Open the
VLAN Interfacestab.
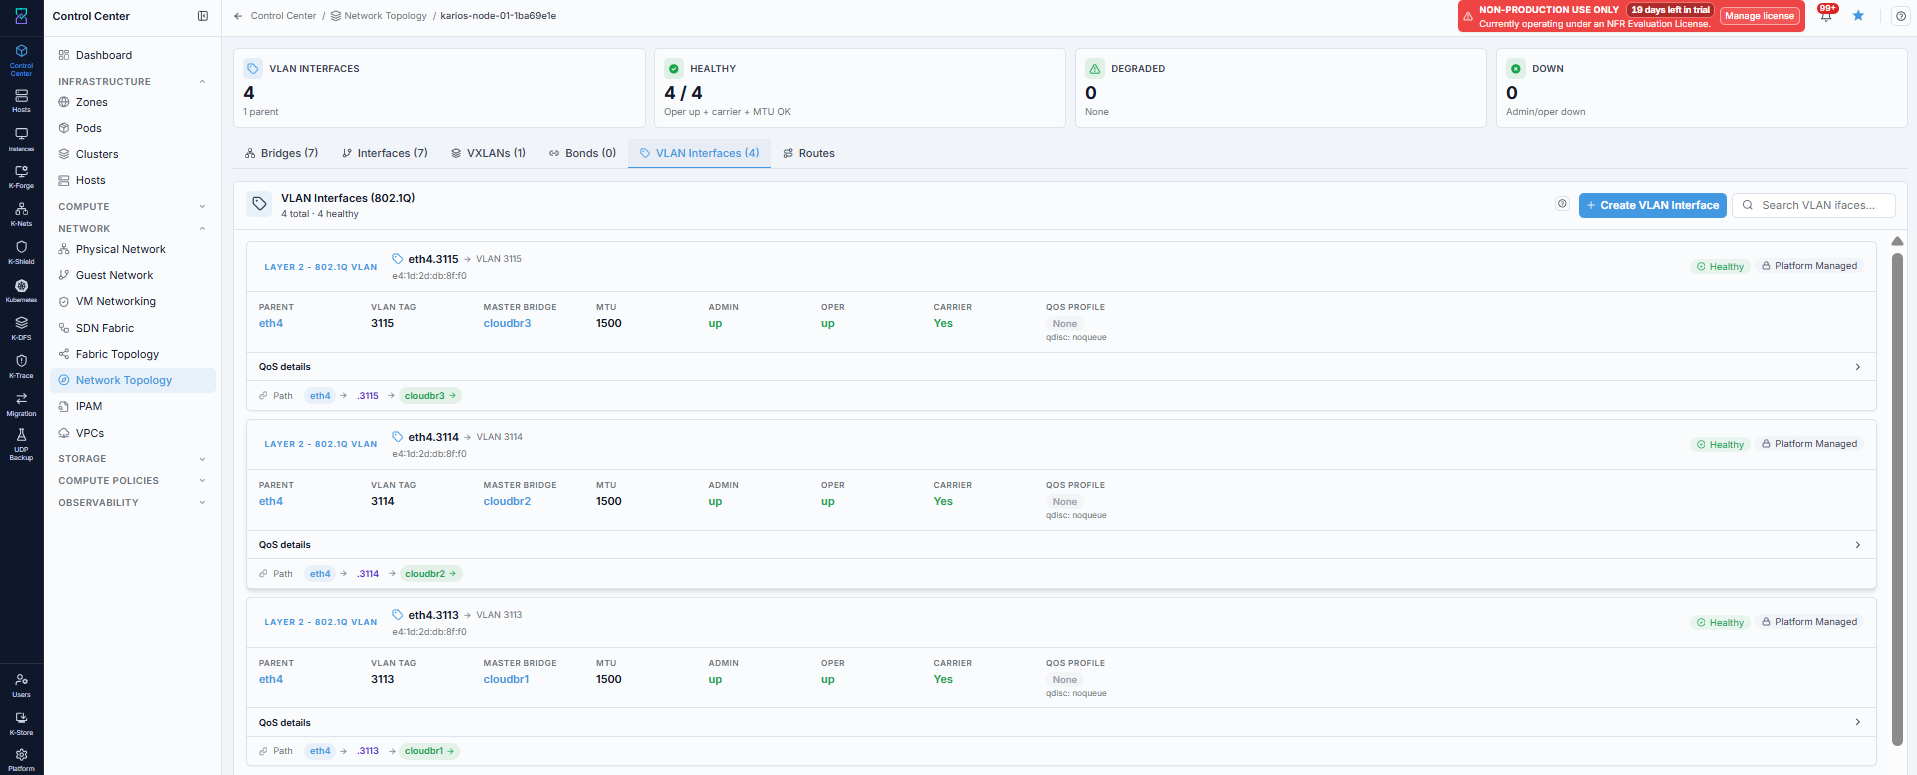
Stats cards show VLAN Interfaces, Healthy, Degraded, and Down counts.
Each row shows the sub-interface (for example eth4.3115), VLAN tag, Parent
NIC, Master Bridge, MTU, admin/operational/carrier state, a QoS details
expander, and a Path breadcrumb (parent NIC -> VLAN tag -> bridge) - click any
segment to jump to that resource.
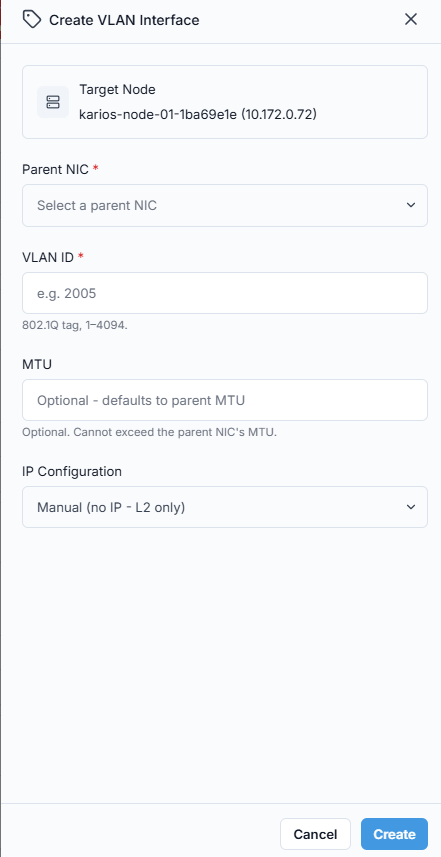
Create a VLAN Interface
Before you start:
The
Parent NIClist only offers interfaces that can actually parent a VLAN: it excludes existing VLAN sub-interfaces (VLAN-on-VLAN is not supported), bridges, VXLAN devices, dummy devices, and loopback, and it excludes any NIC that is not both admin and operationally up. If a NIC you expect is missing, check its state on theInterfacestab first.The list is populated only after the target node resolves.
Createstays disabled until then.Creating the interface requires the network-management permission.
Steps:
Click
+ Create VLAN Interface.Select the
Parent NICand enter aVLAN ID(1-4094).Optionally set
MTU. It defaults to the parent’s MTU and cannot exceed it.Choose an
IP Configuration:Manual (no IP - L2 only)- the default. Creates the sub-interface with no address, for use as a bridge member or tagged L2 path.Static- revealsAddress (CIDR),Gateway, andDNS servers.DHCP- takes no further input.
Click
Create.
Note
A Gateway entered here is applied at the node’s next boot, not live. The platform
deliberately avoids changing a running node’s default route. Do not expect the new
gateway to take effect immediately.
If this fails:
Static IP validation is unavailable - the Karios Atlas DCIM tool is still
initializing.
The static-address collision check fails closed rather than skipping. Retry in a few seconds; do not work around it by switching toManual.IP ... is already in use- the static address is already registered elsewhere. Pick a different address.VLAN sub-interface already exists- thatParent NICandVLAN IDpair is already present on the node. Check the list before recreating it.If the request is rejected as misdirected, reopen the node detail page from
Nodesso the request is routed to the correct node, then retry.
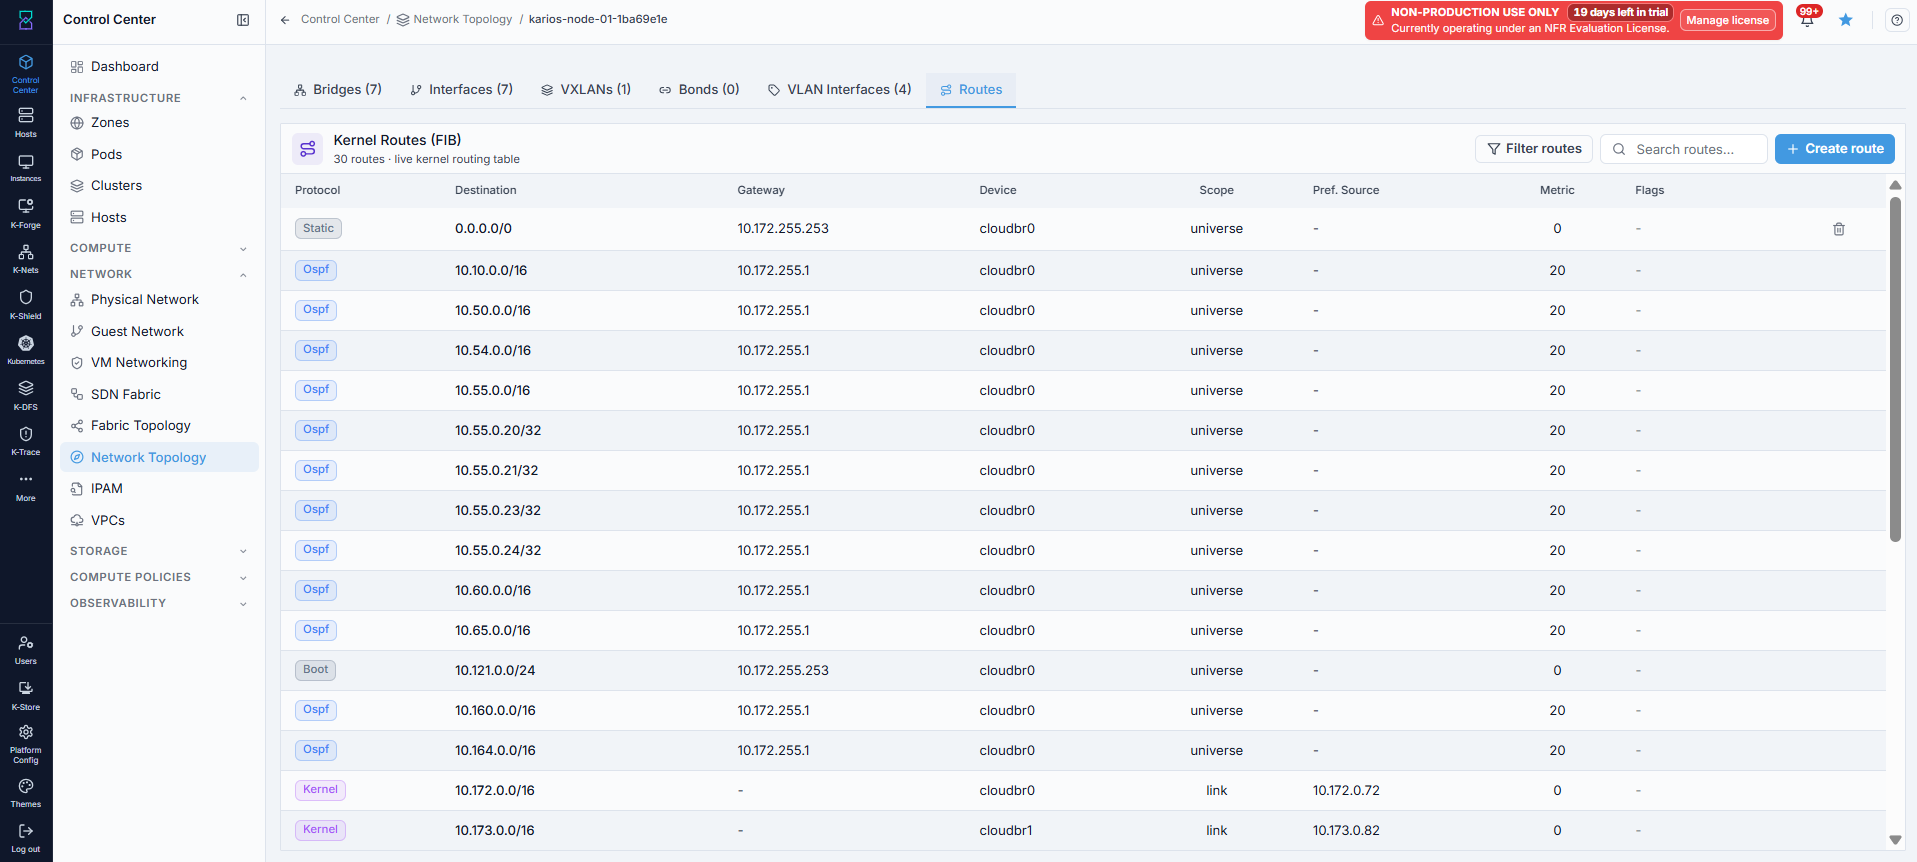
Routes Tab
Shows the same live kernel routing table (FIB) as the Kernel Routes tab under
SDN Fabric node details - Protocol, Destination,
Gateway, Device, Scope, Pref. Source, Metric, and Flags - reached
here from the Network Topology side instead. + Create route opens the same
Create kernel route form (Destination (CIDR), Gateway, Device,
Metric) described there.
Common Tasks
Check network health: start from
Network Health, then move toAlertswhen degraded.Investigate errors: open
Total Errorsand filter by node/device.Inspect a node: open node details and compare
Bridges,Interfaces,VXLANs,Bonds,VLAN Interfaces, andRoutes.Find MTU issues: use
MTU IssuesandAlertscategoriesMTUorMTU Drift.Verify overlay status: in
VXLANs, confirmTunnels Upaligns with expected tunnel count.
→ Next: IPAM