Events and Alerts
Use Events and Alerts for operational visibility:
Eventsshow what actions happened in the platform timeline.Alertsshow conditions that need operator attention.
Objective
Monitor platform activity quickly.
Detect failures early.
Capture enough context for escalation and troubleshooting.
Expected Operational Outcome
A new user can open both pages, identify risky rows, and extract the right context (resource, time, and state) for follow-up.
Completion Criteria
You can review Events and Alerts dashboards confidently.
You can open one event details page and read key fields.
You can classify which rows need immediate action versus monitoring.
Events
When to Use Events
Use Events when you need a comprehensive audit log of platform actions, user activity, and operation outcomes.
Step: Review Events
When to Use:
Use this first when starting incident triage from the Events timeline.
Purpose:
Identify high-risk operation failures quickly and establish timeline context.
Steps:
Open
Control Center -> Observability -> Events.Confirm the events table is loaded with the latest rows.
Start triage with
Level=ERRORandState=Failedto isolate high-risk operations first.Expand to additional filters after initial triage.
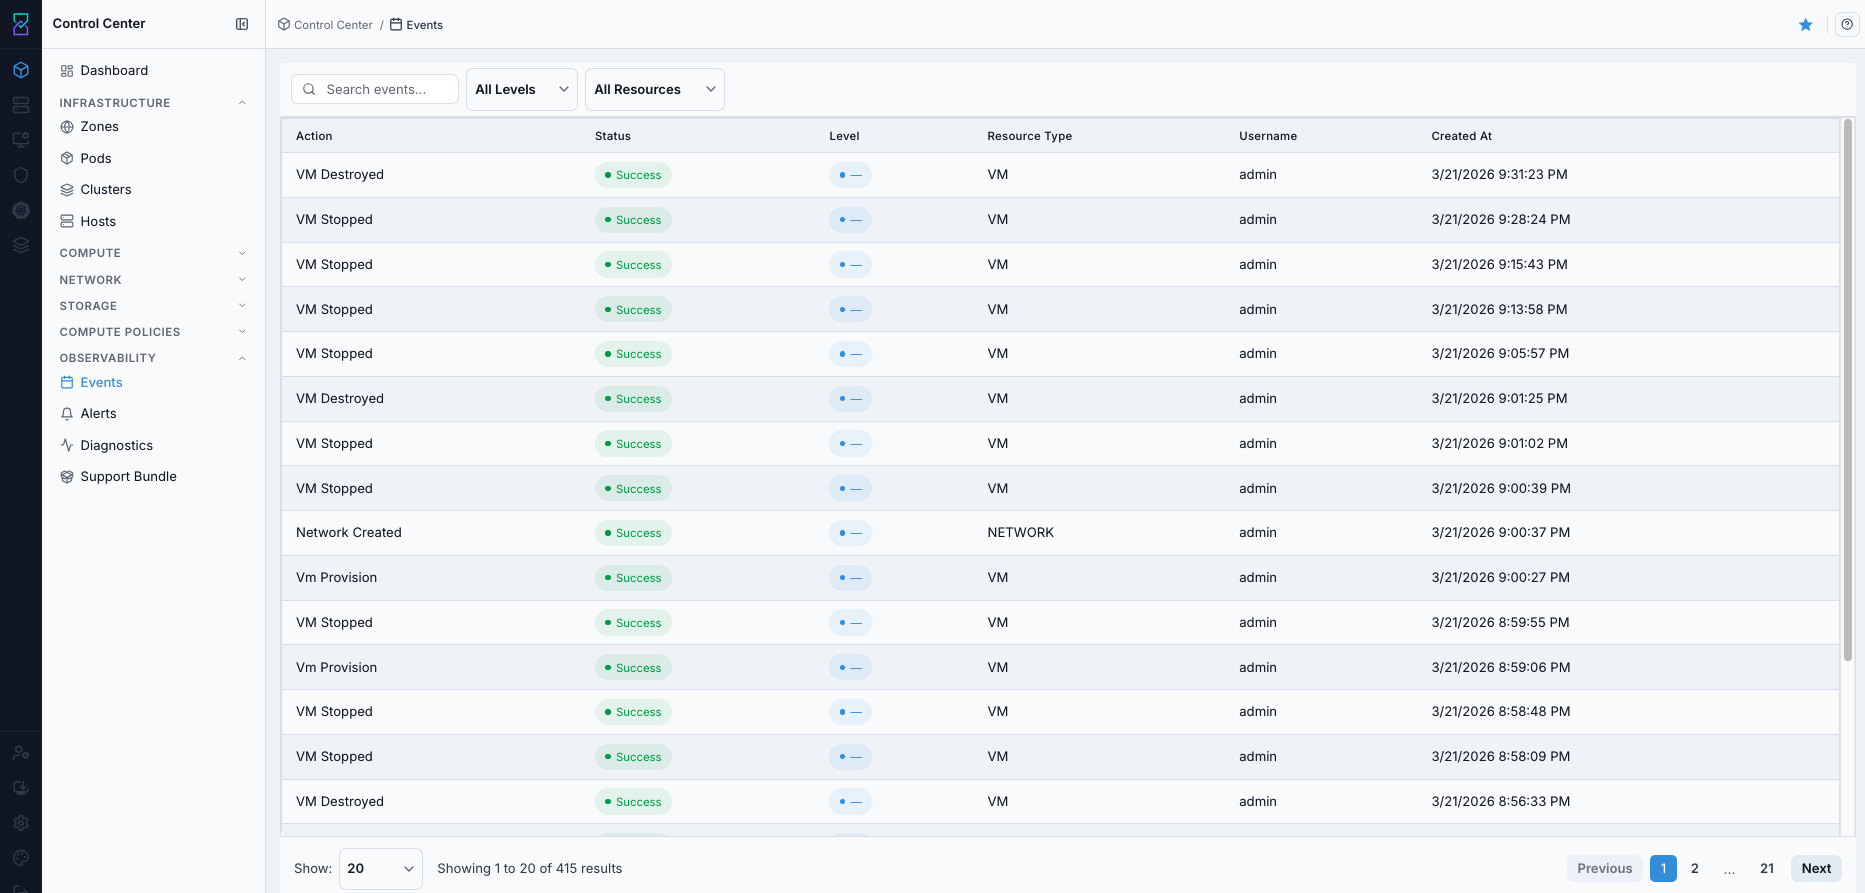
Events dashboard.
Tip
Start with Level=ERROR + State=Failed first, then widen scope to include related WARNING and INFO rows.
Warning
Event history is policy-based and often time-limited. Capture required incident evidence in the same session.
Expected Outcome:
You can identify high-risk rows quickly from state and level.
You can explain what happened, who triggered it, and when.
If this fails:
Refresh the page.
Re-apply
Level=ERRORandState=Failedfilters.
Step: Open Events Help
When to Use:
Use this when column, state, or level meanings are unclear during triage.
Purpose:
Confirm page-specific field definitions before acting on results.
Steps:
On the Events page, click the help icon.
Review definitions for columns, state, and level meanings.
Return to the table and continue triage with the same filters.
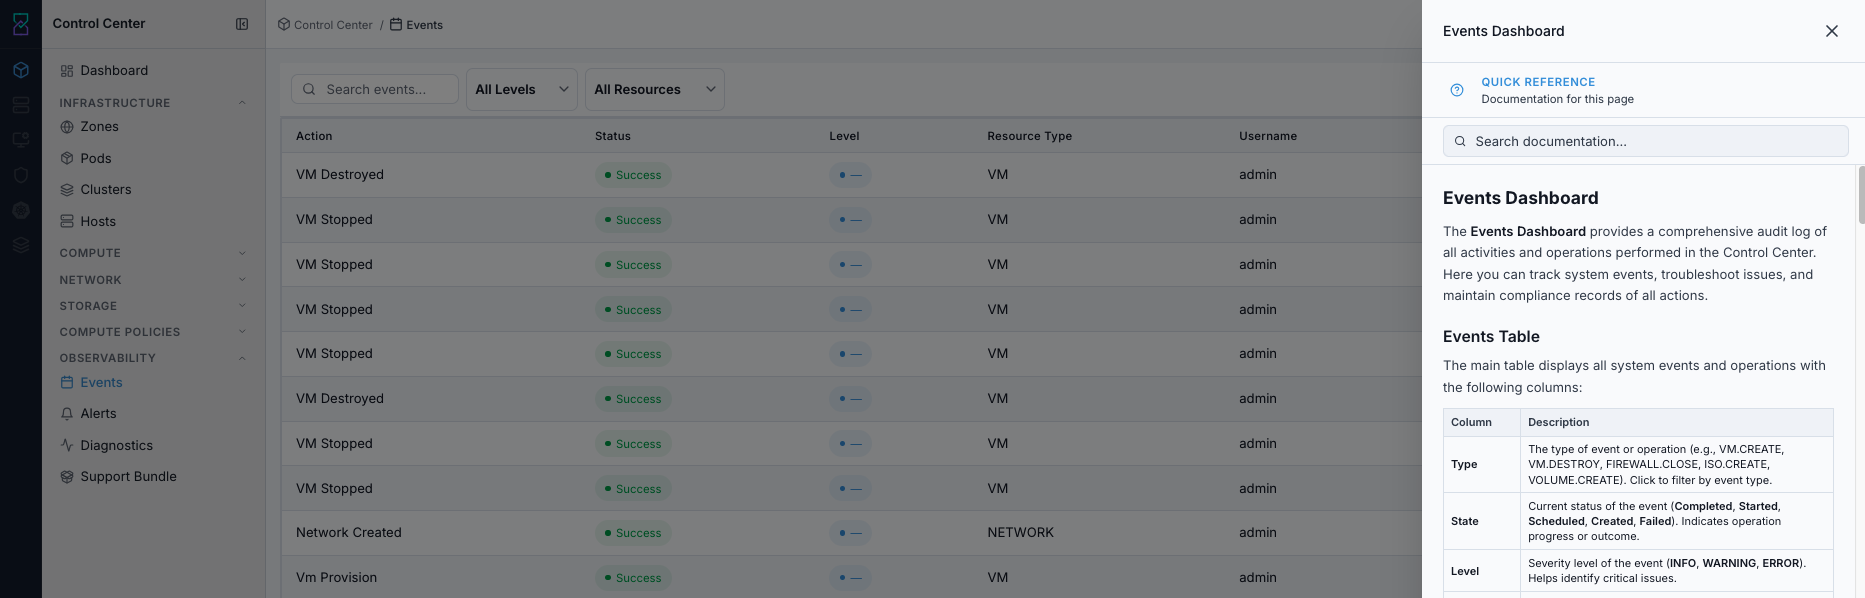
Events help panel.
Expected Outcome:
You can interpret Events fields consistently before filtering or escalation.
If this fails:
Refresh the page and reopen help.
Continue with field definitions from this guide if panel access is unavailable.
What the Events Table Shows
Column |
Description |
|---|---|
|
Event/operation type (for example |
|
Current operation status ( |
|
Severity level ( |
|
Resource impacted by the event (for example |
|
User who initiated the operation. |
|
Account associated with the event. |
|
Domain/organizational scope for the event. |
|
Event timestamp in |
Event Type Reference
Category |
Common types |
What it tracks |
|---|---|---|
VM operations |
|
VM lifecycle and mobility operations. |
Volume operations |
|
Volume provisioning and attachment lifecycle. |
Network operations |
|
Network and firewall changes. |
Storage operations |
|
Boot image and snapshot actions. |
User/security operations |
|
Identity and access-related events. |
Infrastructure operations |
|
Cluster/host lifecycle changes. |
System operations |
|
Platform-level maintenance and failure signals. |
State and Level Reference
State badges:
State |
Meaning |
Operator guidance |
|---|---|---|
|
Operation finished successfully. |
No immediate action unless additional validation is required. |
|
Operation in progress. |
Monitor to completion for long-running tasks. |
|
Operation queued; not started yet. |
Verify prerequisites and resource availability if it remains queued. |
|
Operation/resource created but not fully processed. |
Check for required follow-up steps if it does not advance. |
|
Operation did not complete. |
Investigate and remediate before rerun. |
Level badges:
Level |
Meaning |
Operator guidance |
|---|---|---|
|
Normal informational signal. |
Use for timeline/audit context. |
|
Potential issue; recoverable condition. |
Monitor and investigate if repeated. |
|
Failed operation or critical issue. |
Prioritize investigation and escalate when required. |
Tooltip and UI Cues
Use these in-screen cues during triage:
Typevalues are clickable for quick type filtering.StateandLevelbadge colors provide immediate status/severity context.Created Atgives precise sequencing for correlation with alerts and diagnostics.Pagination controls (page size, page navigation, result count) help navigate larger result sets.
Step: Filter and Search Events
When to Use:
Use this when raw event volume is too large for direct triage.
Purpose:
Narrow results to one action path or one incident window.
Steps:
Filter by
Typeto isolate one operation path (for exampleVM.CREATE).Filter by
Levelto prioritizeERRORandWARNINGrows.Filter by
Stateto focus onFailedor long-running states.Filter by
Resource Typeto isolate VM, volume, network, or image operations.Filter/search by
Usernamefor user-level activity tracking.Apply date/time window filters for incident-window analysis.
Use keyword search for resource names, IDs, or specific strings.
Use pagination controls (page size + navigation) for larger datasets.
Expected Outcome:
Results are narrowed to actionable rows without losing incident context.
If this fails:
Re-apply
Level=ERRORandState=Failed.Narrow the incident time window.
Filter by
Resource TypeorUsernameto isolate one action path.Re-check with one additional correlated filter only (avoid over-filtering).
Step: Open Single Event Details
When to Use:
Use this after identifying a high-risk row that needs escalation context.
Purpose:
Capture event and resource metadata in one place for accurate handoff.
Steps:
From
Events, open a target row (by clicking the event entry).In
Event Information, confirm:
Type
State
Level
Description
Created At
In
Resource Information, capture:
Resource TypeandResource Name
Resource ID
Account/Username/Domain
Use these fields in incident tickets or escalation notes.
Warning
Failed operations can leave resources in partial state. Verify current resource state before retrying any operation.
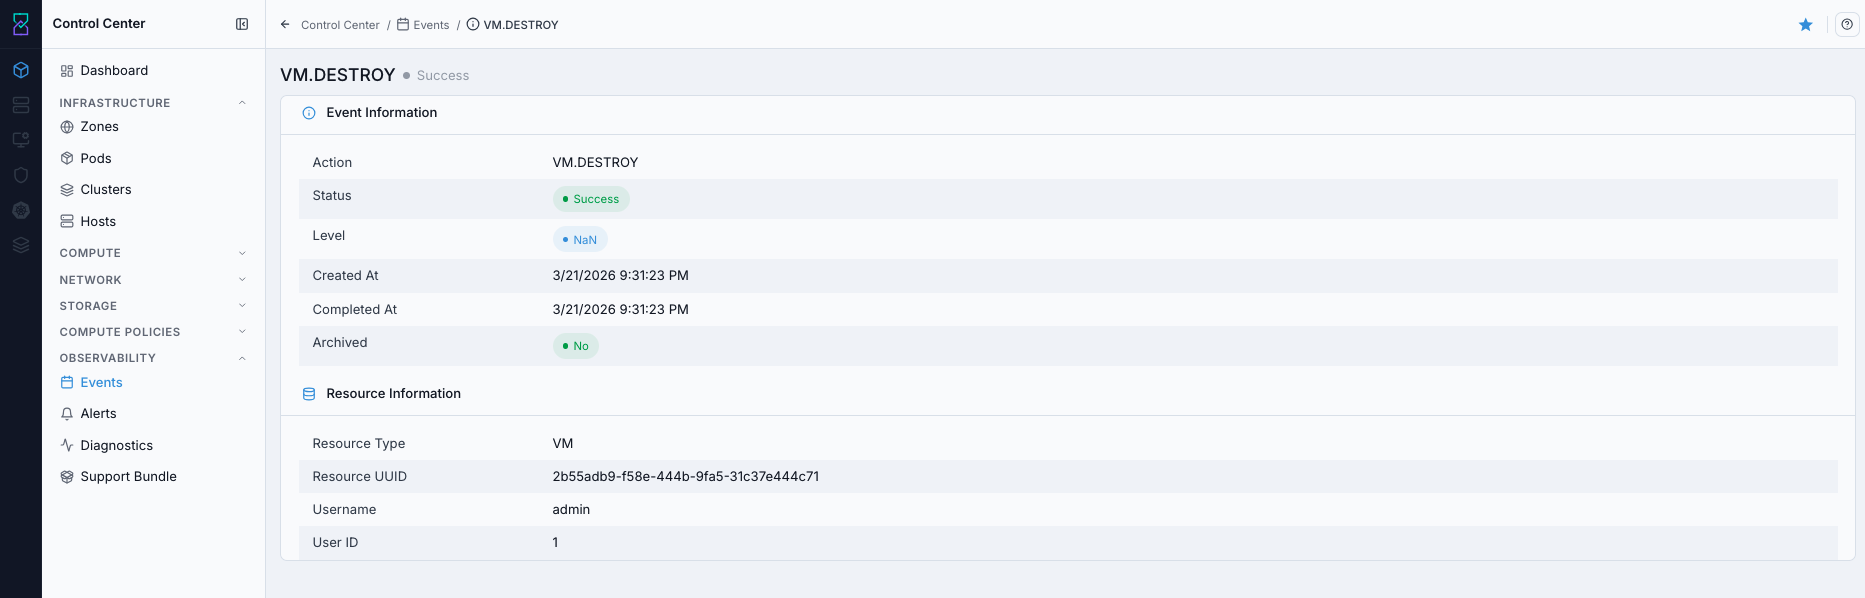
Single event details view.
Expected Outcome:
Type,State,Level, andCreated Atare captured.Resource IDand ownership context (account/user/domain) are captured.One escalation note can be written without returning to the table.
If this fails:
Reopen the event row from the filtered table.
Capture available metadata and continue with correlated alerts if detail data is partial.
Expected Outcome
You can quickly isolate failed operations.
You can produce an auditable timeline of who changed what and when.
You can escalate with complete evidence (event + resource + ownership context).
Alerts
When to Use Alerts
Use Alerts when you need system-generated notifications for infrastructure events, thresholds, and operational issues.
Step: Review Alerts
When to Use:
Use this first when triaging active platform risk conditions.
Purpose:
Identify the highest-impact alerts and establish a response order.
Steps:
Open
Control Center -> Observability -> Alerts.Sort by
Sentto start with most recent alerts.Prioritize critical alert categories first (for example
Host DownandVM Error).Use filters and search to isolate related alerts before deep triage.
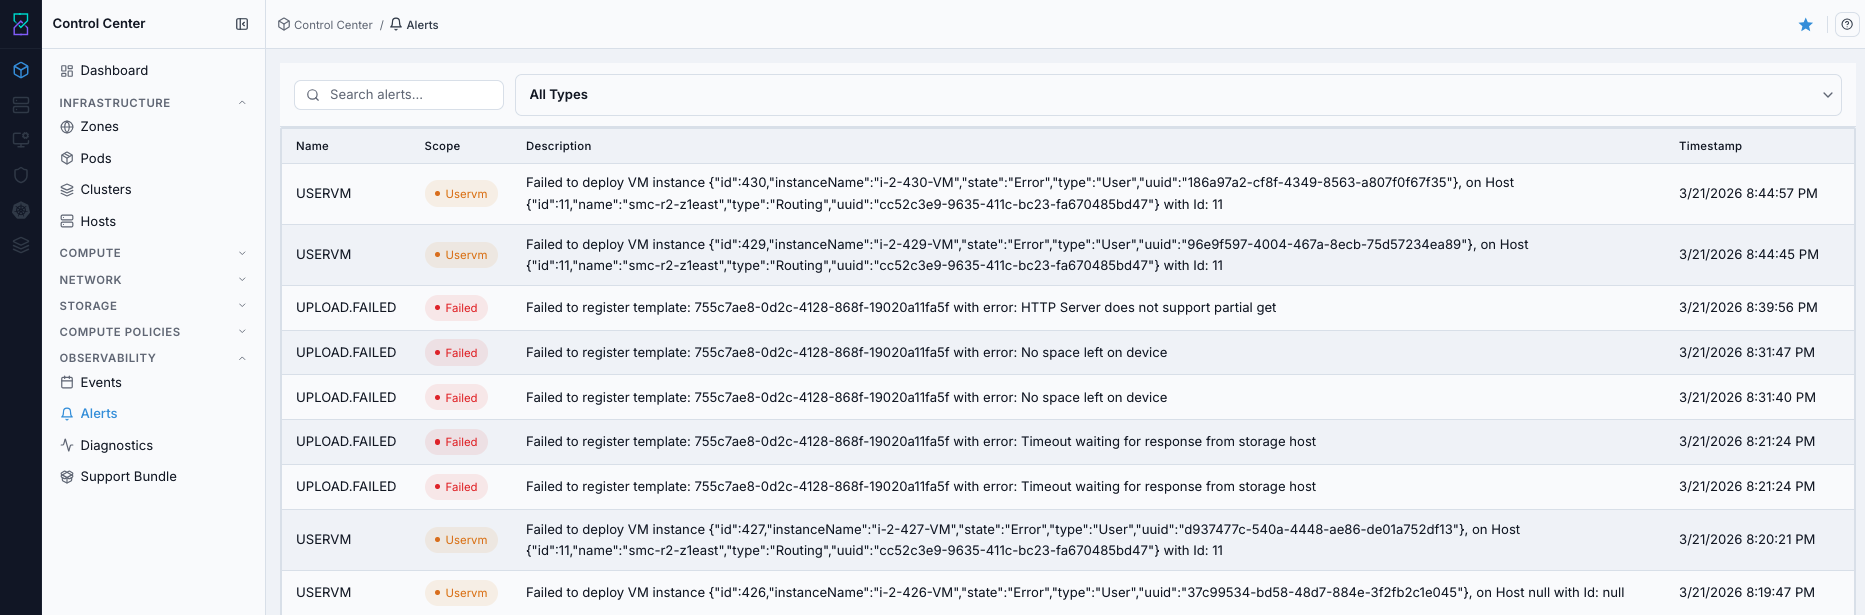
Alerts dashboard.
Tip
Sort by Sent first to assess current incident impact before reviewing older alerts.
Expected Outcome:
High-risk alerts are identified and ranked.
A clear action path exists for the highest-priority alert categories.
If this fails:
Clear filters and retry from newest rows.
Re-apply one filter at a time.
Step: Open Alerts Help
When to Use:
Use this when alert category meaning or operator action is unclear.
Purpose:
Confirm alert semantics and triage guidance before remediation decisions.
Steps:
On the Alerts page, click the help icon.
Review alert category guidance and triage context.
Return to the table and continue with type/search filters.
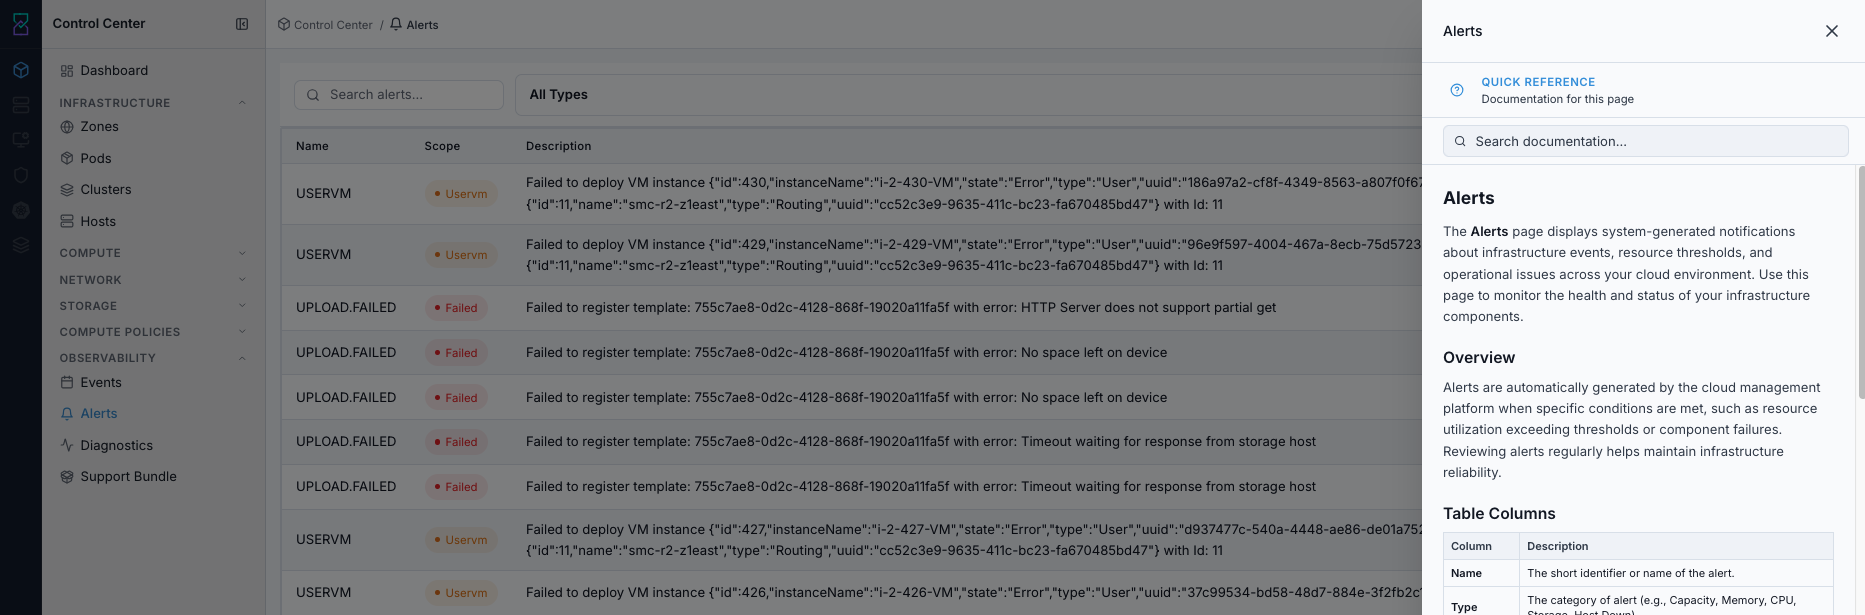
Alerts help panel.
Expected Outcome:
You can map alert categories to appropriate response actions.
If this fails:
Refresh and reopen help.
Continue with alert type definitions from this guide.
What the Alerts Table Shows
Column |
Description |
|---|---|
|
Short identifier/name of the alert. |
|
Alert category (for example Capacity, Memory, CPU, Storage, Host Down). |
|
Detailed trigger/context message for the alert. |
|
Alert message summary. |
|
Timestamp when the alert was generated/sent. |
Alert Type Reference
Type |
Description |
|---|---|
|
Overall resource capacity thresholds reached. |
|
Physical/virtual memory usage exceeded limits. |
|
Processor utilization is critically high. |
|
Storage pool usage exceeded thresholds. |
|
Allocated storage space is nearing limits. |
|
Public IP pool is nearing exhaustion. |
|
Private IP range is running low. |
|
Host node reported an issue. |
|
Virtual machine encountered an error. |
|
Domain virtual router has an issue. |
|
Console proxy service is not responding. |
|
Network routing issue detected. |
|
Miscellaneous storage subsystem issue. |
|
Usage data collection server issue. |
|
Management server reported a problem. |
|
Host node is unresponsive/offline. |
|
VM live migration encountered an error. |
|
Image Storage reported an issue. This alert type still uses the legacy backend name |
|
Usage server returned unexpected results. |
|
Storage deletion operation error. |
|
Resource count update failed. |
|
Usage sanity check found inconsistencies. |
|
Direct attached public IP issue detected. |
|
Local (non-shared) storage issue. |
|
Account/domain resource limits are being approached. |
|
Synchronization between components failed. |
|
Boot image/template upload operation failed. |
|
VM snapshot operation failed. |
Step: Filter and Search Alerts
When to Use:
Use this when alert volume is high and triage requires focused filtering.
Purpose:
Reduce alert noise to the affected service/resource and incident window.
Steps:
Use
All Typesto isolate a specific alert category.Use search to filter by alert name/content (host, VM, storage pool, or other keywords).
Use
Sentordering to focus on the newest alerts first.Narrow to a time window when investigating an incident.
Expected Outcome:
Filtered results contain only actionable alerts for the current incident path.
If this fails:
Keep only one
Typefilter active.Add one keyword for the affected resource.
Reduce to the exact incident window.
Step: Prioritize and Recheck Alerts
When to Use:
Use this after filtering alerts to decide response order and verify recurrence.
Purpose:
Apply a consistent triage sequence and confirm remediation effectiveness.
Steps:
Prioritize
Host DownandVM Errorfirst (highest service-impact risk).Prioritize
CapacityandStoragenext (resource planning and risk mitigation).Prioritize
MemoryandCPUfor workload balancing and scaling actions.Track
Resource Limitfor proactive quota expansion before operations are blocked.
Warning
Alerts do not resolve by themselves in workflow terms; address root cause and verify recurrence has stopped.
Expected Outcome:
Alert triage order is clear and active-risk items are worked first.
If this fails:
Confirm new
Senttimestamps are still appearing.Re-check dependencies and recent changes.
Escalate with alert IDs and timestamps.
Expected Outcome
You can identify which alert categories are highest risk.
You can filter quickly to the affected resources and time window.
You can apply a consistent triage process and verify recurrence is resolved.